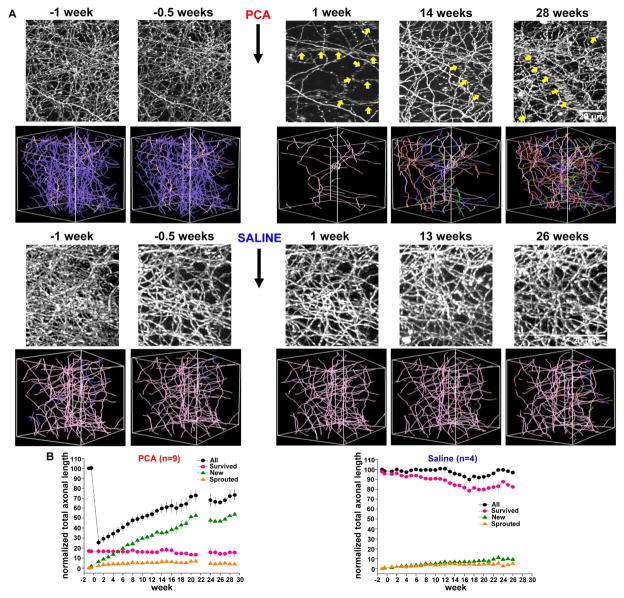
Figure 3. Long-term in vivo imaging reveals serotonin axon regrowth in the adult mouse brain.
(A) Exemplar maximal z-projection (top) and 3D axonal tracing images (bottom) after PCA treatment show massive degeneration of serotonin axons and subsequent slow recovery over 29 weeks. Purple and pink color axons in 3D images indicate degenerated and survived axons, respectively. Each of the many other colors codes for the week of first appearance of a new axon entering the field of view (for example, new axonal segments appearing in week 6 are orange and those appearing in week 11 are red). Serotonin axons were highly stable in response to saline treatment. The tubular structures composed of many horizontally-elongated puncta in the z-stack images are blood vessels filled with serotonin-transporter-positive platelets (Marcusson and Ross, 1980). These blood vessels are indicated with yellow arrows.
(B) Population data for the measure of normalized total axonal length after PCA (n = 9) and saline (n = 4) treatment revealed that the recovery following PCA treatment is dominated by new axons.

