Abstract
Anisotropy, or alternatively, isotropy of phase transformations extensively exist in a number of solid-state materials, with performance depending on the three-dimensional transformation features. Fundamental insights into internal chemical phase evolution allow manipulating materials with desired functionalities, and can be developed via real-time multi-dimensional imaging methods. Here, we report a five-dimensional imaging method to track phase transformation as a function of charging time in individual lithium iron phosphate battery cathode particles during delithiation. The electrochemically driven phase transformation is initially anisotropic with a preferred boundary migration direction, but becomes isotropic as delithiation proceeds further. We also observe the expected two-phase coexistence throughout the entire charging process. We expect this five-dimensional imaging method to be broadly applicable to problems in energy, materials, environmental and life sciences.
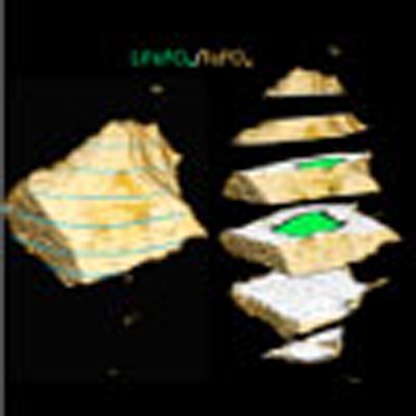 Spatiotemporal phase evolution during transformations impacts materials performance in many systems. Here the authors use lithium iron phosphate particles inside a custom-designed battery to characterize in three dimensions the two-phase configuration at various states of charge via X-ray tomography.
Direct observation of anisotropic (isotropic) phase transformation and mapping phase evolution is of importance in design and optimization of functional materials. X-ray tomography allows for characterization of the three-dimensional (3D) internal structure of large-volume structures1,4. This technique has long been used in life, medical and earth sciences to deliver 3D morphology information at micron-scale resolution5,6. In recent years, lens-based full-field transmission x-ray microscopy (TXM) with nanotomography capability has seen growing use in studying energy-storage materials7,8,9,10. Further progress in observing intermediates and chemical phases responsible for materials' performance requires quantitative measurement methods combining chemical sensitivity and high spatial resolution.
X-ray absorption near-edge structure (XANES) spectroscopy is sensitive to chemical and local electronic change of the probed element, and has been extensively exploited in characterizing fine structural change in a large variety of materials11,12. In combination with TXM, XANES enables mapping and tracking of chemical evolution under in situ conditions13,14,15,16,17. Nevertheless, the in situ XANES mapping approach has largely been restricted to two-dimensional (2D) observation as the obtained signal is usually spatially integrated along depth direction. For anisotropic phase transformations, quite common in technologically important materials, the method is limited in its ability to accurately capture phase evolution. Although tomographic scans at dual (below and above the adsorption edge of the studying element) and multiple energies have been achieved to identify the chemical element distribution18,19, it remains very challenging to carry out in situ studies on energy-storage materials, which requires accurately tracking chemical phase evolution in 3D with nanoscale resolution and correlating it to electrochemical performance. To pursue such studies using XANES requires reliable collection of multiple images over a 180°-rotation range at each energy point with sufficient energy resolution with the energy scanned across the absorption edge of the element of interest to produce a spectrum for each voxel of the sample inside a working electrochemical cell. Such an undertaking poses numerous technical and experimental difficulties.
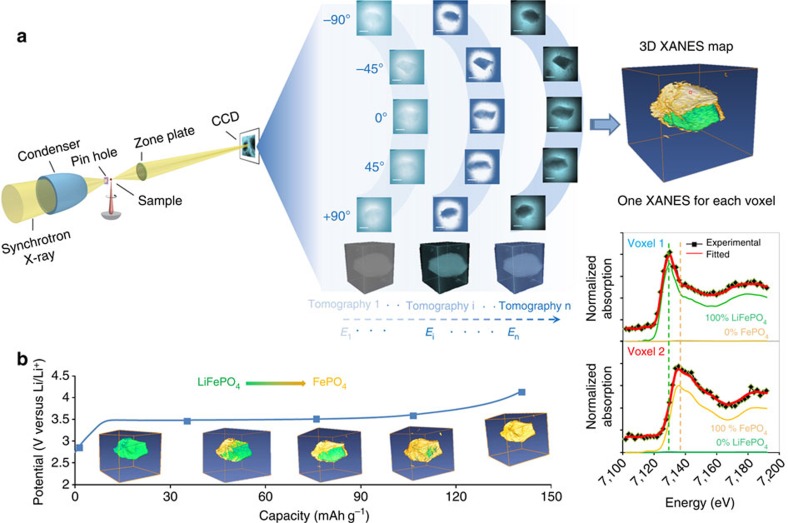
Here, using full-field hard X-ray microscopy, we demonstrate an implementation of in situ XANES nanotomography able to build five-dimensional (5D) data sets tracking phase evolution in lithium iron phosphate particles in a working lithium-ion battery. Olivine lithium iron phosphate (LiFePO4) was selected as a model material because of its well-known two-phase process and representative behaviours for many energy materials20. Many-particle scale intercalation behaviour and atomic-scale phase transformation behaviours have been discussed in previous reports, but 3D features of single-particle phase evolution are yet to be fully established21,22. Figure 1 illustrates the basic principle of our approach, which is demonstrated using our full-field TXM with recently developed automated markerless tomography capability23. One specific feature of the setup is a built-in run-out correction system which enables automated tomography. First, this eliminates the need for a marker mounted on the sample or a special feature inside of the sample, enabling a wider range of samples to be studied and easier sample preparation. Second, manual alignment of hundreds of 2D projection images for 3D reconstruction becomes unnecessary, facilitating increased 3D spatial resolution through rapid collection of many projections and enabling time-resolved studies. Another important feature of the setup is that the image distance, the distance of the CCD detector to the zone plate lens, is automatically adjustable as a function of energy, which ensures that optimal resolution is preserved throughout energy scans. Together, these features make it practically feasible to combine XANES and nanotomography to study in situ phase transformations in 3D at nanoscale resolutions.
Figure 1. 5D XANES tomography.
(a) Schematic of experimental setup. A tomography data set spanning −90° to +90° is collected at each photon energy step (7,102 to 7,192 eV, 2 eV per step) across the near absorption K-edge of iron to produce chemical information for each voxel. By fitting the resulting spectra as a linear combination of spectra of end-phases, phase composition can be assigned to each voxel (shown in the right side of panel). (b) Chemical phase distribution as a function of capacity (or equivalently, time).
Results
Principle of XANES tomography
To acquire 3D XANES maps under in situ electrochemistry conditions, we designed a very compact half-cell fitting inside a quartz capillary, which enables us to record 2D projections over a complete angular range of 180° (see Supplementary Figs 1–2, Supplementary Movie 1) to ensure quality of 3D reconstructed structure. Figure 1 shows the basic principle of XANES tomography. At each charging stage (equivalently, point in time), a full series of 2D images were collected at each energy point to reconstruct the 3D structure, and a total of 46 energy points data sets were recorded across the near absorption K-edge of iron element (photon energy ranges from 7,102 to 7,192 eV with 2 eV per step). These 46 energy-dependent tomography data sets combined result in a 256 × 256 × 256 voxels 3D XANES data, where each voxel contains its own XANES spectrum. Each XANES spectrum of 256 × 256 × 256 voxels was then fitted as a linear combination of the bulk spectra of two standard olivine phosphate phases (LiFePO4 and FePO4) for all voxels, yielding a 3D map of the phase distribution over the sample volume (see Supplementary Figs 3–6). By repeating above procedure as charging proceeds, 3D chemical phase transformation evolution as a function of charging time can be rendered, as shown in Fig. 2.
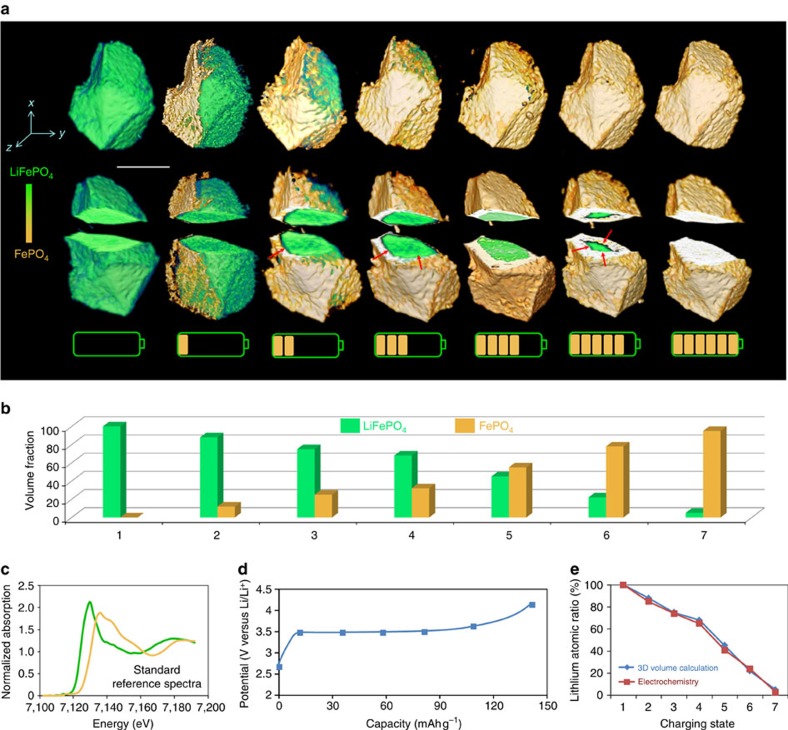
Figure 2. Chemical phase evolution.
(a) Phase distribution as a function of charging time. The cut-away views reveal a change from anisotropic to isotropic phase boundary motion. (b) Phase volume fraction obtained from 3D quantitative analysis. (c) Standard XANES spectra for LiFePO4 and FePO4, showing clear energy shift of Fe K-edge. (d) The charging profile of LiFePO4 battery. XANES tomographic data sets were collected at the points indicated by the blue rectangles. (e) Agreement between lithium atomic ratio obtained from electrochemical measurement and from 3D volume analysis. Scale bar, 10 μm.
5D chemical phase evolution
At the beginning of charging, phase boundary propagation is anisotropic with preferred paths, aligned imperfectly along a certain direction (Fig. 2a). The two-phase boundary moves primarily along the y-axis and then has an inclination toward z-axis, so a curved rather than flat phase interface is observed, as presented in cut-away view in Fig. 2a. To provide more detail on the anisotropic phase transformation, 3D morphology of the micron-sized particle at an earlier stage under charging is shown in Supplementary Fig. 7 and Supplementary Movies 2–5. The projected views and the corresponding 3D morphologies reveal a strong dependence on directions, which is associated with anisotropic lithium-ion diffusion. More details are clearly demonstrated in 3D morphologies shown in the two split-phase images in Supplementary Fig. 7.
With further charging, the particle becomes more delithiated and the phase boundary is seen to move along more directions and presents relatively isotropic features. This complex phase transformation behaviour is related to lithium-ion diffusion and misfit strain within solids24,25. In micron-sized particles, the ratio of surface energy to elastic energy is low, and misfit strain of the olivine phases can be relieved by the formation of cracks or structural dislocations17,26. Consequently, the weak driving force leads to phase boundaries propagating along preferential planes, producing the observed anisotropic behaviour at the beginning. As delithiation proceeds, the large lithium chemical potential gradient and growing internal strains may provide sufficient driving forces to move boundary propagation along multiple directions, producing the evolution towards isotropy as delithiation proceeds.
In addition to visualizing the evolution of phase distribution, our approach also allows quantitative determination, at particle scale, of phase composition by calculation of the 3D volume assigned to each phase. The determined volume fractions as a function of charging time are shown in the histograms in Fig. 2b, indicating a continuous phase transformation from LiFePO4 to FePO4 (the normalized Fe K-edge XANES spectra for standard LiFePO4 and FePO4 phases in Fig. 2c show a 2 eV energy shift, representing the classic two-phase transformation from Fe2+ to Fe3+), which is consistent with the state-of-charge obtained from the electrochemical charging protocol (Fig. 2d,e, Supplementary Fig. 8). The consistency between the 3D quantitative analysis and electrochemical performance measurement provides a validation of the in situ XANES mapping approach.
Internal phase distribution in partially charged LiFePO4
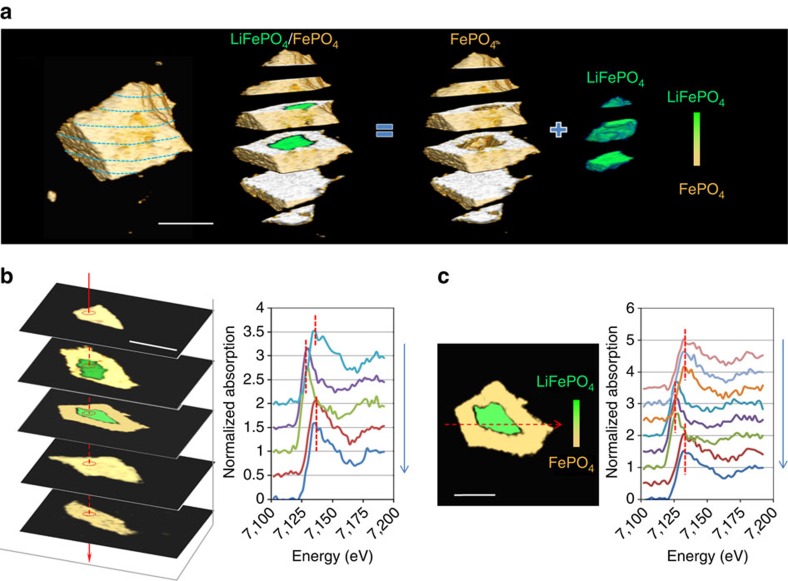
In addition to the anisotropic (and isotropic) phase transformation behaviours described, we observe two-phase coexistence within the LiFePO4 particle during the charging process. Particularly, when phase boundaries propagation changes from preferred directions (anisotropy) to multiple directions (isotropy) at highly delithiated state, a core-shell structure is clearly observed. A magnified cross-section view of LiFePO4 at a highly delithiated state is rendered in Fig. 3a, showing the core-shell internal structure with small amounts of the initial LiFePO4 phase (green) remaining inside. To quantitatively investigate the internal structure, a series of XANES spectra are extracted from the stack of slides vertically (Fig. 3b) and horizontally (Fig. 3c). Both stacks of spectra show a significant shift of about 2 eV (Fe K-edge) in energy, which is consistent with the standard spectra for LiFePO4 and FePO4, indicating that internal phase composition is either LiFePO4 or FePO4 with the absence of intermediate phases. Thus 3D XANES imaging of the internal structure provides further evidence that the classic two-phase coexistence for LiFePO4 persists at these reduced length scales.
Figure 3. Sliced analysis of partially charged LiFePO4.
(a) Sliced view of LiFePO4 at highly delithitated state. The sliced view reveals 3D internal core-shell phase distribution. (b) Cross-sectional slides and the corresponding XANES spectra along vertical axis. The spectra indicate the phase is either LiFePO4 or FePO4. (c) Line profile of XANES spectra along the horizontal axis at the selected cross-section slide. The spectra also indicated the chemical composition is either single LiFePO4 or FePO4 phase. Scale bar, 10 μm.
Discussion
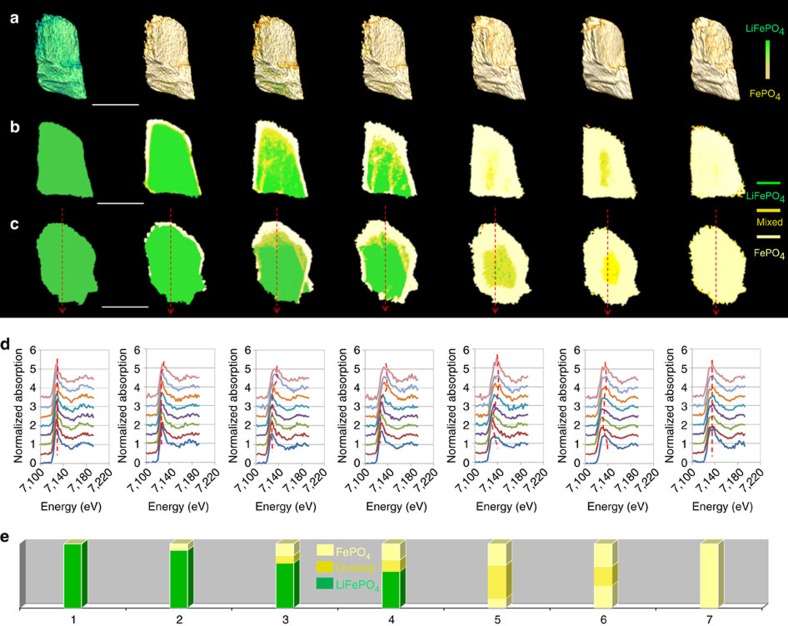
The observed two-phase behaviour provides a concrete example for illustrating the limitations of 2D imaging approaches due to the unavoidable loss of chemical information along projection direction. Figure 4a shows the XANES tomography data for the same sample at a different view of angle, and as a comparison, the corresponding 2D projection maps at the two different orientations are shown in Fig. 4b,c. Large apparent deviation is observed between these 2D and 3D XANES maps. The 2D XANES maps in Fig. 4 appear to imply some ‘new'/‘intermediate' phases, especially for highly delithiated states (dark yellow colour in Fig. 4b,c and many consecutive irons K-edge energy shifts in Fig. 4d,e). A similar phenomenon was also observed in an operando 2D study (Supplementary Figs 9–12), which was performed on a similar sample in a conventional coin cell (the setup in Supplementary Fig. 9). Although ‘new'/‘intermediate' phases appear in these 2D XANES maps, it is hard to make any accurate chemical determination from the projected maps (Supplementary Figs 10–12). In reality, these ‘new' or ‘intermediate' phases are an artefact caused by the difficulty of uniquely interpreting complex 3D structures on the basis of projected images. As demonstrated here for the single-particle transformation in LiFePO4, non-destructive XANES tomography avoids such difficulties, enabling more robust insight into internal and 3D evolution phase distribution during a chemical transformation.
Figure 4. 2D projections of full data sets.
(a) 3D phase distribution evolution at a different visual angle from Fig. 2. From this view, it is difficult to make any conclusion about anisotropy/isotropy of phase transformation. (b,c) 2D projection XANES maps obtained from two different angles. These maps spatially compress chemical information, particularly for highly charged states where chemical phase identification becomes increasingly difficult. (d,e) 2D projection XANES and composition analysis obtained from the line profile in c. Some ‘intermediate' phases are detected, but are, in reality, artefacts resulting from the projected view. Scale bar, 10 μm.
Our work extends nanotomography to directly observe 3D phase transformation in solid-state materials as a function of both energy and time, revealing internal phase composition, evolving anisotropy of transformation and two-phase coexistence. Continuing advances in optics and growing availability of high-brightness synchrotron sources will allow this 5D chemical-imaging approach to capture faster processes accompanying electrochemical reactions and phase transformations. A result of particular interest is the correlation between 3D phase transformation and electrochemical capacity, showing correspondence between single-particle processes and performance which can be exploited in future efforts in materials development. Our methods for incorporating in situ electrochemical analysis can be potentially applied to other emerging imaging technologies such as lenseless coherent diffractive imaging to achieve higher spatial resolution, beyond X-ray optics resolution limits26,27,28,29.
Methods
Materials and electrode preparation
LiFePO4 powder, acetylene black and polyvinylidene fluoride (Sigma-Aldrich) with a weight ratio of 40:40:20 were mixed thoroughly in N-methyl-2-pyrrolidone solvent (Sigma-Aldrich), and the resultant slurry was pasted on commercial carbon paper (Toray Carbon Paper TGP-H-030). The electrode was dried under vacuum at 100 °C overnight and ready for use.
Assembly of compact in situ electrochemical cells
The above LiFePO4 electrode was cut into a trapezoidal shape (∼40 μm short side, 800 μm long side and 1 cm height) under optical microscopy (LEICA DM4000M) with short edge to fit in the field of view (40 × 40 μm2) of the TXM. On the basis of the LiFePO4 loading of ∼0.6 mg cm−2, the trapezoid-shaped working electrode (∼0.045 cm2) contains ∼0.027 mg LiFePO4. Lithium foil and 1 M LiPF6 (dissolved in a solvent consisting of 50% ethylene carbonate and 50% dimethyl carbonate by volume) were used as the counter electrode and the electrolyte, respectively. The compact cell was fabricated in a quartz capillary (1 mm diameter) in an argon-filled glove box and sealed with epoxy. Two gold wires (0.5 mm diameter) connected the two electrodes to an external potentiostat to perform electrochemical measurement. As the LiFePO4 electrode was immersed completely in conventional electrolytes, this cell design is compatible with most conventional electrochemical measurements such as cyclic voltammetry and discharge/charge tests. The cells are stable enough to allow extended electrochemical cycling (over weeks) under x-ray characterization.
In situ XANES tomographic data collection
The assembled cell was imaged using TXM at beamline X8C, National Synchrotron Light Source (Brookhaven National Laboratory, BNL). In situ electrochemical measurements were performed using a multichannel potentiostat (VMP3). Delithiation of LiFePO4 was galvanostatically carried out from an open-circuit potential to 4.2 V. Considering the large LiFePO4 particle size and low electronic/ionic conductivity, a low charge current corresponding to ∼0.01 C was used. XANES tomography data sets were collected at each stage of delithiation.
At each delithiation stage, energy scan ranges from 7,102 to 7,192 eV with 2 eV per step (46 energy steps in total). At each energy step, a tomography data set was collected using 361 projections over an angular range of 180° at a large field of view of 40 × 40 μm2 (binning 8 × 8 camera pixels into one output pixel). A total of 46 tomography data sets were collected at every 2 eV energy step across near absorption K-edge of iron, which enables the tracking chemical phases in each voxel of the sample throughout cycling.
Before reconstruction, raw data were corrected with a built-in run-out correction system which allows for automatic tomography alignment at beamline X8C.
Tomographic XANES data analysis
Tomographic analysis of XANES data was carried out using customized software written in Matlab (MathWorks, R2011b) and developed in house at beamline X8C (NSLS, BNL). In all, 46 tomographic data sets were first reconstructed by standard filtered back-projection algorithm, yielding 46 reconstructed volumes for each time point. In combination with the corresponding tomographic slide at each energy step, a XANES data set was obtained for each voxel. A total of 256 × 256 × 256 XANES data sets were generated to map chemical information in 3D. On the basis of Beer's Law, the attenuation of x-rays by a given phase with attenuation coefficient, μ and thickness, t can be written as:
 |
where, I0 is the incident x-ray intensity and I is the transmitted x-ray intensity. Notice that μ is a function of energy and can be attributed in our experiments to one of two phases: LiFePO4 and FePO4.
The scaled −ln(I/I0) at each of the 256 × 256 × 256 voxels was then fitted with the linear combination of two ‘pure-phase' μ values. The ratio of the weighting factor is analogous to the fraction of thicknesses of the phases, that is, to the volume ratio, as implied by,
 |
The fitting was carried out by minimizing the R value for each spectrum (for each voxel) with the definition,
 |
where, Ei is 7,102 eV, Ef is 7,192 eV, dataE is the −ln(l/l0) value for the given voxel at energy E, the refE is the reference −ln(l/l0) value, obtained from a linear combination of LiFePO4 and FePO4.
Standard reference XANES spectra were obtained measured using commercial materials, LiFePO4 (MTI Corp, USA) and FePO4 (Sigma, USA).
After the above linear combination fitting, 3D phase distribution (LiFePO4 and FePO4) at each delithiation step was retrieved. Following the same data analysis procedure, 5D visualizations (x, y, z, delithiation time and photon energy) of the phase transformation in LiFePO4 were rendered.
Operando 2D TXM experiment
The operando 2D TXM experiment was performed on conventional 2,032 coin cells with Kapton windows14,15,17. Lithium metal was used as the counter electrode and 1 M LiPF6 in a mixture of ethylene carbonate/dimethyl carbonate (EC/DMC, 1:1 by volume) as the electrolyte. The above LiFePO4 electrode was used as the working electrode. To track phase transformation, charge–discharge characteristics at a potential range between open-circuit potential to 4.2 V (versus Li/Li+) was performed at room temperature. To study the chemical state evolution, a full XANES image series was collected at each charging stage during the delithiation process. Each XANES image series was measured by scanning Fe absorption K-edge from 7,092 to 7,192 eV, with 2 eV step size, and one TXM image at one energy step, which generated 1 k × 1 k XANES spectra with 2 × 2 binned pixels. Each image was collected with 10 s exposure time. Camera pixels (2 × 2) were binned into one output image pixel.
Data availability
The data that support the findings of this study are available from the corresponding author on request.
Additional information
How to cite this article: Wang, J. et al. Visualization of anisotropic-isotropic phase transformation dynamics in battery electrode particles. Nat. Commun. 7:12372 doi: 10.1038/ncomms12372 (2016).
Supplementary Material
Supplementary Figures 1-12
2D projections over 180 degree range showing irregular shape of LiFePO4 particle
3D chemical phase distribution showing core-shell morphology in partially delithiated LiFePO4 particle
Inner LiFePO4 core in partially delithiated LiFePO4 particle
Outer shell of FePO4 in partially delithiated LiFePO4 particle
Cut-away view of 3D chemical phase distribution in partially delithiated LiFePO4 particle
Acknowledgments
This work was supported by a Laboratory Directed Research and Development (LDRD) project at Brookhaven National Laboratory. The use of the NSLS was supported by the U.S. Department of Energy, Office of Basic Energy Science under contract number DE-AC02-98CH10886.
Footnotes
Author contributions Ju.W. and Q.S. conceived the overall project; Ji.W. designed/performed the experiments and data analysis; Y-c.K.C.-W performed some of the experiments and data analysis; Ji.W. and Ju.W. interpreted the results and wrote the manuscript. Y-c.K.C.-W and C.E. discussed the results.
References
- Amin R., Balaya P. & Maier J. Anisotropy of electronic and ionic transport in LiFePO4 Single Crystals. Electrochem. Solid State Lett. 10, A13–A16 (2007). [Google Scholar]
- Tang M., Belak J. F. & Dorr M. R. Anisotropic phase boundary morphology in nanoscale olivine electrode particles. J. Phys. Chem. C 115, 4922–4926 (2011). [Google Scholar]
- Ebner M., Marone F., Stampanoni M. & Wood V. Visualization and quantification of electrochemical and mechanical degradation in Li ion batteries. Science 342, 716–720 (2013). [DOI] [PubMed] [Google Scholar]
- Finegan D. P. et al. In-operando high-speed tomography of lithium-ion batteries during thermal runaway. Nat. Commun. 6, 6924 (2015). [DOI] [PMC free article] [PubMed] [Google Scholar]
- Donoghue P. C. J. et al. Synchrotron X-ray tomographic microscopy of fossil embryos. Nature 442, 680–683 (2006). [DOI] [PubMed] [Google Scholar]
- Moosmann J. et al. X-ray phase-contrast in vivo microtomography probes new aspects of Xenopus gastrulation. Nature 497, 374–377 (2013). [DOI] [PMC free article] [PubMed] [Google Scholar]
- Wang J., Chen-Wiegart Y. K. & Wang J. In situ three-dimensional synchrotron x-ray nanotomography of the (de) lithiation processes in tin anodes. Angew. Chem. Int. Ed. 53, 4460–4464 (2014). [DOI] [PubMed] [Google Scholar]
- Yang F. et al. Nanoscale morphological and chemical changes of high voltage Lithium–manganese rich NMC composite cathodes with cycling. Nano Lett. 14, 4334–4341 (2014). [DOI] [PMC free article] [PubMed] [Google Scholar]
- Nelson Weker J. et al. In situ nanotomography and operando transmission X-ray microscopy of micron-sized Ge particles. Energy Environ. Sci. 7, 2771–2777 (2014). [Google Scholar]
- Wang J., Eng C., Chen-Wiegart Y. K. & Wang J. Probing three-dimensional sodiation–desodiation equilibrium in sodium-ion batteries by in situ hard X-ray nanotomography. Nat. Commun. 6, 7469 (2015). [DOI] [PMC free article] [PubMed] [Google Scholar]
- Yang J. et al. In situ self-catalyzed formation of core-shell LiFePO4@CNT nanowires for high rate performance lithium-ion batteries. J. Mater. Chem. A 1, 7306–7311 (2013). [Google Scholar]
- Wang J. et al. Surface aging at olivine LiFePO4: a direct visual observation of iron dissolution and the protection role of nano-carbon coating. J. Mater. Chem. A 1, 1579–1586 (2013). [Google Scholar]
- Li Y. et al. Current-induced transition from particle-by-particle to concurrent intercalation in phase-separating battery electrodes. Nat. Mater. 13, 1149–1156 (2014). [DOI] [PubMed] [Google Scholar]
- Wang J., Chen-Wiegart Y. K. & Wang J. In situ chemical mapping of a lithium-ion battery using full-field hard X-ray spectroscopic imaging. Chem. Commun. 49, 6480–6482 (2013). [DOI] [PubMed] [Google Scholar]
- Li L. et al. Visualization of electrochemically driven solid-state phase transformations using operando hard X-ray spectro-imaging. Nat. Commun. 6, 6883 (2015). [DOI] [PMC free article] [PubMed] [Google Scholar]
- Weker J. N. & Toney M. F. Emerging in situ and Operando nanoscale X-ray imaging techniques for energy storage materials. Adv. Funct. Mater. 25, 1622–1637 (2015). [Google Scholar]
- Wang J., Chen-Wiegart Y. K. & Wang J. In operando tracking phase transformation evolution of lithium iron phosphate with hard X-ray microscopy. Nat. Commun. 5, 4570 (2014). [DOI] [PubMed] [Google Scholar]
- Chen-Wiegart Y. K. et al. 3D non-destructive morphological analysis of a solid oxide fuel cell anode using full-field X-ray nano-tomography. J. Power Sources 218, 348–351 (2012). [Google Scholar]
- Liu Y. et al. Five-dimensional visualization of phase transition in BiNiO3 under high pressure. Appl. Phys. Lett. 104, 043108 (2014). [DOI] [PMC free article] [PubMed] [Google Scholar]
- Padhi A. K., Nanjundaswamy K. S. & Goodenough J. B. Phospho-olivines as positive-electrode materials for rechargeable lithium batteries. J. Electrochem. Soc. 144, 1188–1194 (1997). [Google Scholar]
- Chueh W. C. et al. Intercalation pathway in many-particle LiFePO4 electrode revealed by nanoscale state-of-charge mapping. Nano Lett. 13, 866 (2013). [DOI] [PubMed] [Google Scholar]
- Gu L. Direct observation of lithium staging in partially delithiated LiFePO4 at atomic resolution. J. Am. Chem. Soc. 133, 4661 (2011). [DOI] [PubMed] [Google Scholar]
- Wang J. et al. Automated markerless full field hard x-ray microscopic tomography at sub-50 nm 3-dimension spatial resolution. Appl. Phys. Lett. 100, 143107 (2012). [Google Scholar]
- Liu H. et al. Capturing metastable structures during high-rate cycling of LiFePO4 nanoparticle electrodes. Science 344, 1252817 (2014). [DOI] [PubMed] [Google Scholar]
- Ulvestad A. et al. Topological defect dynamics in operando battery nanoparticles. Science 348, 1344–1347 (2015). [DOI] [PubMed] [Google Scholar]
- Shapiro D. A. et al. Chemical composition mapping with nanometre resolution by soft X-ray microscopy. Nat. Photon. 8, 765–769 (2014). [Google Scholar]
- Jiang H. et al. Three-dimensional coherent X-ray diffraction imaging of molten iron in mantle olivine at nanoscale resolution. Phys. Rev. Lett. 110, 205501 (2013). [DOI] [PubMed] [Google Scholar]
- Miao J., Sandberg R. L. & Song C. Coherent diffraction imaging with X-rays. IEEE J. Sel. Top. Quant. Electron. 18, 399–410 (2012). [Google Scholar]
- Dierolf M. et al. Ptychographic X-ray computed tomography at the nanoscale. Nature 467, 436–439 (2010). [DOI] [PubMed] [Google Scholar]
Associated Data
This section collects any data citations, data availability statements, or supplementary materials included in this article.
Supplementary Materials
Supplementary Figures 1-12
2D projections over 180 degree range showing irregular shape of LiFePO4 particle
3D chemical phase distribution showing core-shell morphology in partially delithiated LiFePO4 particle
Inner LiFePO4 core in partially delithiated LiFePO4 particle
Outer shell of FePO4 in partially delithiated LiFePO4 particle
Cut-away view of 3D chemical phase distribution in partially delithiated LiFePO4 particle
Data Availability Statement
The data that support the findings of this study are available from the corresponding author on request.


