

Abstract
Combining molecularly targeted agents and chemotherapeutics is an emerging strategy in cancer treatment. We engineered sub-50 nm diameter diblock copolymer nanoparticles (NPs) that can sequentially release wortmannin (Wtmn, a cell signaling inhibitor) and docetaxel (Dtxl, genotoxic anticancer agent) to cancer cells. These NPs were studied in chemoradiotherapy, an important cancer treatment paradigm, in the preclinical setting. We demonstrated that Wtmn enhanced the therapeutic efficacy of Dtxl and increased the efficiency of radiotherapy (XRT) in H460 lung cancer and PC3 prostate cells in culture. Importantly, we showed that NPs containing both Wtmn and Dtxl release the drugs in a desirable sequential fashion to maximize therapeutic efficacy in comparison to administering each drug alone. An in vivo toxicity study in a murine model validated that NPs containing both Dtxl and Wtmn do not have a high toxicity profile. Lastly, we demonstrated that Dtxl/Wtmn-coencapsulated NPs are more efficient than each single-drug-loaded NPs or a combination of both single-drug-loaded NPs in chemoradiotherapy using xenograft models. Histopathological studies and correlative studies support that the improved therapeutic efficacy is through changes in signaling pathways and increased tumor cell apoptosis. Our findings suggest that our nanoparticle system led to a dynamic rewiring of cellular apoptotic pathways and thus improve the therapeutic efficiency.
Keywords: cancer, dynamic rewiring of cell apoptotic pathways, combination chemotherapy, concurrent chemoradiotherapy, diblock copolymer NPs, dual drug encapsulation
Graphical abstract
Radiotherapy (XRT) is a key treatment modality in cancer management. It is estimated that 70% of cancer patients will receive XRT during their treatment.1 Its principle mechanism of function is through DNA double-strand damage, which preferentially eradicates tumor cells.2,3 The concurrent administration of chemotherapy and radiotherapy, also known as chemoradiotherapy (CRT), is a key treatment paradigm.4 It is part of the curative management of many difficult to treat cancers, including brain, head and neck (HNSCC), esophageal, gastric, pancreatic, small-cell and non-small-cell lung (NSCL), rectal, bladder, anal, vulvar, and cervical cancers.4–14 Because of its importance, there has been strong interest in the development of strategies and novel agents (radiosensitizers) to improve CRT. Radiosensitizers are agents that can increase the efficacy of XRT by sensitizing tumor cells to its effects.4,15 An emerging strategy in cancer research is the dynamic rewiring of cell signaling pathways to improve therapeutic efficacy of anticancer agents.16–18 Dynamic rewiring refers to the preadministration of cell signaling inhibitor sensitized cancer cells to the genotoxic anticancer agent due to down-regulation of cell signaling pathways related to the genotoxic effects of the latter administered anticancer agent. We hypothesized that this strategy can be applied to the CRT paradigm, and its application can significantly improve the therapeutic index of CRT.
In this proof-of-principle study, we chose docetaxel (Dtxl) and wortmannin (Wtmn) as model drugs. Dtxl is a well-established chemotherapeutic agent with efficacy against a wide range of cancers, such as NSCLC and HNSCC. Dtxl is also a known radiosensitizer and is utilized clinically in CRT regimens. In vivo studies demonstrated that Dtxl is an excellent radiosensitizer due to its ability to arrest the cell cycle in more radio-sensitive G2/M phases.19,20 A recent in vitro study found that Dtxl reduced the production of glutathione (GSH) and increased production of reactive oxygen species (ROS) in the nucleus during ionization radiation, hence increasing the efficiency of ROS-induced DNA damage despite the mechanism not being fully established.21 Wtmn is a steroid metabolite of the fungus Penicllium funiculosum and a potent inhibitor of phosphoinositide 3-kinases (PI3-Ks).22 It is known to inhibit DNA-dependent protein kinase (DNA-PK), Ku-70, Ku-80, and ataxia telangiectasia mutated (ATM) proteins,22–26 all of which are critically important to DNA double-strand repair.22 Hence, Wtmn holds high potential in increasing DNA damage-mediated apoptosis. A recent study suggested that Wtmn pretreatment (but not cotreatment/post-treatment) can also significantly enhance the in vitro toxicity of Dtxl by down-regulating the PI3k/Akt pathway.26 Our own group has also demonstrated that Wtmn is both a chemosensitizer27 and a radiosensitizer.28 Thus, Wtmn is an excellent agent for rewiring signaling pathways and improving CRT.27–29 We hypothesized that Wtmn can sensitize cancer cells to the effects of both Dtxl and radiation.
In this study, we engineered sub-50 nm diameter poly(ethylene glcol)-co-poly(lactic-co-glycolic acid) (PEG-PLGA)-based diblock copolymer NPs that can co-deliver Dtxl and Wtmn. Since the Dtxl to Wtmn ratio can affect drug-release kinetics as well as therapeutic efficacy, we engineered NPs with different Dtxl:Wtmn ratios and systematically characterized their physiochemical properties, drug release kinetics, and in vitro cytotoxicity. We then identified the optimal Dtxl:Wtmn ratio that provides the maximum therapeutic efficacy using H460, a NSCLC cell line, and PC3, a prostate cancer cell line. Our in vitro data were further validated using mouse xenograft models of cancer. Importantly, we compared the therapeutic efficacy of co-delivering Dtxl and Wtmn to each agent delivered separately. Lastly, we demonstrated that NP Dtxl and Wtmn improve the therapeutic efficiency by inhibiting blood vessels growth, increasing tumor cell apoptosis, and preventing DNA repair.
RESULTS AND DISCUSSION
Fabrication and Characterization of Single- and Dual-Drug-Loaded NPs
To engineer NP formulations of Dtxl and Wtmn, we chose to utilize the PEG–PLGA NP platform because of its clinical translation potential and the ability to modify drug release kinetics. Single and dual drug-loaded PEG–PLGA NPs with different target drug loading were prepared using nanoprecipitation method (see Figure 1a). A mixture of two different PLGA block lengths PEG–PLGA diblock copolymers were used as building blocks of the NPs because changing the PLGA block length effectively change the viscosity of the PLGA core (and thus the drug release kinetics).
Figure 1.
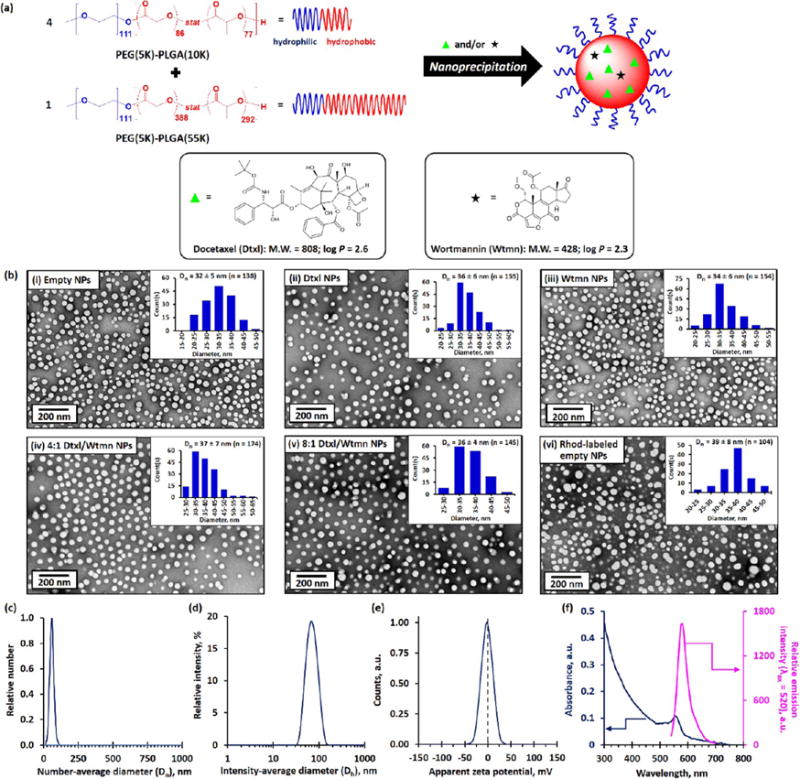
Synthesis and characterization of single- and dual-drug-loaded PEG–PLGA NPs. (a) Synthesis of single- and dual-drug-loaded PEG–PLGA NPs via nanoprecipitation of 4:1 mol/mol (1:1 wt/wt) of PEG(5K)–PLGA(10K) and PEG(5K)–PLGA-(55K) diblock copolymers in the presence of 5 wt/wt % of Dtxl and/or Wtmn in 1:0, 3:2, 3:1, or 0:1 molar ratios. The target drug loading was 5 wt/wt %. The insets show the chemical structures, molecular weights, and hydrophobicity constants (log P) of Dtxl and Wtmn. (b) Representative TEM images of (i) drug-free (“empty”) PEG–PLGA NPs, (ii) Dtxl NPs, (iii) Wtmn NPs, (iv) 4:1 mol/mol Dtxl/Wtmn coencapsulated NPs,† (v) 8:1 mol/mol Dtxl/Wtmn coencapsulated NPs,† and (vi) drug-free Rhod-labeled PEG–PLGA NPs prepared in the presence of 2.5 wt/wt % of Rhod-labeled PLGA(30K). The insets show the corresponding number-average distribution curve. (c) Number-average diameter (Dn) distribution curve recorded for the empty PEG–PLGA NPs (dispersed in 0.1 M PBS) determined by the NTA technique. (d) Intensity-average diameter (Dh) distribution curve recorded for the empty PEG–PLGA NPs determined by the DLS technique. (e) Zeta potential distribution curve recorded for the empty PEG–PLGA NPs dispersed in 0.1 M PBS, as determined by the aqueous electrophoresis method. (f) UV–visible absorption and fluorescence spectrum of 1 mg/mL of the drug-free Rhod-labeled PEG–PLGA NPs. (N.B. †Actual Dtxl and Wtmn molar ratio. The fluorescence spectrum was recorded at an excitation wavelength of 500 nm.)
The mean number-average diameters (Dn) of the single and dual drug-loaded NPs were found to be about 36 ± 6 nm (see Figure 1b). This is consistent with the mean intensity-average diameters (Dh, also known as hydrodynamic diameter) of about 65 nm (polydispersity index, PDI ≤ 0.1; see Table S1) determined by the dynamic light scattering method and the mean number-average diameter of approximately 57 nm determined by the NP tracking analysis (NTA) technique. The characterizations confirm the change of PLGA molecular weight did not significantly change the diameter of the drug-loaded PEG–PLGA NPs (see Figures S1a and b). These PEG–PLGA NPs have near-zero mean zeta potential (ζ; see Figure 1b and Table S1), confirming the nonionic hydrophilic PEG chain is located at the surface of the NPs, which shields the anionic charges from the hydrophobic PLGA core.30 The complementary characterizations confirm that the encapsulation of hydrophobic drug(s) in the amorphous PLGA core did not affect the size of the diblock polymer NPs.
The drug encapsulation efficiencies of the single- and dual-drug-loaded NPs were found to be about 24 ± 1% and 9 ± 1% for Dtxl and Wtmn (see Table S1), respectively, as determined by the quantitative HPLC method. Coencapsulation of Dtxl and Wtmn in the dual-drug-loaded NPs did not affect the encapsulation efficiency of the individual drugs. The lower encapsulation efficiencies recorded for Wtmn in both drug-encapsulated NPs can be explained by the fact that the lower molecular weight Wtmn diffused more rapidly out of the hydrophobic PLGA core than the larger Dtxl molecule during the nanoprecipitation and purification processes, despite having similar hydrophobicities (log P of Dtxl = 2.6; log P of Wtmn = 2.6).31 Therefore, the actual Dtxl/Wtmn molar ratios in the dual-drug-loaded NPs were approximately 4:1 and 8:1 for target Dtxl/Wtmn molar ratios of 3:2 and 3:1, respectively.
In Vitro Drug-Release Kinetics of Single- and Dual-Drug-Loaded PEG–PLGA NPs
The kinetics of Dtxl and Wtmn release from the NPs under sink physiological conditions (37 °C, in a large excess of 0.1 M PBS) were characterized. A time-dependent drug-release study indicated that both encapsulated drugs were released in highly controllable manners (see Figure 2) and fit the empirical Weibull drug-release model very well (see Table S2 and Materials and Methods for details).32 In general, coencapsulation did not significantly affect the kinetics of drug release of the individual drugs. The encapsulated Wtmn was released significantly faster than the encapsulated Dtxl. Approximately 75% of the Wtmn was released in the first 8 h, and all encapsulated Wtmn was completely released within 24 h (see Figure 2). On the other hand, less than 25% of the encapsulated Dtxl was released in the first 8 h (with about 2 h lag-release period (tlag), when an insignificant amount of Dtxl was released), and the release of Dtxl followed sigmoidal-type drug-release kinetics for up to 48 h (see Figure 2). We showed that our PEG–PLGA NPs can dynamically release encapsulated drugs according to their molecular weights. This controlled drug-delivery system allows low-molecular-weight Wtmn to be released prior to high-molecular-weight Dtxl and rewires/inhibits the cell DNA repair pathways to enhance cell death induced by genotoxic Dtxl and radiation. The fact that Wtmn has a more rapid release than Dtxl is favorable to this rewiring process. We were also able to demonstrate that despite having similar physical properties, NPs formulated with higher molecular weight PLGA had slower drug release owning to the more hydrophobic NP core (see Figure S1c).
Figure 2.
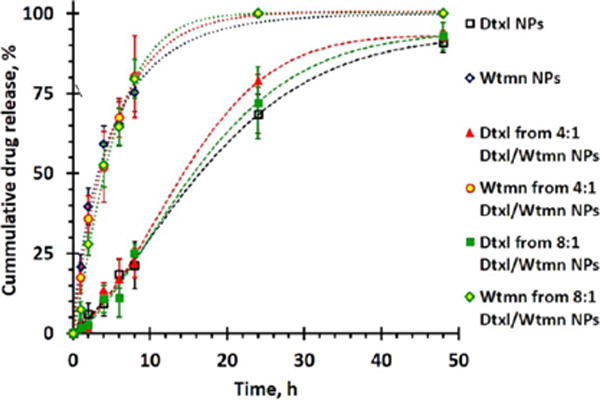
In vitro drug-release kinetics of Dtxl NPs, Wtmn NPs, 4:1 mol/mol of Dtxl/Wtmn NPs, and 8:1 mol/mol of Dtxl/Wtmn NPs under sink physiological conditions, as determined by the quantitative HPLC method.
In Vitro Toxicities and Chemosensitizing and Radiosensitizing Efficiencies of Free Drug(s) and Single- and Dual-Drug-Loaded NPs
In vitro cytotoxicity studies were performed in H460 lung cancer and PC3 prostate cancer cell lines. Figure 3 and Table S3 show the half-maximal inhibitory concentration (IC50) of different molar ratios of small-molecule (“free”) and encapsulated Dtxl and/or Wtmn in H460 and PC3 cell lines, as determined by the 23-(4,5-dimethylthiazol-2-yl)-5-(3-carboxymethoxyphenyl)-2-(4-sulfophenyl)-2H-tetrazolium (MTS) cell proliferation assay at 72 h after 2 h of in vitro drug treatments (see Materials and Methods for details). Small-molecule Dtxl is an efficient chemotherapeutic drug with an IC50 of 280 and 740 nM in the H460 and PC3 cell lines, respectively. Wtmn is a well-established PI3K cell signaling inhibitor with moderate in vitro toxicity (IC50 > 10 mM) in both cell lines.22,28 In vitro cotreatments with 4:1 and 8:1 mol/mol of small-molecule Dtxl and Wtmn did not significantly increase the toxicity compared with free Dtxl in both cell lines (IC50 = 310 μM in H460 cell line, p = 0.54 versus control group; IC50 = 10.1 mM in PC3 cell line, p = 0.02 versus control group). However, small-molecule Wtmn pretreatment (administrated 2 h before Dtxl) significantly increased the toxicity (IC50 = 40 and 190 nM for 4:1 and 8:1 mol/mol of Dtxl/Wtmn cotreatments in the H460 cell line; IC50 = 90 and 190 nM for 4:1 and 8:1 mol/mol of Dtxl/Wtmn cotreatments in the PC3 cell line), especially when combining 4:1 small-molecule Dtxl/Wtmn, compared with in vitro cotreatment at the same time. A control study indicated small-molecule Dtxl pretreatment did not significantly increase the toxicity compared with small-molecule Dtxl and Dtxl/Wtmn cotreatments (p = 0.10 and 0.15 versus the cotreatment group in the H460 and PC3 cell lines, respectively). The time-dependent in vitro studies indicated that Wtmn pretreatment, but not cotreatment or post-treatment, sensitized Dtxl and increased the overall drug toxicity, which was consistent with the mechanism of rewiring cell apoptotic pathways purposed by Zhang et al.26
Figure 3.
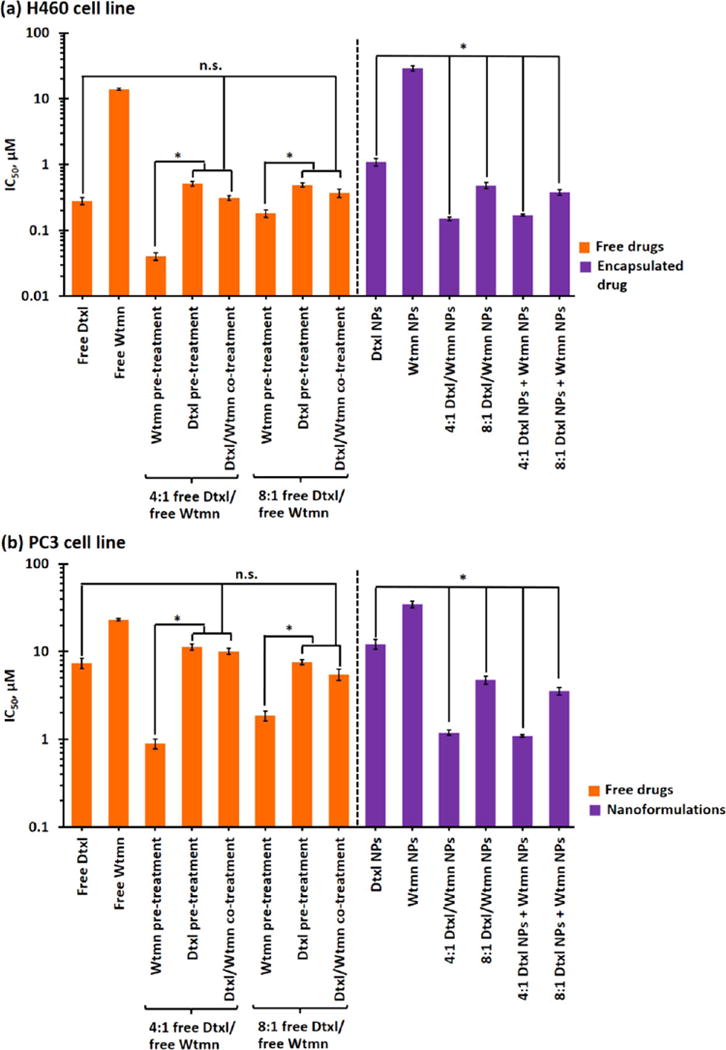
In vitro drug toxicity of small-molecule and encapsulated drugs. IC50 of small-molecule (“free”) drugs and single/dual-drug-encapsulated PEG–PLGA NPs in (a) H460 lung cancer and (b) PC3 prostate cancer cell lines, as determined by the MTS assay. (N.B. n.s. denotes statistical nonsignificance; * denotes p < 0.05, i.e., statistical significance.)
Cancer cells rapidly take up hydrophobic drugs via active diffusion.33,34 The uptake of drug-encapsulated NPs often occurs through a slower endocytosis pathway, which is affected by the physicochemical properties of the NPs.33,34 Similar to previous studies, high concentrations of drug-free PEG–PLGA NPs (up to 5 mg/mL) showed insignificant in vitro toxicities in both H460 and PC3 cell lines (cell viabilities above 90% in both cell lines; see Figure S2).35–37 In general, the toxicity of encapsulated drug(s) followed the toxicity trends of small-molecule drugs, but the toxicities of all nanoformulations were lower than their small-molecule counterparts (IC50 of encapsulated drugs was about 60–80% lower than that of small-molecule drug(s); see Figure 3) because of the slower uptake. The toxicities of both 4:1 and 8:1 Dtxl/Wtmn coencapsulated NPs were similar to those of the 4:1 and 8:1 combinations of Dtxl NPs and Wtmn NPs (p < 0.05 in both cases). Similar to the small-molecule in vitro toxicity studies, the 4:1 Dtxl/Wtmn nanoformulation showed the highest toxicities in both cell lines because the tailor-made PEG–PLGA NPs release the encapsulated Wtmn before Dtxl. This confirms that the tailor-made PEG–PLGA NPs allowed in vitro combination therapy to be performed at once rather than in two separate in vitro drug applications. Thus, the remaining parts of this article focus on small molecules and nanoformulation based on the 4:1 Dtxl/Wtmn molar ratio.
The efficacy of small-molecule and (co)encapsulated Dtxl and Wtmn in CRT was studied in the H460 and PC3 cell lines via cologenic survival assays.38 Figure 4 shows the radiation dose-dependent cologenic survival curves recorded for the H460 and PC3 cell lines after they were treated with therapeutic doses (i.e., IC50; see Table S3) of small-molecule or encapsulated drug(s) before irradiation. Small-molecule Dtxl and Wtmn sensitized both cell lines to ionizing radiation. The dose-enhancement factors (EF) to achieve a survival fraction of 0.1 of Dtxl and Wtmn treatments were calculated to be 1.22 (for Dtxl in the H460 cell line; see Figure 4a (i)), 1.50 (for Wtmn in the H460 cell line; see Figure 4a (i)), 1.27 (for Dtxl in the PC3 cell lines; see Figure 4b (i)), and 1.52 (for Wtmn in the PC3 cell line; see Figure 4a (i)) for H460 and PC3 cells (see Table S4), respectively. Thus, these drug treatments increased the efficiencies of radiotherapy by 22%, 50%, 27%, and 52%, respectively. In addition, both drug treatments reduced the quasi-threshold dose (Do, the minimum dose required to kill cancer cells) from above 3.4 Gy (in both cell lines) to 1.6–2.5 Gy (see Table S4). This reduces the chances for cancer cells to develop radioresistance at low doses of ionization radiation treatment. The radiosensitizing effects of both encapsulated drugs are very similar (p < 0.05 in all cases) to those of their small-molecule counterparts (see Figure 4a (i) and b (i)), suggesting that encapsulation of chemotherapy agents into the tailor-made PEG–PLGA NPs would not affect their radiosensitizing efficiency.
Figure 4.
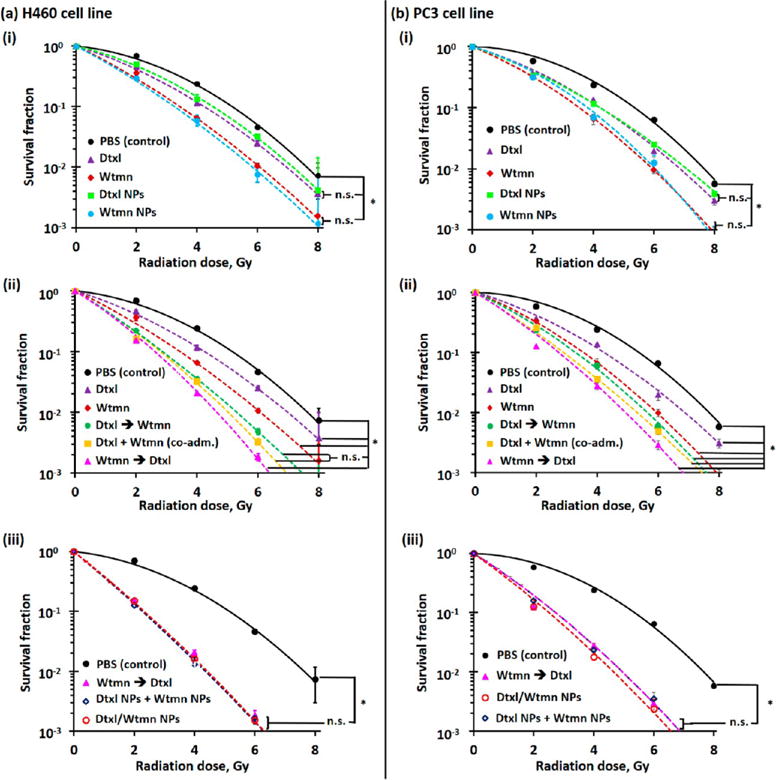
In vitro radiosensitizing efficiencies of small-molecule and encapsulated drugs. Radiation dose-dependent clonogenic survival curves recorded for (a) H460 lung cancer and (b) PC3 prostate cancer cells after being treated with therapeutic dose (i.e., IC50; see Table S3) of (i) small-molecule (“free”)/encapsulated Wtmn or Dtxl, (ii) small-molecule Dtxl and Wtmn in different administration orders, and (iii) encapsulated Dtxl and Wtmn (either dual-drug-loaded NPs or a combination of two single-drug-loaded NPs. (N.B. n.s. denotes statistical nonsignificance; * denotes p < 0.05, i.e., statistical significance.)
The combination of Wtmn and Dtxl further enhances the radiosensitivity of both cell lines (see Figure 4a (ii) and b (ii)). Small-molecule Wtmn and Dtxl cotreatment and Dtxl pretreatment slightly increased the dose enhancement factors to 1.7–1.8 (increased the efficiencies of radiotherapy by 70–80%) versus 1.3–1.5 determined in single-drug treatments (see Table S4). The enhanced effects observed in both combination treatment groups were approximately the sum of the enhancement effects contributed by Dtxl (increased efficiency of radiotherapy by about 25%) and Wtmn (increased efficiency of radiotherapy by about 50%). However, small-molecule Wtmn pretreatment significantly enhanced the radiotherapy efficiency by 120% (EF = 2.2) and 100% (EF = 2.0) for the H460 and PC3 cell lines (see Table S4), respectively. In addition, the quasi-threshold dose of Wtmn pretreatment significantly decreased to 1.2 and 1.7 Gy for the H460 and PC3 cell lines (see Table S4), respectively.
The radiosensitizing effects of combining 4:1 Dtxl NPs and Wtmn NPs or using 4:1 Dtxl/Wtmn coencapsulated NPs are similar to those of Wtmn-pretreatment combination therapy (see Figure 4a (iii) and b (iii)). Both nanoformulations increase the enhancement factor to achieve a survival fraction of 0.1 to about 2.3 (increased the efficiency of radiotherapy by 130%) in the H460 cell line and about 2.1 (increased the efficiency of radiotherapy by 110%) in the PC3 cell line (see Table S4) because slower drug release can improve the therapeutic efficiencies of both drugs. The clear advantage of using coencapsulated nanoformulations is that the encapsulated drugs can be administrated to the cancer cells at once (since the tailor-made PEG–PLGA NPs release Wtmn before Dtxl in a highly controllable manner), whereas small-molecule-based combination therapy requires separate administrations in order to achieve a combined therapeutic effect.
In Vitro and in Vivo Tumor Uptake of Rhodamine B-Labeled PEG–PLGA NPs
Drug-free Rhod-labeled PEG–PLGA NPs were prepared to get better insights into the cellular and tumor uptakes of the tailor-made sub-50 nm diameter PEG–PLGA NPs. Figure S3a and b show the concentration- and time-dependent cellular uptake of the Rhod-labeled PEG–PLGA NPs in the H460 and PC3 cell lines, respectively. It was found that the NP uptake increases with the incubation time in both cell lines. Both cell lines (plating cell density = 104 cells per well) took up about 5% of the labeled NPs (incubation concentration = 50 μg/mL ≈ 4.7 × 10⁹ particles per well) after incubation for 2 h (see Figure S3a). Plateau NP uptake can be observed after incubation for 48 h, as the H460 and PC3 cells took up approximately 47% and 38% of the incubated NPs, respectively. The differences in the NP uptake can be explained by the different growth rates of the two cell lines (the cell densities of H460 and PC3 increased to 1.43 × 10⁴ and 1.15 × 10⁴ cells per well after plating at physiological conditions for 24 h, respectively, as determined by a cell counter). A concentration-dependent study indicated that NP uptake increased with the NP concentration. Plateau NP uptake can be observed when the concentration increases to about 450 μg/mL (equivalent to 4.2 × 10¹⁰ particles per well). The quantitative cellular uptake study indicated that both cell lines only took up about 10% of the incubated NPs (thus about 10% of the encapsulated drug(s) in the in vitro toxicity studies) during the 2 h in vitro treatment period. This indicates that nanoformulations have higher in vitro therapeutic efficiency than free drugs.
A full-body in vivo fluorescence imaging study was performed to investigate the tumor uptake of the sub-50 nm diameter PEG–PLGA NPs in H460 and PC3 tumor xenograft athymic nude (Nu) mice. Time-dependent fluorescence images were taken preinjection, 5 min, and 3, 6, 9, 24, and 48 h after tail vein intravenous (iv) injection of 165 mg/kg of drug-free Rhod-labeled PEG–PLGA NPs. As shown in Figure 5a, systemic distribution of the fluorescent NPs can be observed 3 h after intravenous administration, indicating the NPs were not rapidly cleared by the mononuclear phagocyte system (MPS, also known as the reticuloendothelial system, including the liver, kidney, lymph nodes, and spleen).39,40 As time elapsed, the fluorescence intensity (photon flux) recorded at the tumor site increased (see Figure 5a and 5b), suggesting the Rhod-labeled NPs progressively accumulated in the tumor due to the EPR effect.39,41 The photon flux recorded at the tumor site remained relatively high at 48 h postinjection (8 times higher than that recorded at 5 min postinjection). A further ex vivo imaging study was performed at 48 h postinjection to investigate the biodistribution of the Rhod-labeled PEG–PLGA in the tumor and other key organs (liver, kidney, spleen, heart, and lung). As shown in Figure 5c and Figures S4, S5, and S6, approximately 35% and 30% of the total measured signals (photon flux) from the administrated NPs were retained in the H460 and PC3 tumors, respectively. The majority of the administrated NPs were accumulated in the liver (about 55% of the total measured signals in the tumor-bearing mice and about 85% of the total measured signals in the tumor-free mice). Less than 10% of the total measured signals from the administrated NPs were accumulated in the kidney, spleen, heart, and lung. The excellent tumor uptake of the tailor-made PEG–PLGA NPs was confirmed by confocal fluorescence images of H460 and PC3 tumors collected 48 h after iv administration, where the Rhod-labeled NPs can be easily identified from both tumor sections (see Figure 5d). Similar to previous studies, certain regions of the tumor showed lower NP uptake than the other regions.42
Figure 5.
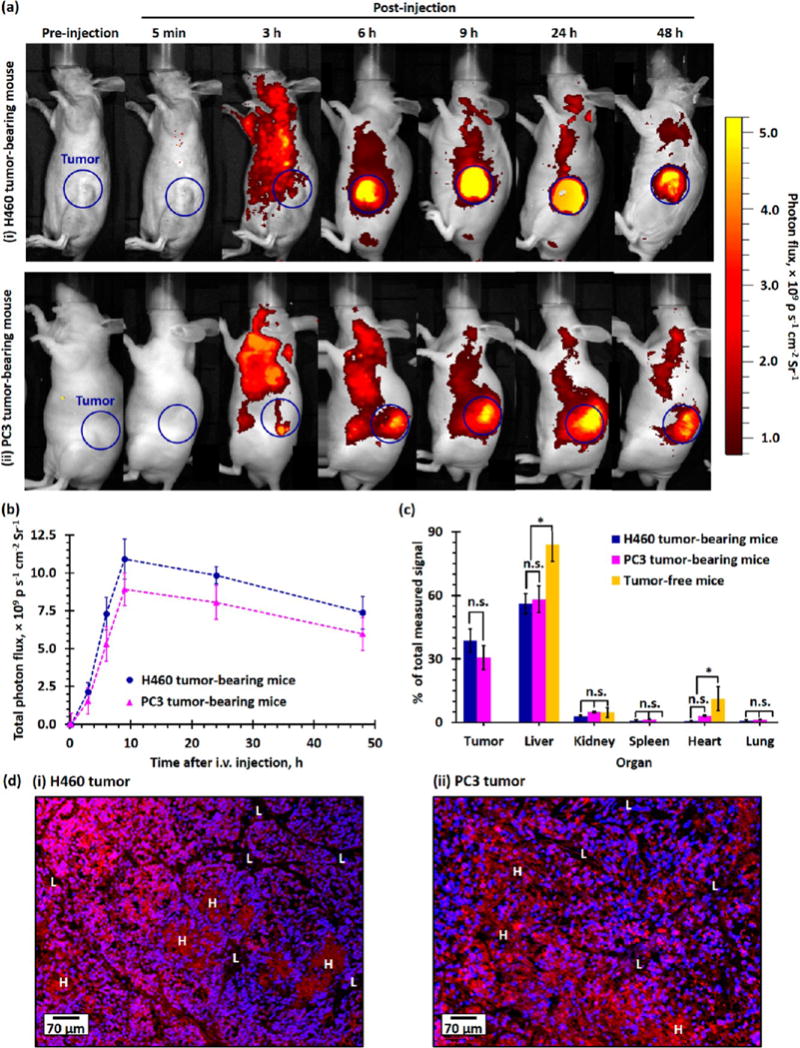
In vivo tumor uptake and biodistribution of PEG–PLGA NPs in healthy tumor-free and H460 and PC3 xenograft tumor-bearing mice. (a) Representative time-dependent in vivo fluorescence images of (i) H460 and (ii) PC3 xenograft tumor-bearing Nu mice recorded preinjection and 5 min to 48 h after tail vein injection of 165 mg/kg of Rhod-labeled PEG–PLGA NPs. The blue circles highlighted the xenograft tumors inoculated in the left flank of the Nu mice. The photon flux measured at an excitation wavelength of 570 nm and an emission wavelength of 600 nm is directly proportional to the concentration of Rhod-labeled PEG–PLGA NPs in tissue. (b) Time-dependent photon flux recorded at the tumor site of H460 and PC3 tumor-bearing mice after iv administration of Rhod-labeled PEG–PLGA NPs. (c) Plot of total photon flux recorded at the tumor site as a function of time in the H460 and PC3 xenograft tumor-bearing mice. The total photon flux is directly proportional to the amount of PEG–PLGA NPs the tumor takes up (n = 3 per group). (d) Biodistribution of Rhod-labeled PEG–PLGA NPs in tumor and mononuclear phagocyte system (liver, kidney, spleen, heart, and lung) of xenograft tumor-bearing and healthy Nu mice recorded 48 h postadministration, as determined by a quantitative ex vivo fluorescence imaging method. (d) Representative wide-field fluorescence images of (i) H460 and (ii) PC3 xenograft tumor sections collected 48 h postinjection of Rhod-labeled PEG–PLGA NPs. The nuclei were stained with DAPI (blue). Uneven uptake of the Rhod-labeled NPs (red) can be observed in both wide-field fluorescent images, where some regions have saturated Rhod-fluorescence signals (labeled as “H”) due to accumulation of a larger amount of Rhod-labeled NPs, and some regions have lower NP uptake (labeled as “L”).
Systemic Toxicity of Small-Molecule and PEG–PLGA NP (Co)Encapsulated Drug(s)
Hepatotoxicity and hematologic toxicity are two major side effects of traditional chemotherapy that often lead to early termination of chemotherapy.27,29,43 Figure 6a and b summarize the hepatotoxicity and hematologic toxicity profiles recorded for healthy tumor-free CD1 mice 4 days after iv administration of 167 mg/kg of empty PEG–PLGA NPs, 1.91 mg/kg of small-molecule/(co)encapsulated Dtxl, and/or 0.25 mg/kg of small-molecule/(co)encapsulated Wtmn (1/10th of the maximum tolerated dose (MTD) of the individual drug).28,29 The administration of small-molecule Dtxl or Wtmn significantly increased the plasma aspartate aminotransferase (AST) and alanine aminotransferase (ALT) levels (both reflect liver function), despite both parameters being within the upper limit of documented normal ranges for healthy CD1 mice.44 Encapsulation of Dtxl and Wtmn into the tailor-made PEG–PLGA NPs was more efficient to maintain the AST and ALT levels at the normal ranges compared with their small-molecule analogues. The combination of two small-molecule drugs not only increased the therapeutic effects but also increased the hepatotoxicity. Conversely, the coadministration of encapsulated Dtxl and Wtmn did not significantly affect the AST and ALT levels compared with the control group. The reduction of hepatotoxicity in the nanoformulations can be explained by the fact that the slower drug release allows the liver to slowly break down these cytotoxic drugs. It is also worth noting that the hepatic functions in control mice administered drug-free PEG–PLGA NPs are no different than mice injected with PBS despite the fact that the majority of the administrated NPs accumulated in the liver.
Figure 6.
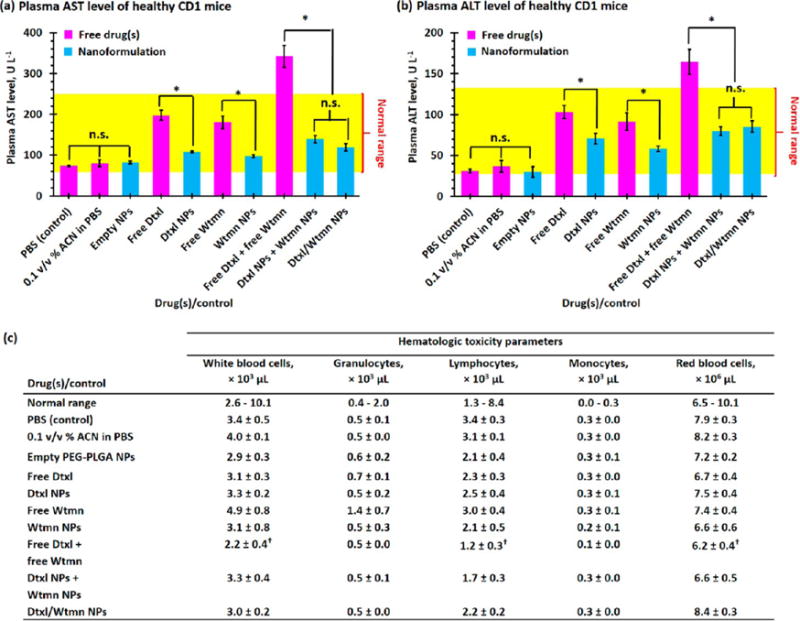
Hepatotoxicity and hematologic toxicity of small-molecule and encapsulated drugs. Plasma (a) aspartate transaminase (AST) and (b) alanine transaminase (ALT) levels recorded for healthy tumor-free CD1 mice 4 days after iv administration of PBS (control), 0.1 v/v % acetonitrile (ACN) in PBS (ACN was used to dissolve hydrophobic small-molecule drug(s) before being diluted with PBS for iv injection, control), 165 mg/kg of drug-free “empty” PEG–PLGA NPs, 1.91 mg/kg of free/(co)encapsulated Dtxl, and/or 0.25 mg/kg of free/(co)encapsulated Wtmn (1/10th of the maximum tolerated dose of individual drug). The yellow region highlights the normal ranges of plasma AST and ALT levels.44 (c) Hematogical toxicity parameters of drug-free (“empty”) PEG–PLGA NPs and small-molecule and (co)encapsulated Dtxl and Wtmn at one-tenth the MTD of the individual drug. (N.B. n.s. denotes statistical nonsignificance; * denotes p < 0.05, i.e., statistical significance; † denotes below or above the normal range).
The administrations of small-molecule/encapsulated Dtxl and Wtmn showed very similar hematological toxicity profiles (see Figure 6c). Single drug treatment at 1/10th the MTD of the free drug did not significantly affect the white blood cell (WBC, including granulocytes and lymphocytes) and red blood cell (RBC) counts. However, the coadministration of small-molecule Dtxl and Wtmn significantly lowered the WBC and RBC counts to below the normal ranges, which increased the risks of anemia and infection. On the other hand, the administration of Dtxl and Wtmn coencapsulated NPs did not show any significant hematological toxic effects because the slow drug release allowed the hematologic system (include blood, spleen, bone marrow, and liver) to slowly clear the cytotoxic drugs from the body.29 Therefore, the remaining part of this article focuses on the use of different single- and dual-drug nanoformulations for chemotherapy and concurrent chemoradiotherapy.
Tumor Growth Inhibition and Radiosensitizing Efficiencies of Dtxl and Wtmn (Co)Encapsulated NPs in Fast-Growing H460 Lung Xenograft Tumor
In vivo combination chemotherapy and CRT studies were performed using a mouse H460 xenograft model. Mice were given a single subtherapeutic dose of chemotherapy (followed by two low-dose grade radiotherapies in the CRT groups) to enable precise quantification of the therapeutic effects of each treatment without eradication of tumor in all experimental arms (see Scheme S1).19,20 In the chemotherapy groups, the administration of drug-free PEG–PLGA NPs, Wtmn NPs, and Dtxl NPs did not significantly delay the tumor growth (p ≈ 0.12–0.31 versus the control group) compared with the control group administrated with PBS (see Figure 7). Co-administration of Dtxl NPs and Wtmn NPs slightly delayed the tumor growth (p = 0.04 versus the control group) with an absolute group delay (AGD) for the tumor to grow to 40 times its initial volume of 2.4 days compared with the control group (see Figure 7 and Table S5). The administration of Dtxl/Wtmn coencapsulated NPs further delayed tumor growth (p = 0.03 compared with the separate administration group) and increased the AGD to 4.8 days (see Figure 7 and Table S5). The administration of a combination of Dtxl NPs and Wtmn NPs separately has lower therapeutic efficiency than that of dual-drug-loaded NPs due to uneven NP uptake, as observed in the ex vivo histological study. Interestingly, we did not observe better efficacy for the codelivery of both agents in our in vitro studies. The difference between our in vitro and in vivo studies is likely due to in vivo biodistribution. While cells under in vitro conditions have equal access to both NP therapeutics (given separately), they do not have such equal access under in vivo conditions owing to the biodistribution differences of the NPs. Therefore, only co-delivery enables the appropriate drug ratio under in vivo conditions, which led to the increase in efficacy.
Figure 7.
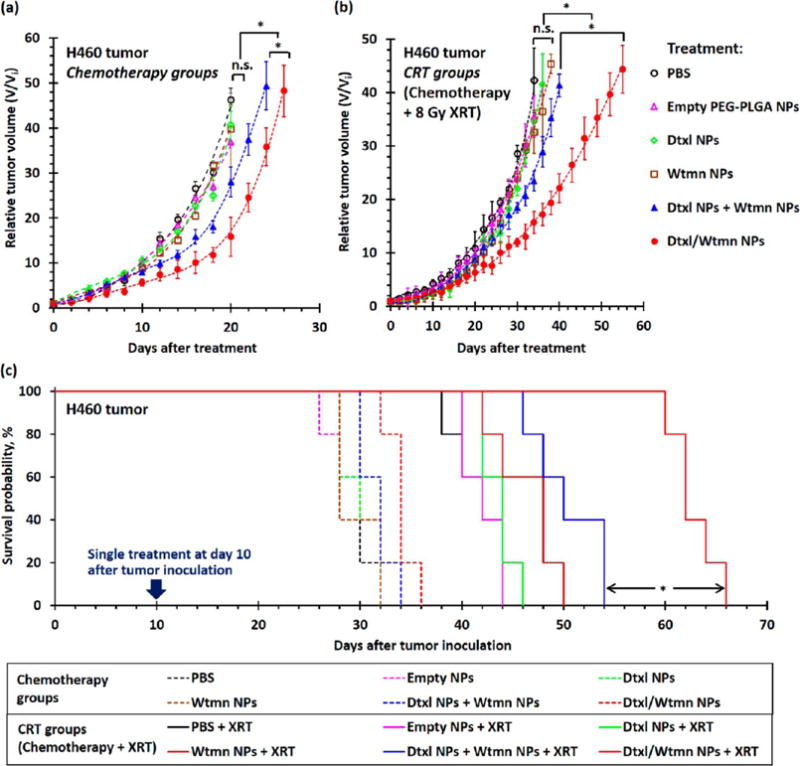
In vivo treatment efficiencies of different nanoformulations for combination chemotherapy and concurrent CRT in H460 xenograft tumor-bearing mice. (a and b) Tumor growth delay curves recorded for H460 tumor-bearing mice (n = 5–6 per group) after a single course of (a) chemotherapy and (b) concurrent chemotherapy treatment with 200 μL of PBS (control group), 33 mg/kg of drug-free empty PEG–PLGA NPs, 0.38 mg/kg of encapsulated Dtxl, 0.05 mg/kg of encapsulated Wtmn, or 0.05 mg/kg of encapsulated Wtmn and 0.38 mg/kg of encapsulated Dtxl (either dual-drug-loaded NPs or a combination of two single-drug-loaded NPs). Mice in the CRT groups received 8 Gy of fractionated radiotherapy (XRT) at 4 and 15 h (4 Gy radiation in each treatment) after iv administration of different chemotherapy agents. All treatments were performed 10 days after tumor inoculation, and the average initial tumor volume (Vi) before treatment was 67 ± 4 mm3. (c) Kaplan–Meier survival analysis for xenograft tumors to reach 40 times their initial volume (volume, V ≈ 2600 mm3). (N.B. n.s. denotes statistical nonsignificance; * denotes p < 0.05, i.e., statistical significance.)
Concurrent radiotherapy is more efficient in delaying the growth of H460 xenograft tumors than combination chemotherapy. Treatment with 8 Gy of fractionated radiotherapy significantly delayed tumor growth compared with the control group (p = 0.01) and increased the AGD to 12.4 days (see Figure 7 and Table S5). Similar to the chemotherapy treatment groups, CRT with drug-free PEG–PLGA NPs, Dtxl NPs, or Wtmn NPs slightly delayed the tumor growth compared with the treatment group that only received 8 Gy radiotherapy (p = 0.08–0.31 versus the radiotherapy-only treatment group). The dose-dependent radiotherapy enhancement factors of the Dtxl NPs and Wtmn NPs were calculated to be 1.12 (i.e., increased efficiency of radiotherapy by 12%) and 1.34 (increased efficiency of radiotherapy by 34%), respectively, indicating both single-drug-encapsulated NPs moderately enhanced the efficiency of radiotherapy in vivo (see Table S5). The coadministration of Dtxl NPs and Wtmn NPs for CRT significantly delayed the tumor growth for about 4 days (p = 0.04 versus the chemoradiotherapy treatment groups administrated with Dtxl NPs or Wtmn NPs; see Figure 7 and Table S5). The dose-dependent enhancement factor for radiotherapy was calculated to be 1.52 (increased efficiency of radiotherapy by 52%), which is approximately equal to the enhancements contributed by encapsulated Dtxl (about 12%) and Wtmn (about 34%). The administration of Dtxl/Wtmn-coencapsulated NPs for chemoradiotherapy further delayed the tumor growth (p < 0.01 compared with the chemoradiotherapy treatment group administrated with Dtxl NPs and Wtmn NPs), with absolute growth delay increased to 33.2 days: 28 days longer than the treatment group receiving only radiotherapy and about 10 days longer than the chemoradiotherapy treatment group coadministrated with Dtxl NPs and Wtmn NPs. The dose-dependent enhancement factor was calculated to be 2.29 (the efficiency of radiotherapy increased by 129%). This confirms our hypothesis that coencapsulation of two drugs in the same package allows more precise drug dosing and hence enhances the efficiency of radiotherapy by rewiring cell apoptosis pathways.
Tumor Growth Inhibition and Radiosensitizing Efficiencies of Dtxl and Wtmn (Co)Encapsulated NPs in Slow-Growing PC3 Prostate Xenograft Tumor
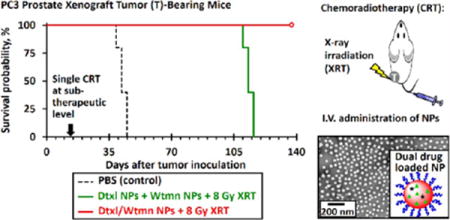
In vivo combination chemotherapy and CRT study were also performed in PC3 xenograft tumor-bearing Nu mice to investigate the therapeutic efficiency of different nanoformulations. PC3 tumor-bearing mice received an identical set of the drug treatments (see Scheme S1) that were used in the H460 in vivo study 14 days after tumor inoculation (initial tumor volume, Vi = 54 ± 4 mm3). The concurrent chemoradiotherapy treatment groups received 8 Gy of fractionated radiotherapy 4 and 15 h after chemotherapy (4 Gy of radiation per treatment). Similar to the H460 study, drug-free PEG–PLGA NPs did not delay tumor growth (p = 0.46 versus with the control group). In general, the PC3 xenograft tumors responded better to different nanoformulations than the fast-growing H460 lung tumors. The administrations of Dtxl NPs or Wtmn NPs slightly delayed the tumor growth for an average of 6.9 and 5.1 days (p ≈ 0.04 versus control nontreatment group; see Figure 8), respectively. The coadministration of Dtxl NPs and Wtmn NPs delayed tumor growth for an average of 16 days (p = 0.03 versus the control group; see Figure 8 and Table S6). The administration of Dtxl/Wtmn-coencapsulated NPs significantly delayed the tumor growth for an average of 26 days (p = 0.04 versus the coadministration group, p < 0.01 versus the control nontreatment group; see Figure 8 and Table S6) due to dynamic rewiring of apoptotic signaling pathways by Wtmn and reduction of uneven drug dosage within the tumors.
Figure 8.
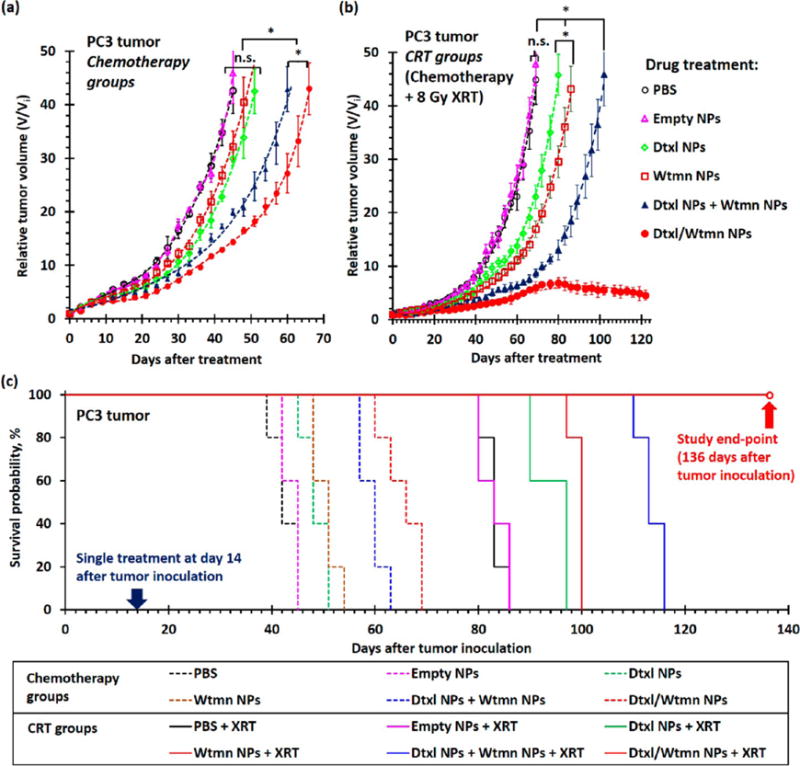
In vivo treatment efficiencies of different nanoformulations for combination chemotherapy and concurrent chemoradiotherapy in PC3 xenograft tumor-bearing mice. (a and b) Tumor growth delay curves recorded for PC3 tumor-bearing mice (n = 5 per group) after a single course of (a) chemotherapy and (b) concurrent chemotherapy treatment with PBS (control group), 33 mg/kg of drug-free empty PEG–PLGA NPs, 0.38 mg/kg of encapsulated Dtxl, 0.05 mg/kg of encapsulated Wtmn, or 0.05 mg/kg of encapsulated Wtmn and 0.38 mg/kg of encapsulated Dtxl (either dual-drug-loaded NPs or a combination of two single-drug-loaded NPs). Mice in the concurrent chemoradiotherapy (CRT) groups received 8 Gy of fractionated radiotherapy (XRT) at 4 and 15 h (4 Gy of radiation in each treatment) after iv administration of different chemotherapy agents. All treatments were performed 14 days after tumor inoculation, and the average initial tumor volume (Vi) before treatment was 54 ± 4 mm3. (c) Kaplan–Meier survival analysis for xenograft tumors to reach 40 times their initial volume (volume, V ≈ 2600 mm3). (N.B. n.s. denotes statistical nonsignificance; * denotes p < 0.05, i.e., statistical significance.)
In general, CRT treatment further delayed the growth of PC3 xenograft tumors. The administration of Dtxl NPs or Wtmn NPs followed by 8 Gy of fractionated radiotherapy delayed tumor growth for an average of 37 days (p ≈ 0.04 versus the treatment group that received only radiotherapy; see Figure 8 and Table S6), which is significantly longer than the AGD of 26 days recorded for the treatment group that received only radiotherapy. It was calculated that Dtxl NPs and Wtmn NPs increased the efficiencies of radiotherapy by 14% and 40% (EF = 1.14 and 1.40; see Table S6), respectively. The combination of Dtxl NPs and Wtmn NPs and fractionated radiotherapy significantly delayed the growth of PC3 tumors (p = 0.02 versus the CRT treatment group administrated with Dtxl NPs or Wtmn NPs) for an average of 56 days compared with the nontreatment control group (see Figure 8 and Table S6). The radiosensitizing enhancement factor was calculated to be 1.52 (efficiency of radiotherapy increased by 52%), which was approximately equivalent to the enhancement effects resulting from Dtxl NPs (14%) and Wtmn NPs (40%). The therapeutic effect from dynamic rewiring of apoptotic signaling pathways from encapsulated Wtmn is insignificant in this case. Perhaps the most surprising result was that CRT treatment with Dtxl/Wtmn-coencapsulated NPs completely inhibited the growth of PC3 tumors (see Figure 8). A 8 Gy dose of radiation (divided into two doses of 4Gy) is a relatively low dose, and we have not seen complete tumor control with CRT at this dose. Moreover, our administered drug dose is also a very low dose compared to the MTD of Wtmn and Dtxl. The use of Dtxl/Wtmn-coencapsulated NPs increased the efficiency of radiotherapy by more than 130% (EF > 2.30; see Tabel S5). The significant tumor growth delay observed in this combination CRT group further confirms our hypothesis that coencapsulation of two drugs in the same package is essential to ensure correct drug dosing for rewiring of cell apoptosis pathways and, hence, to enhance the efficiency of radiotherapy.
Three-dimensional ultrasound tomography was employed to investigate the cancer progression in both CRT treatment groups after they received combination chemotherapy. Figure S7a shows 3D ultrasound tomography images recorded for mice in both chemoradiotherapy treatment groups at 96 days after the initial treatment (110 days after tumor inoculation). The ultrasound images indicate the tumors were invading the nearby tissues after receiving chemoradiotherapy with Dtxl NPs and Wtmn NPs, as justified by the ill-defined tumor boundary. Quantitative image analyses (see Figure S7b) indicate that these tumors are mainly made up of closely packed high-ultrasound-scattering live cancer cells. Conversely, the xenograft tumors treated with Dtxl/Wtmn-coencapsulated NPs followed by radiotherapy remained relatively small and had very clear tumor boundaries. Quantitative ultrasound image analyses (see Figure S7b) indicate these tumors were mainly made up of low-backscattering dead cells or fluid, which is consistent with the corresponding hematoxylin and eosin (H&E)-stained tumor sections collected at the end-point of the in vivo study (122 days after treatment), where most of the cells in the tumors did not have a nucleus (see Figure S7c).
Histopathological Insight into Encapsulated-Wtmn-Assisted Dynamic Rewiring of Cell Apoptosis Pathways for Combination Chemotherapy and Concurrent Chemoradiotherapy
Comprehensive histopathological studies were performed to get better insight into the tumor growth inhibition mechanism in different chemotherapy and concurrent chemoradiotherapy treatments. Representative H460 and PC3 xenograft tumors (3 per group) were removed 4 days after initial treatment to investigate the underlying therapeutic effects of different treatments.
Antiangiogenesis (inhibition of blood vessel growth) plays an important role in delaying tumor growth. Immunohistochemistry stain for CD-31, an angiogenesis biomarker (see Figure 9), was performed on representative xenograft tumor sections to label vascular endothelial cells for the quantification of blood vessels.45 The average blood vessel count in the Wtmn NPs treatment group (in both H460 and PC3 xenograft tumors) was similar to that of the nontreatment control group (p = 0.45), whereas treatment with Dtxl NPs, a combination of Dtxl NPs and Wtmn NPs, or Dtxl/Wtmn NPs significantly reduced the number of blood vessels by up to 80% (p < 0.05). The number of blood vessels was reduced in the Dtxl-treated group because Dtxl efficiently stabilized the microtubules and inhibited microtubule depolymerization of vascular endothelial cells.46 In fact, a previous study found that endothelial cells in tumors are 100 times more sensitive to Dtxl treatment (second-generation taxane) than paclitaxel treatment (first-generation taxane), and hence Dtxl more efficiently inhibits blood vessel growth.46 Radiotherapy was also very efficient at inhibiting blood vessel growth by about 60% (compared with the nontreatment control group, p < 0.01) because ionization radiation induced apoptosis (programmed cell death) of endothelial cells of blood vessels.47 However, the administration of Wtmn NPs for chemoradiotherapy did not significantly inhibit blood vessel growth (p = 0.53 versus the treatment group receiving only radiotherapy). The administration of Dtxl NPs, a combination of Dtxl NPs and Wtmn NPs, or Dtxl/Wtmn-coencapsulated NPs for CRT almost completely inhibited blood vessel growth due to the synthetic effect between radiotherapy and encapsulated Dtxl. The antiangiogenic effect of encapsulated Dtxl and radiotherapy was further confirmed by H&E histological study (see Figure S8) and Masson’s trichrome immunohistochemistry study, in which less porous collagen fibers, fibrin, and erythrocytes that inhibit drug uptake during chemotherapy are stained in blue (see Figure S9).46 The use of an antiangiogenic drug (e.g., Dtxl) and radiotherapy to control tumor angiogenesis and normalization of tumor local microenvironments was found to play a key role in controlling tumor growth and improve the uptake of anticancer drugs.46
Figure 9.
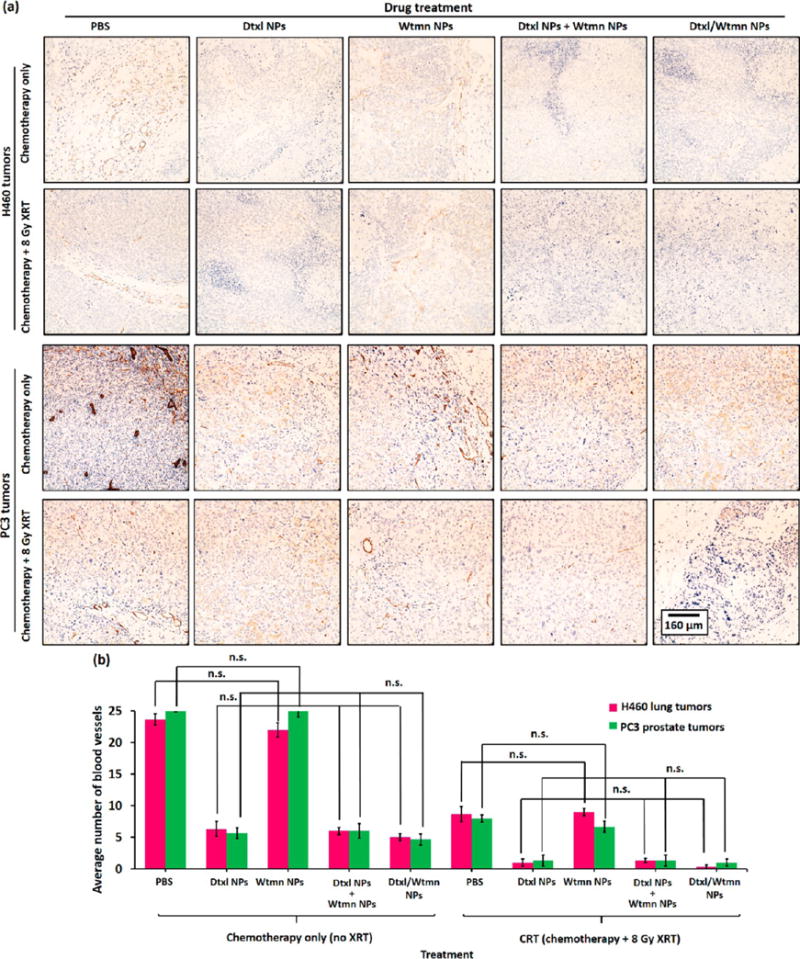
Antiangiogenic activities of encapsulated Dtxl and Wtmn in H460 and PC3 xenograft tumors. (a) Representative optical micrographs of CD31 anitbody-stained tumor section collected from xenograft tumor-bearing mice 4 days after iv administration of Dtxl NPs, Wtmn NPs, a combination of Dtxl NPs and Wtmn NPs, or Dtxl/Wtmn-coencapsulated NPs for chemotherapy/chemoradiotherapy. The immunohistological stain labels vascular endothelial cells in brown for blood-vessel-counting purposes. (b) Blood vessel counts of different chemotherapy and chemoradiotherapy treatment group tumors (n = 3 per group).
Wtmn Rewired Cell Apoptotic Pathways and Enhanced Dtxl-Induced DNA Damage
DNA damage arising from ionization radiation and/or genotoxic chemotherapy drug (e.g., Dtxl, cisplatin) triggers programmed cell death (also known as apoptosis) if DNA-repairing proteins fail to repair the damage.19,20,23–25,28,36,48,49 The degree of DNA damage caused by chemotherapy and/or CRT can be quantified by γ-H2AX immunohistochemistry stain, a biomarker for DNA double-strand breaks. As shown in Figure 10, the administration of Wtmn NPs did not trigger any significant DNA damage compared with the control group. The administration of Dtxl NPs caused moderate DNA damage, with γ-H2AX phosphorylation increasing by about 30% compared with the control group in both cell lines. This is attributed to the ability of Dtxl to stabilize microtubules and inhibit microtubule depolymerization via the γ-H2AX formation pathway. The administration of a combination of Dtxl NPs and Wtmn NPs or Dtxl/Wtmn-coencapsulated NPs significantly increased the γ-H2AX phosphorylation in both cell lines by about 55% and 65% (see Figure 10), respectively. This is because Wtmn rewired the cell apoptosis pathways and enhanced the therapeutic effect of Dtxl. The DNA damage increased after the administration of Dtxl/Wtmn-coencapsulated NPs, as the tailor-made PEG–PLGA NPs precisely controlled the drug doses. Similar to previous studies,2,50 radiotherapy caused extensive DNA damage, as indicated by the increase of γ-H2AX phosphorylation by 66% and 45% for H460 and PC3 tumors (see Figure 10), respectively. The administration of Dtxl NPs or Wtmn NPs in conjunction with radiotherapy further increased the γ-H2AX phosphorylation because both drugs act as radiosensitizers to inhibit other metabolic processes to repair DNA damage caused by ionization radiation: Dtxl inhibits DNA repair by stabilizing microtubules and inhibiting microtubule depolymerization,19,20,49 and Wtmn inhibits DNA repair by inhibiting key DNA repair proteins (including DNA-PK, KU-70, KU-80, and ATM).23–25,28 The administration of a combination of Dtxl NPs and Wtmn NPs or Dtxl/Wtmn NPs for chemoradiotherapy increased the DNA damage due to dynamic rewiring of apoptotic pathways.26 The coadministration of both single-drug-loaded NPs increased γ-H2AX phosphorylation by about 120% compared with the control group in both tumors. The administration of Dtxl/Wtmn NPs further increased DNA damage with γ-H2AX phosphorylation by 160% and 150% versus the control group administration with PBS in H460 and PC3 tumors (see Figure 10), respectively. This improvement is likely due to the fact that co-delivery allows more precise control of drug dose and ensures that each tumor cell receives the desirable ratio of therapeutics.
Figure 10.
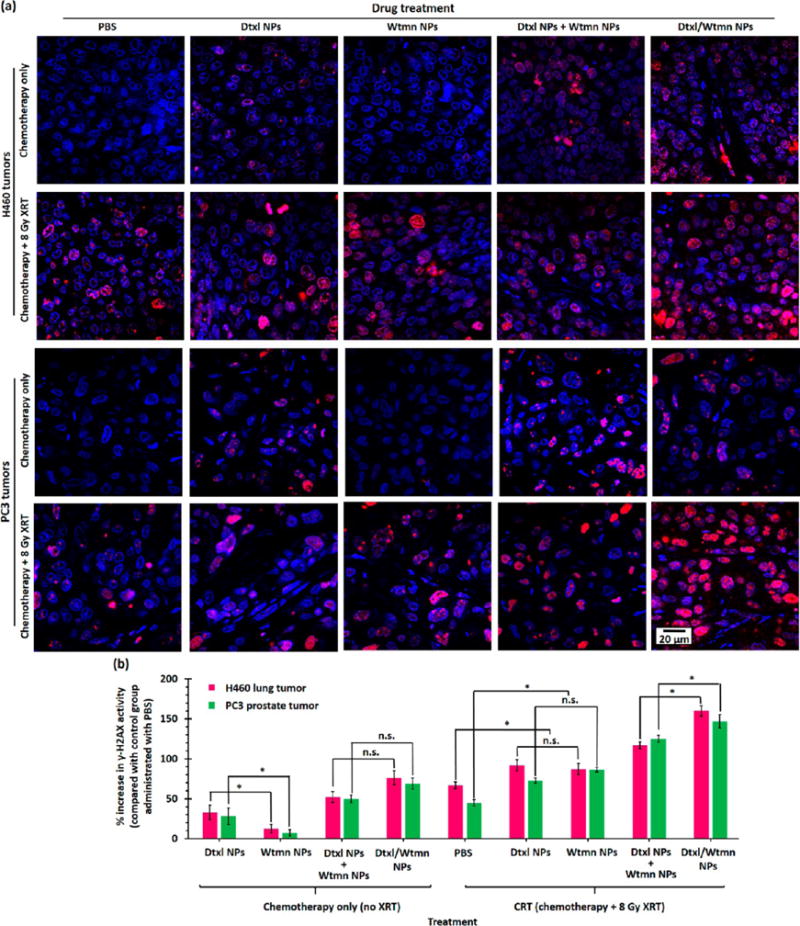
DNA damage in H460 and PC3 xenograft tumors induced by chemotherapy or chemoradiotherapy. (a) Representative confocal fluorescent images of γ-H2AX antibody-stained tumor sections collected 4 days after iv administration of Dtxl NPs, Wtmn NPs, a combination of Dtxl NPs and Wtmn NPs, or Dtxl/Wtmn-coencapsulated NPs for chemotherapy/chemoradiotherapy. The γ-H2AX antibody (red) binds to the double-strand DNA breaks (foci), allowing quantification of DNA damage caused by chemotherapy and/or radiotherapy. The nuclei were stained with Hoechst stain (blue). (b) Plot of percentage increase in γ-H2AX activity (γ-H2AX fluorescence intensity) of different treatment group tumor sections compared with control group tumor sections (n = 3 per group).
The degree of early-stage apoptosis in H460 and PC3 xenograft tumors after receiving different treatments was investigated using caspase 3 (an early-stage apoptosis marker) immunohistochemistry stain51 on representative tumor sections (see Figure 11). Treatment with Dtxl NP or Wtmn NP did not significantly (p = 0.09) increase the caspase 3 activity compared with the nontreatment control group. Conversely, treatment with a combination of Dtxl NPs and Wtmn NPs or Dtxl/Wtmn-coencapsulated NPs significantly increased the caspase 3 activities by about 80% and 115%, respectively. The percentage increases in caspase 3 activities in both combination therapy treatment groups are significantly higher than the sum of those induced by both single-drug treatments. This quantitative immunohistological study confirms that the increases in apoptosis in both combination chemotherapy groups primarily resulted from dynamic rewiring of cell apoptosis pathways by Wtmn-encapsulated NPs and hence increased efficiency of Dtxl-induced cell death in vivo,26 which is consistent with the quantitative study of tumor growth delay in both cell lines. Ionization radiation induces cell death via caspase 3-dependent pathways.52 The use of 8 Gy fractionated radiotherapy alone efficiently increased the caspase 3 activities by 60–70% compared with those of the nontreatment group. Concurrent chemoradiotherapy treatment with Dtxl NPs did not significantly increase the caspase 3 activity (p = 0.29–0.33 versus radiotherapy-only treatment groups), whereas chemoradiotherapy administered with Wtmn NPs slightly further increased the caspase 3 activity (p = 0.03–0.05 versus the radiotherapy-only treatment group in both cell lines) because Wtmn is a more efficient radiosensitizer than Dtxl, as justified by the in vitro cologenic survival. Similar to chemotherapy, the caspase 3 activities after chemoradiotherapy treatments with a combination of Dtxl NPs and Wtmn NPs or Dtxl/Wtmn-coencapsulated NPs were significantly increased by 450–610% in the H460 cell line and 150–280% in the PC3 cell line compared with the control group, which is much higher than the sum of increase in caspase 3 activities as a result of radiotherapy and two single-drug treatments. This further confirms the dynamic rewiring effect of the encapsulated Wtmn. The increase in caspase 3 activities in the Dtxl/Wtmn-coencapsulated NPs treatment group in both cell lines was significantly higher than that resulting from the coadministration of Dtxl NPs and Wtmn NPs (p = 0.01–0.03) in the chemotherapy and chemoradiotherapy groups. This histological study confirms our hypothesis that coencapsulation of two drugs in the same package is essential to precisely control the drug doses for rewiring of cell apoptosis pathways and thus enhances the efficiency of chemoradiotherapy.
Figure 11.
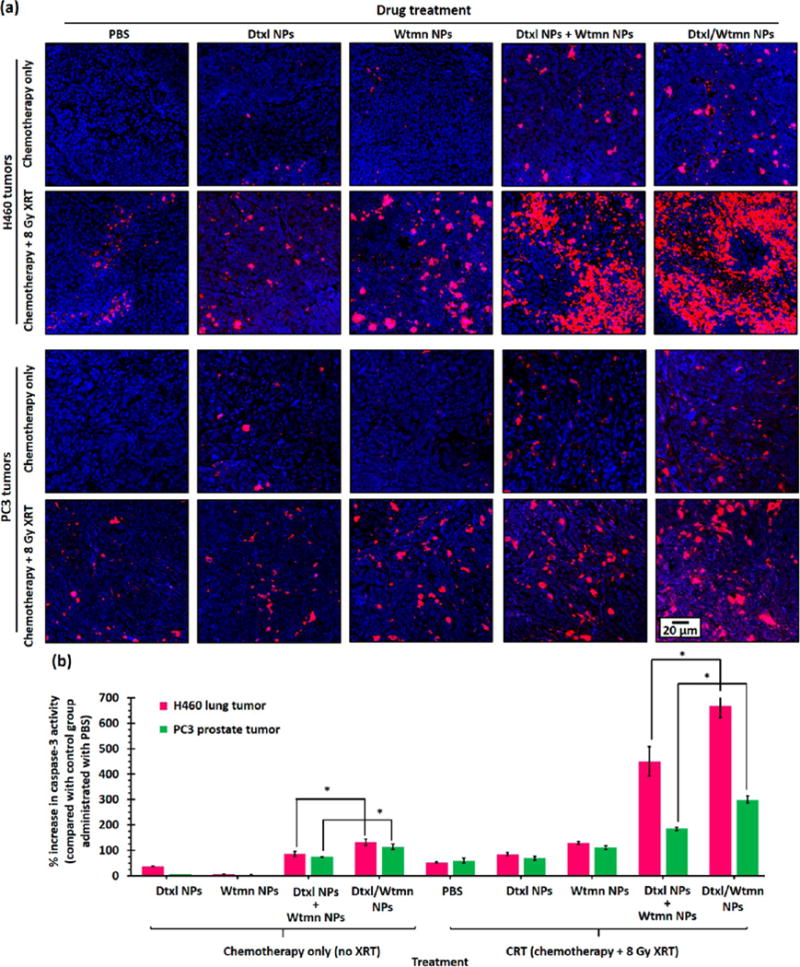
Early-stage apoptosis signal in H460 and PC3 xenograft tumors after different chemotherapy or chemoradiotherapy treatments. (a) Representative confocal fluorescent images of caspase 3 antibody-stained tumor sections collected 4 days after iv administration of Dtxl NPs, Wtmn NPs, a combination of Dtxl NPs and Wtmn NPs, or Dtxl/Wtmn-coencapsulated NPs for chemotherapy/chemoradiotherapy. Caspase 3 cleavage (red) represents early-stage apoptosis in cancer cells. The caspase 3 fluorescence intensity (red) is directly proportional to the apoptosis activities in tumor. The nuclei were stained with Hoechst stain (blue). (b) Plot of increase in caspase 3 activity versus nontreatment control group (and hence the apoptosis activities) of different treatment group tumors (n = 3 per group).
CONCLUSIONS
Our study has demonstrated that dynamic rewiring of cell apoptosis pathways by sequential application of a cell signaling inhibitor (e.g., Wtmn) and a genotoxic anticancer agent (e.g., Dtxl) is an excellent strategy to improve CRT. We engineered near-monodisperse sub-50 nm diameter Dtxl and/or Wtmn (co)encapsulated PEG–PLGA NPs that can sequentially release encapsulated Wtmn and Dtxl. A time-dependent in vitro toxicity study revealed that small-molecule Wtmn pretreatment (but not cotreatment or post-treatment) sensitized small-molecule Dtxl and enhanced cell killing in fast-growing H460 lung cancer and slow-growing PC3 prostate cancer cell lines, which can be achieved by a single administration of the encapsulated Wtmn and Dtxl (either as a combination of two single-drug-loaded NPs or as dual-drug loaded NPs). A clonogenic survival assay demonstrated that a single administration of a therapeutic dose (i.e., IC50) of encapsulated Wtmn and Dtxl (either as a combination of two single-drug-loaded NPs or as dual-drug-loaded NPs) increased the efficiency of radiotherapy by nearly 100% and reduced the quasi-threshold doses by about 50%, which can only be achieved by sequential in vitro application of small-molecule Wtmn and Dtxl.
Poor uptake of anticancer drugs is a major challenge in traditional chemotherapy. A time-dependent in vivo fluorescent imaging study in H460 and PC3 tumor xenograft-bearing Nu mice indicated that tailor-made sub-50 nm diameter fluorescent-labeled PEG–PLGA NPs were rapidly taken up and approximately 35% of the administrated NPs were retained in xenograft tumors due to the enhanced permeability and retention (EPR) effect. Hepatotoxicity and hematologic toxicity studies demonstrated that encapsulation of cytotoxic Dtxl and Wtmn into the tailor-made PEG–PLGA NPs significantly reduced the systemic toxicities that were observed after the administration of their small-molecule counterparts. An in vivo tumor growth delay study demonstrated that co-delivered Dtxl and Wtmn via the novel PEG–PLGA NPs were more efficient in delaying xenograft tumor growth than coadministration of Dtxl NPs and Wtmn NPs. Histopathological studies revealed that Dtxl/Wtmn-coencapsulated NPs efficiently delayed tumor growth through inhibition of blood vessel growth, normalization of tumor local environment, enhancement of DNA damage induced by Dtxl and fractionated radiotherapy, and enhancement of apoptosis induced by Dtxl and fractionated radiotherapy. Future studies will focus on identifying other novel combination of agents that are synergistic in CRT.
MATERIALS AND METHODS
Materials
Near-monodisperse (Mw/Mn < 1.5) methoxy poly(ethylene glycol)-block-poly(lactic-co-glycolic acid) (PEG–PLGA) with molecular weights of 5000:10 000 (PEG(5K)–PLGA(10K), cat. No. AK010) and 5000:55 000 (PEG(5K)–PLGA(55K), cat. no. AK026) were purchased from Akina, Inc. (West Lafayette, IN, USA). The viscosities of the 1:1 lactic acid/glycolic acid hydrophobic block of the PEG(5K)–PLGA(10K) and PEG(5K)–PLGA(55K) were 0.16–0.24 and 0.61–0.74 dL/g (0.1 w/v % in chloroform), as provided by the manufacturer. Rhodamine B-labeled PLGA (MW ≈ 30 000, cat. no. AV11) was purchased from Akina, Inc. Docetaxel and wortmannin were purchased from Sigma-Aldrich (St. Louis, MO, USA). Acetonitrile (HPLC grade) and double-deionized (HPLC grade, submicrometer filtered) were purchased from Fischer Scientific (Hampton, NH, USA). Dulbecco’s phosphate buffer saline (0.1 M, PBS) was purchased from Gibco by Life Technologies (Carlsbad, CA, USA).
Preparation of Wtmn and/or Dtxl (Co)Encapsulated PEG–PLGA NPs
Wtmn and/or Dtxl (co)encapsulated PEG–PLGA NPs were prepared via a nanoprecipitation method. Briefly, small-molecule Wtmn and Dtxl with different target molar ratios, PEG(5K)–PLGA(10K), and PEG(5K)–PLGA(55K) were dissolved separately in acetonitrile at final concentrations of 1 mg/mL for free drug(s) and 20 mg/mL for both diblock copolymers, respectively. For a typical preparation of 10 mg drug-loaded PEG–PLGA NPs with 5 wt/wt % target drug loading, 250 μL of PEG(5K)–PLGA(10K) solution and 250 μL of PEG(5K)–PLGA(55K) solution were mixed with 500 μL of the dissolved drug solution via vortex mixer (3000 rpm, 30 s) and added dropwise (1 mL/min) into 3 mL of deionized water under constant stirring (1000 rpm). The mixture was stirred under vacuum at 20 °C for 2 h to allow self-assembly. The resulting NPs were purified by washing four times using an Amicron Ultra-4 ultracentrifugation filter membrane (Millipore, Billerica, MA, USA) with a molecular weight cutoff at 30 kDa, and they were then resuspended in 0.1 M PBS.
Preparation of Rhodamine B-Labeled Empty PEG–PLGA NPs
Rhodamine B-labeled empty PEG–PLGA NPs were prepared via a nanoprecipitation method in the presence of 2.5 wt/wt % rhodamine B-conjugated PLGA (Rhod-PLGA(30K)). Briefly, 0.5 mg/mL of Rhod-PLGA, 20 mg/mL of PEG(5K)–PLGA(10K), and 20 mg/mL of PEG(5K)–PLGA(55K) were dissolved separately in acetonitrile via sonication (1 min). For the preparation of 10 mg of Rhod-labeled PEG–PLGA NPs, 500 μL of Rhod-PLGA and 250 μL of each PEG–PLGA solution were mixed together via vortex mixer (3000 rpm, 30 s) and added dropwise (1 mL/min) to 3 mL of deionized water under constant stirring (1000 rpm). The mixture was stirred in the dark under vacuum for 2 h before being purified by ultrafiltration using an Amicron Ultra ultrafiltration membrane filter with a 30 000 nominal molecular weight cutoff (four times, 3000g for 15 min). After each washing, the NPs were resuspended in 0.1 M PBS. The purified NPs were concentrated to 5 mg/mL before further use.
NP Characterization
Purified drug-free, single- and dual-drug-loaded PEG–PLGA NPs dispersed in 0.1 M PBS were fully characterized by TEM, NTA, DLS, and aqueous electrophoresis techniques. TEM images were recorded using a Zeiss TEM 910 transmission electron microscope operated at 80 kV (Carl Zeiss Microscopy, LLC, Thornwood, NY, USA) in Microscopy Services Laboratory Core Facility at the UNC School of Medicine. Prior to TEM imaging, concentrated NP samples were diluted to 5 μg/mL by mixing with deionized water. A 5 μL portion of each diluted sample was mixed with 5 μL of 4% uranyl acetate aqueous solution before being added to a 400-mesh carbon-filmed copper grid via a pipet. Excess NP dispersion was removed by filter paper at the edge of the copper grid. The recorded TEM images were processed using ImageJ (NIH). Number-average diameter (Dn) was determined based on the average diameter of at least 150 particles from a representative TEM image. The mean number-average diameter and particle concentrations of different NP dispersions were determined by an NP-tracking analysis method recorded on a Nanosight NS500 instrument (Malvern, Inc.) in the Microscopy Services Laboratory Core Facility at the UNC School of Medicine. All NP dispersions were diluted to 5 μg/mL prior to the NP-tracking analysis. Intensity-average diameter (Dh, also known as hydrodynamic diameter) and mean zeta potential (mean ζ) of NP dispersions were determined by dynamic light scattering and an aqueous electrophoresis method using a Zetasizer Nano ZS Instrument (Malvern, Inc.). Prior to the measurements, NPs were diluted to 1 mg/mL with 0.1 PBS. All measurements were based on the average of three separate measurements.
Drug-Loading Determination
Dtxl and Wtmn loading in the single- and dual-drug-loaded PEG–PLGA NPs was quantified using a Shimadzu SPD-M20A high-performance liquid chromatography (HPLC) instrument equipped with a diode array detector and a GP-C18 reverse-phase column (pore size = 120 Å, 4.6 × 150 mm; Sepax Technology Inc., Newark, DE, USA). A linear gradient from 10% acetonitrile in water to 100% acetonitrile was run over 10 min. Then, 100% acetonitrile was run for 5 min. Finally, 10% acetonitrile in water was run for 5 min. The flow rate was 1 mL/min, and detections were at 227 nm (retention time = 8.9 min) for Dtxl and 254 nm for Wtmn (retention time = 7.8 min). A 20 μL amount of each type of purified PEG–PLGA NPs (5 mg/mL) was mixed thoroughly with 180 μL of acetonitrile and left overnight at 5 °C to disrupt the NPs prior to HPLC analysis. Drug concentration was determined using standard curves. All measurements were performance in triplicate.
In Vitro Drug-Release Study
In vitro drug-release profiles of different single- and dual-drug-loaded NPs were recorded under sink conditions. NP solutions at a concentration of 5 mg/mL were split into Slide-A-Lyzer MINI dialysis microtubes with a molecular cutoff of 10 kDa (Pierce, Rockford, IL, USA) and subjected to dialysis against a large excess of phosphate buffer saline (500 μL of NP dispersion per 1 L of 0.1 M PBS) with gentle stirring at 37 °C. PBS was changed periodically (every 6–12 h) during the process. At the indicated times, 20 μL of solution was removed from the microtubes and mixed with 180 μL of acetonitrile to dissolve the NPs. Dtxl and Wtmn contents were determined used a Shimadzu SPD-M20A HPLC instrument using mentioned experimental settings and quantified using Dtxl and Wtmn standard curves. All measurements were performed in triplicate. Drug-release profiles were fitted to an empirical Weibull model, where the cumulative percentage of the drug released (Q(t)/Q0) at time t is given by the following equation:32
| (1) |
where tlag is the lag time before drug release takes places, tscale is the time scale for the release process, and b characterizes the shape of the drug-release curve: b < 1 represents burst release, b ≈ 1 represents an intermediate-release profile, and b > 1 represents sigmoidal release. Drug-release half-life (t1/2) is defined as the time for half of the encapsulated drug to be released.
Cell Culture
H460 non-small-cell lung cancer cells and PC3 prostate cancer cells were obtained from American Type Culture Collection (ATCC). H460 cells were cultured using RPMI-1640 medium supplemented with 10% (v/v) FBS, 2 mM glutamine, 1.5 g/L sodium bicarbonate, 10 mM HEPES buffer (Corning), 1 mM sodium pyruvate, 1% (v/v) penicillin/streptomycin, and 4.5 g/L glucose (Sigma). PC3 cells were cultured in a 1:1 mixture of DMEM and Ham’s F-12 medium (Gibco) supplemented with 10% (v/v) FBS and 1% (v/v) penicillin/streptomycin (Sigma). The cell density of trypsinized cancer cells was determined by an Orflo Moxi Z Mini automated cell counter (Orflo, Ketchum, ID, USA). Phenol red-free culture media were used in all fluorescent imaging studies.
In Vitro Cytotoxicity
In vitro toxicities of different drug formulations were evaluated using a cell viability assay. In a 96-well plate, 1 × 10⁴ H460 or PC3 cells were plated 24 h prior to treatment with drug-free PEG–PLGA NPs or small-molecule or encapsulated Dtxl/Wtmn in 1:0, 4:1, 8:1, and 0:1 molar ratios. [It was determined that the number of H460 and PC3 cells increased from 1 × 10⁴ cells per well to 1.43 × 10⁴ and 1.15 × 10⁴ cells per well, respectively, after being plated in the 96-well plate under the given experimental conditions.] For non-time-dependent studies, cancer cells were treated with 1 nM to 40 μM small-molecule or encapsulated drug(s) at 37 °C for 2 h. The cells were washed with PBS and allowed to grow in complete cell culture media for 72 h. For time-dependent drug treatment studies, the cells were treated with the first small-molecule drug for 2 h and washed three times with PBS before being treated with the second drug. In both cases, cells were washed with PBS and allowed to grow in complete cell culture medium for 72 h. Cell viability was then analyzed using an MTS assay according to the manufacturer’s (Promega) instructions. The absorbance at 492 nm (directly reflects cell viability) was recorded using a 96-well plate reader (Infinite 200 Pro, Tecan i-control). The IC50 of different treatments was calculated by fitting the dose-dependent cell viabilities to a four-parameter logistic (4 PL) model using the MasterPlex 2010 software pack (MiraiBio Group, Hitachi Solutions America, Ltd.). Student’s t test was performed for statistical analysis.
Clonogenic Survival Assay
A 1 × 10⁶ amount of H460 and PC3 cells was seeded in 15 mL of culture medium in a 75 mL flask overnight before treatment. For non-time-dependent studies, cells were treated with therapeutic doses (IC50) of small-molecule or encapsulated drugs for 2 h and washed three times with cold PBS. For time-dependent drug treatment studies, the cells were treated with the first small-molecule drug for 2 h and washed three times with PBS before being treated with the second drug for another 2 h. In both cases, cells were trypsinized and resuspended in cold complete culture medium. The 25 mL cell mixtures with densities ranging from 100 to 10 000 cells per mL were transferred to 50 mL centrifuge tubes and irradiated with 0, 2, 4, 6, and 8 Gy from an X-RAD 320 (Precision X-ray) machine operating at 320 kVp and 12.5 mA. The irradiated cells were transferred to 5 mL flasks (each with 5 mL of irradiated cells) and allowed to grow for 14 days. After the removal of the culture medium, colonies were fixed in 4% (v/v) neutral buffered formalin and stained with trypan blue. All colonies with over 50 cells were counted. The quasi-threshold dose (Dq) and the dose required to achieve a survival fraction of 0.1 were determined using the CS-Cal clonogenic survival calculation software pack (http://angiogenesis.dkfz.de/oncoexpress/software/cs-cal/index.htm) by fitting the radiation dose-dependent number of colonies into the linear-quadratic equation.38
In Vitro Cellular Uptake Study
For the time-dependent NP uptake study, 1 × 10⁴ H460 or PC3 cells were plated in a 96-well fluorescent imaging plate (Greiner) for 24 h prior to the application of 50 μg/mL of Rhod-labeled PEG–PLGA NPs (100 μL per well). [It was determined that the number of H460 and PC3 cells increased from 1 × 10⁴ cells per well to 1.43 × 10⁴ and 1.15 × 10⁴ cells per well, respectively, after being plated in a 96-well plate under the given experimental conditions.] At a desired time, the NPs were removed, washed three times with PBS, and fixed with 4% (v/v) neutral buffered formalin. The uptake of Rhod-labeled PEG–PLGA NPs was determined via a 96-well plate reader (Infinite 200 Pro, Tecan i-control) using an excitation wavelength of 535 nm and an emission wavelength of 595 nm. For the concentration-dependent NP uptake study, 1 × 10⁴ H460 or PC3 cells were plated in a 96-well fluorescent imaging plate (Greiner) for 24 h prior to the application of 1 to 500 μg/mL of Rhod-labeled PEG–PLGA NPs (100 μL per well). [It was determined that the number of H460 and PC3 cells increased from 1 × 10⁴ cells per well to 1.43 × 10⁴ and 1.15 × 10⁴ cells per well, respectively, after being plated in a 96-well plate under the given experimental conditions.] The NPs were removed after being incubated for 2 h, washed three times with PBS, and fixed with 4% (v/v) neutral buffered formalin. The fluorescence NPs’ uptake was determined using a 96-well plate reader (Infinite 200 Pro, Tecan i-control) using an excitation wavelength of 535 nm and emission wavelength of 595 nm. The fluorescent imaging study was performed in an eight-well culture slide (Fischer). A total of 1 × 10⁴ H460 or PC3 cells were plated in an eight-well culture slide (Fischer) for 24 h prior to the application of 5 μg/mL of Rhod-labeled PEG–PLGA NPs (100 μL per well). After being incubated for 30 min, the NPs were removed, washed three times with PBS, and fixed with 4% (v/v) neutral buffered formalin; then 4′,6-diamidino-2-phenylindole (DAPI/Antifade solution; EHD Millipore) was added to label the nucleus. The cell culture slide was imaged on a Zeiss CLSM 710 spectral confocal laser scanning microscope in the Microscopy Services Laboratory Core Facility at the UNC School of Medicine.
In Vivo Studies
Animals were maintained in the Center for Experimental Animals (an AAALAC-accredited experimental animal facility) under sterile environments at the University of North Carolina. All procedures involving experimental animals were performed in accordance with the protocols approved by the University of North Carolina Institutional Animal Care and Use Committee and conformed to the Guide for the Care and Use of Laboratory Animals (NIH publication no. 86-23, revised 1985).
In Vivo Tumor Uptake and Biodistribution Study
Tumor uptake and biodistribution of iv-administered Rhod-labeled PEG–PLGA NPs were determined by an in vivo fluorescence imaging method. Xenograft tumors were inoculated in the left flank of male athymic nude mice (6–7 weeks old, 29–30 g; UNC Animal Services Core, Chapel Hill, NC, USA) by subcutaneous (sc) injection of 1 × 10⁶ H460 or PC3 cells in 200 μL of a 1:1 (v/v) mixture of serum-free RPMI-1640 (for H460 cells) or a 1:1 mixture of DMEM and Ham’s F-12 medium/Matrigel solution. Ten (for H460 xenograft tumor-bearing mice) or 14 (for PC3 xenograft tumor-bearing mice) days after tumor inoculation, each mouse was given a tail-vein iv injection of 165 mg/kg of Rhod-labeled PEG–PLGA NPs (200 μL). Whole-body fluorescent images were recorded before, 5 min after, and 3, 6, 9, 24, and 48 h after iv administration of the Rhod-labeled PEG–PLGA NPs via an IVIS Kinetic Imaging System (Caliper Life Sciences, Hopkiton, MA, USA) equipped with an excitation filter of 570 nm and an emission filter of 600 nm in the Small Animal Imaging Facility at the UNC School of Medicine. All imaging parameters were kept constant for the whole imaging study. Region-of-interest values were recorded using Living Image software as photon flux (also known as radiance) in total photon count per centimeter-squared per steradian (p s−1 cm−2 Sr−1). All mice were euthanized 48 h after the live animal imaging study by overdose of carbon dioxide. Xenograft tumor, liver, kidney, spleen, heart, and lung were immediately preserved for an ex vivo biodistribution study via an IVIS Kinetic Imaging System using the previously mentioned imaging parameters. The xenograft tumors were fixed in 4% (v/v) neutral buffered formalin at 5 °C for 2 days, then 40% ethanol at 5 °C for another 2 days before being sectioned. Tumor sections were stained with DAPI to label the nucleus. The tumor sections were imaged on a Zeiss CLSM 710 Spectral confocal laser scanning microscope in the Microscopy Services Laboratory Core Facility at the UNC School of Medicine.
In Vivo Toxicity Study
In vivo toxicity of different small-molecule formulations and nanoformulations were evaluated in healthy tumor-free CD 1 mice. In the in vivo study, 10-week-old male CD1 mice (Charles River Laboratory, Durham, NC, USA) were given a tail-vein iv injection of 200 μL of PBS, 4% v/v of acetonitrile in PBS (acetonitrile was used to dissolve small-molecule drugs prior to iv injection), 165 mg/kg of empty PEG–PLGA NPs, 1.9 mg/kg of small-molecule/(co)encapsulated Dtxl, and/or 0.25 mg/kg of small-molecule/(co)encapsulated Wtmn (1/10th of the MTD of an individual drug). Each mouse was anesthetized 72 h after iv injection via sc injection of 100 μL of a ketamine hydrochloride/xylazine hydrochloride solution (Sigma). Circulating blood (about 0.6 mL) was collected directly from the heart. A 100 μL amount of each whole-blood sample was stored in an EDTA-coated tube and stored at 5 °C prior to blood toxicity study in the Animal Clinical Laboratory Core Facility at the UNC Medical School. A 400 μL portion of each whole-blood sample was transferred to a microcentrifuge tube and stored at room temperature for 20 min before being centrifuged at 3000g (5 min) to separate the red blood cells from the plasma. The isolated plasma was stored at 5 °C before being submitted to the Animal Clinical Laboratory Core Facility at the UNC Medical School for hepatotoxicity studies.
In Vivo Anticancer Efficiency
Xenograft tumors were inoculated in the left flank of male athymic nude mice (6–7 weeks old, 28–30 g; UNC Animal Services Core, Chapel Hill, NC, USA) by sc injection of 1 × 10⁶ H460 or PC3 cells in 200 μL of a 1:1 (v/v) mixture of serum-free RPMI-1640 (for H460 cells) or a 1:1 mixture of DMEM and Ham’s F-12 medium/Matrigel solution. Ten days (for H460 xenograft tumor) or 14 days (for PC3 xenograft tumor) after tumor inoculation, the mice were randomly distributed into 16 groups (5 or 6 per group) for different treatments. Prior to treatment, all mice were ear-tagged, the initial tumor volumes were measured by a caliper, and the average body weights were recorded. For the chemotherapy treatment groups, the mice received a single tail-vein iv administration of either 200 μL of PBS (control group), 33 mg/kg of drug-free (“empty”) PEG–PLGA NPs, 0.38 mg/kg of encapsulated Dtxl, 0.05 mg/kg of encapsulated Wtmn, or 0.38 mg/kg of encapsulated Dtxl and 0.05 mg/kg of encapsulated Wtmn (either a combination of two single-drug-loaded NPs or dual-drug-loaded NPs). For the concurrent CRT groups, mice received a total of 8 Gy of fractionated radiation at 3 and 15 h (4 Gy in each section) after chemotherapy. In vivo radiotherapy was performed in a Precision X-RAD 320 (Precision X-ray, Inc.) machine operating at 320 kVp and 12.5 mA. The source–subject distance was 70 cm, and the dose rate was 50 cGy/min. Only the tumor regions (left flank) of the mice were irradiated, as the remaining parts of the body were lead-shielded. Tumor volume was measured every 2–3 days via a caliper. Tumor volumes were calculated by measuring two perpendicular diameters with a caliper and by using the formula V = 0.5 × a × b2, where a and b are the larger and smaller diameters, respectively. The initial tumor volumes for H460 and PC3 xenograft tumors were found to be 67 ± 4 and 54 ± 4 mm3, respectively. Tumor growth for different treatment modalities was monitored until the large diameter increased to above 20 mm or the volume increased to above 40 times its initial volume, at which point the animals were euthanized by overdose of carbon dioxide.
The average growth delay, normalized growth delay (NGD), and enhancement factor determined for the CRT groups were defined and calculated according to a well-documented method.19,20 Briefly, AGD is equal to the number of days it took for the tumor in the treated group to grow to 40 times its initial volume minus the time for the tumor in the untreated control group (administrated with PBS only) to reach the same size. NGD was defined as the time for the tumor in the CRT treatment groups to grow to 40 times its initial volume minus the time for the tumor in the chemotherapy-only treatment groups to grow to 40 times its initial volume. EF equals the ratio of the NGD of a particular treatment group to the AGD of the treatment group receiving only radiotherapy.
The tumor growth of PC3 xenograft tumor-bearing mice receiving CRT with encapsulated Dtxl and Wtmn (either a combination of two single-drug-loaded NPs or dual-drug-loaded NPs) was further monitored using a Vevo-2100 ultrasound instrument (Visualsonics Inc.) in the Small Animal Imaging Facility at UNC School of Medicine. Tumors were collected at the study end-point (122 days after treatment) and fixed in 4% (v/v) neutral buffered formalin at 5 °C for 2 days and 40% ethanol at 5 °C for another 2 days before being submitted to the Animal Histopathology Core Facility at the UNC Medical School for hematoxylin and eosin staining via a biological tissue automatic staining machine. Representative tumor sections were imaged using an Olympus IX 81 inverted wide-field light microscope in the Microscopy Services Laboratory at the UNC Medical School.
Tumor Histology
Xenograft tumors were inoculated in the left flank of male athymic nude mice (6–7 weeks old, 29–30 g; UNC Animal Services Core) by sc injection of 1 × 10⁶ H460 or PC3 cells in 200 μL of a 1:1 (v/v) mixture of serum-free RPMI-1640 (for H460 cells) or a 1:1 mixture of DMEM and Ham’s F-12 medium/Matrigel solution. Ten days (for H460 xenograft tumor) or 14 days (for PC3 xenograft tumor) after tumor inoculation, the mice were randomly distributed into 16 groups (3 per group) for different treatments. Prior to treatment, all mice were ear-tagged, the initial tumor volumes were measured by a caliper, and the average body weights were recorded. For the chemotherapy treatment groups, mice received a single tail-vein iv administration of either PBS (control group), 33 mg/kg of drug-free (“empty”) PEG–PLGA NPs, 0.38 mg/kg of encapsulated Dtxl, 0.05 mg/kg of encapsulated Wtmn, or 0.38 mg/kg of encapsulated Dtxl and 0.05 mg/kg of encapsulated Wtmn (either a combination of two single-drug-loaded NPs or dual-drug-loaded NPs). For the concurrent CRT groups, mice received a total of 8 Gy of fractionated radiation at 3 and 15 h (4 Gy in each section) after chemotherapy. In vivo radiotherapy was performed in a Precision X-RAD 320 (Precision X-ray, Inc.) machine operating at 320 kVp and 12.5 mA. The dose rate was at a source–subject distance of 70 cm and was 50 cGy/min. Only the tumor regions (left flank) of the mice were irradiated, as remaining parts of the body were lead-shielded. Four days after the initial treatment, mice were euthanized by overdose of carbon dioxide. Tumors were collected and fixed in 4% (v/v) neutral buffered formalin at 5 °C for 2 days and 40% ethanol at 5 °C for another 2 days before being submitted to the Animal Histopathology Core Facility at the UNC Medical School for H&E and Masson’s trichrome staining. CD31, γ-H2AX, and caspase-3 immunohistochemistry staining was performed using biological tissue automatic staining machines in the Translational Pathology Lab at the UNC Medical School. Antibodies (CD31 from Abcam, Cambridge, MA, USA; γ-H2AX from Santa Cruz Biotechnology, Dallas, TA, USA; caspase-3 from Cell Signaling Technology, Danvers, MA, USA) were diluted to desired concentrations in accordance with manufacturers’ instructions before immunohistochemistry staining via automatic staining machines. All immunohistochemistry-stained slides were costained with Hoechst stain to label the nuclei. H&E-, Masson’s trichrome-, and CD-31-staind tumor sections were imaged using an Olympus IX 81 inverted wide-field light microscope in the Microscopy Services Laboratory at the UNC Medical School. γ-H2AX and caspase-3 immunohistochemistry-stained tumor sections were imaged on a Zeiss CLSM 710 spectral confocal laser scanning microscope in the Microscopy Services Laboratory Core Facility at the UNC School of Medicine. Confocal fluorescent images were processed using ImageJ (NIH).
Statistical Analysis
Quantitative data were expressed as mean ± SEM. The analysis of variance was completed using a one-way ANOVA in the Graph Pad Prism 6 software pack. p < 0.5 was considered statistically significant.
Supplementary Material
Acknowledgments
We thank the Microscopy Service Laboratory Core, Animal Study Core, Small Animal Imaging Facility, Animal Clinical Laboratory, Animal Histopathology Core Facility, and Translation Pathology Lab in the School of Medicine at the University of North Carolina at Chapel Hill for their assistance with procedures in this article. This work was supported by the University Cancer Research Fund from the University of North Carolina and R01CA178748 from the National Institutes of Health/National Cancer Institute. A.Z.W. was also supported by the National Institutes of Health Center for Nanotechnology Excellence Grant U54-CA151652.
Footnotes
Supporting Information Available: The Supporting Information is available free of charge on the ACS Publications website at DOI: 10.1021/acsnano.5b02913.
Experimental details (PDF)
Conflict of Interest: The authors declare no competing financial interest.
REFERENCES AND NOTES
- 1.Siegel RL, Miller KD, Jemal A. Cancer Statistics, 2015. Ca-Cancer J Clin. 2015;65:5–29. doi: 10.3322/caac.21254. [DOI] [PubMed] [Google Scholar]
- 2.Ross GM. Induction of Cell Death by Radiotherapy. Endocr-Relat Cancer. 1999;6:41–44. doi: 10.1677/erc.0.0060041. [DOI] [PubMed] [Google Scholar]
- 3.Baskar R, Lee KA, Yeo R, Yeoh KW. Cancer and Radiation Therapy: Current Advances and Future Directions. Int J Med Sci. 2012;9:193–199. doi: 10.7150/ijms.3635. [DOI] [PMC free article] [PubMed] [Google Scholar]
- 4.Seiwert TY, Salama JK, Vokes EE. The Concurrent Chemoradiation Paradigm–General Principles. Nat Clin Pract Oncol. 2007;4:86–100. doi: 10.1038/ncponc0714. [DOI] [PubMed] [Google Scholar]
- 5.Stupp R, Mason WP, van den Bent MJ, Weller M, Fisher B, Taphoorn MJ, Belanger K, Brandes AA, Marosi C, Bogdahn U, et al. Radiotherapy Plus Concomitant and Adjuvant Temozolomide for Glioblastoma. N Engl J Med. 2005;352:987–996. doi: 10.1056/NEJMoa043330. [DOI] [PubMed] [Google Scholar]
- 6.Willett CG, Czito BG. Chemoradiotherapy in Gastrointestinal Malignancies. Clin Oncol (R Coll Radiol) 2009;21:543–556. doi: 10.1016/j.clon.2009.05.004. [DOI] [PubMed] [Google Scholar]
- 7.Eifel PJ. Chemoradiotherapy in the Treatment of Cervical Cancer. Semin Radiat Oncol. 2006;16:177–185. doi: 10.1016/j.semradonc.2006.02.007. [DOI] [PubMed] [Google Scholar]
- 8.Curran WJ, Jr, Paulus R, Langer CJ, Komaki R, Lee JS, Hauser S, Movsas B, Wasserman T, Rosenthal SA, Gore E, et al. Sequential Vs. Concurrent Chemoradiation for Stage Iii Non-Small Cell Lung Cancer: Randomized Phase Iii Trial Rtog 9410. J Natl Cancer Inst. 2011;103:1452–1460. doi: 10.1093/jnci/djr325. [DOI] [PMC free article] [PubMed] [Google Scholar]
- 9.Forastiere AA, Goepfert H, Maor M, Pajak TF, Weber R, Morrison W, Glisson B, Trotti A, Ridge JA, Chao C, et al. Concurrent Chemotherapy and Radiotherapy for Organ Preservation in Advanced Laryngeal Cancer. N Engl J Med. 2003;349:2091–2098. doi: 10.1056/NEJMoa031317. [DOI] [PubMed] [Google Scholar]
- 10.Ajani JA, Winter KA, Gunderson LL, Pedersen J, Benson AB, 3rd, Thomas CR, Jr, Mayer RJ, Haddock MG, Rich TA, Willett C. Fluorouracil, Mitomycin, and Radiotherapy vs Fluorouracil, Cisplatin, and Radiotherapy for Carcinoma of the Anal Canal: A Randomized Controlled Trial. JAMA. 2008;299:1914–1921. doi: 10.1001/jama.299.16.1914. [DOI] [PubMed] [Google Scholar]
- 11.Habr-Gama A, Perez RO, Nadalin W, Sabbaga J, Ribeiro UJr, Silva e Sousa AH, Jr, Campos FG, Kiss DR, Gama-Rodrigues J. Operative Versus Nonoperative Treatment for Stage 0 Distal Rectal Cancer Following Chemoradiation Therapy: Long-Term Results. Ann Surg. 2004;240:711–717. doi: 10.1097/01.sla.0000141194.27992.32. discussion 717–718. [DOI] [PMC free article] [PubMed] [Google Scholar]
- 12.Maas M, Beets-Tan RG, Lambregts DM, Lammering G, Nelemans PJ, Engelen SM, van Dam RM, Jansen RL, Sosef M, Leijtens JW, et al. Wait-and-See Policy for Clinical Complete Responders after Chemoradiation for Rectal Cancer. J Clin Oncol. 2011;29:4633–4640. doi: 10.1200/JCO.2011.37.7176. [DOI] [PubMed] [Google Scholar]
- 13.James ND, Hussain SA, Hall E, Jenkins P, Tremlett J, Rawlings C, Crundwell M, Sizer B, Sreenivasan T, Hendron C, et al. Radiotherapy with or without Chemotherapy in Muscle-Invasive Bladder Cancer. N Engl J Med. 2012;366:1477–1488. doi: 10.1056/NEJMoa1106106. [DOI] [PubMed] [Google Scholar]
- 14.Cooper JS, Pajak TF, Forastiere AA, Jacobs J, Campbell BH, Saxman SB, Kish JA, Kim HE, Cmelak AJ, Rotman M, et al. Postoperative Concurrent Radiotherapy and Chemotherapy for High-Risk Squamous-Cell Carcinoma of the Head and Neck. N Engl J Med. 2004;350:1937–1944. doi: 10.1056/NEJMoa032646. [DOI] [PubMed] [Google Scholar]
- 15.Shenoy MA, Singh BB. Chemical Radiosensitizers in Cancer Therapy. Cancer Invest. 1992;10:533–551. doi: 10.3109/07357909209024816. [DOI] [PubMed] [Google Scholar]
- 16.Lee MJ, Ye AS, Gardino AK, Heijink AM, Sorger PK, MacBeath G, Yaffe MB. Sequential Application of Anticancer Drugs Enhances Cell Death by Rewiring Apoptotic Signaling Networks. Cell. 2012;149:780–794. doi: 10.1016/j.cell.2012.03.031. [DOI] [PMC free article] [PubMed] [Google Scholar]
- 17.Al-Lazikani B, Banerji U, Workman P. Combinatorial Drug Therapy for Cancer in the Post-Genomic Era. Nat Biotechnol. 2012;30:679–692. doi: 10.1038/nbt.2284. [DOI] [PubMed] [Google Scholar]
- 18.Morton SW, Lee MJ, Deng ZJ, Dreaden EC, Siouve E, Shopsowitz KE, Shah NJ, Yaffe MB, Hammond PT. A Nanoparticle-Based Combination Chemotherapy Delivery System for Enhanced Tumor Killing by Dynamic Rewiring of Signaling Pathways. Sci Signaling. 2014;7:ra44. doi: 10.1126/scisignal.2005261. [DOI] [PMC free article] [PubMed] [Google Scholar]
- 19.Mason KA, Hunter NR, Milas M, Abbruzzese JL, Milas L. Docetaxel Enhances Tumor Radioresponse in Vivo. Clin Cancer Res. 1997;3:2431–2438. [PubMed] [Google Scholar]
- 20.Mason KA, Kishi K, Hunter N, Buchmiller L, Akimoto T, Komaki R, Milas L. Effect of Docetaxel on the Therapeutic Ratio of Fractionated Radiotherapy in Vivo. Clin Cancer Res. 1999;5:4191–4198. [PubMed] [Google Scholar]
- 21.Rabi T, Bishayee A. D-Limonene Sensitizes Docetaxel-Induced Cytotoxicity in Human Prostate Cancer Cells: Generation of Reactive Oxygen Species and Induction of Apoptosis. J Carcinog. 2009;8:9. doi: 10.4103/1477-3163.51368. [DOI] [PMC free article] [PubMed] [Google Scholar]
- 22.Wipf P, Halter RJ. Chemistry and Biology of Wortmannin. Org Biomol Chem. 2005;3:2053–2061. doi: 10.1039/b504418a. [DOI] [PubMed] [Google Scholar]
- 23.Price BD, Youmell MB. The Phosphatidylinositol 3-Kinase Inhibitor Wortmannin Sensitizes Murine Fibroblasts and Human Tumor Cells to Radiation and Blocks Induction of P53 Following DNA Damage. Cancer Res. 1996;56:246–250. [PubMed] [Google Scholar]
- 24.Rosenzweig KE, Youmell MB, Palayoor ST, Price BD. Radiosensitization of Human Tumor Cells by the Phosphatidylinositol3-Kinase Inhibitors Wortmannin and Ly294002 Correlates with Inhibition of DNA-Dependent Protein Kinase and Prolonged G2-M Delay. Clin Cancer Res. 1997;3:1149–1156. [PubMed] [Google Scholar]
- 25.Sarkaria JN, Tibbetts RS, Busby EC, Kennedy AP, Hill DE, Abraham RT. Inhibition of Phosphoinositide 3-Kinase Related Kinases by the Radiosensitizing Agent Wortmannin. Cancer Res. 1998;58:4375–4382. [PubMed] [Google Scholar]
- 26.Zhang F, Zhang T, Qu Y, Jiang T, Cao YX, Li C, Fan L, Mei QB. Replication-Dependent Γ-H2ax Formation Is Involved in Docetaxel-Induced Apoptosis in Nsclc A549 Cells. Oncol Rep. 2010;24:1297–1305. doi: 10.3892/or_00000986. [DOI] [PubMed] [Google Scholar]
- 27.Caster JM, Sethi M, Kowalczyk S, Wang E, Tian X, Nabeel Hyder S, Wagner KT, Zhang YA, Kapadia C, Man AK, et al. Nanoparticle Delivery of Chemosensitizers Improve Chemotherapy Efficacy without Incurring Additional Toxicity. Nanoscale. 2015;7:2805–2811. doi: 10.1039/c4nr07102f. [DOI] [PMC free article] [PubMed] [Google Scholar]
- 28.Karve S, Werner ME, Sukumar R, Cummings ND, Copp JA, Wang EC, Li C, Sethi M, Chen RC, Pacold ME, et al. Revival of the Abandoned Therapeutic Wortmannin by Nanoparticle Drug Delivery. Proc Natl Acad Sci U S A. 2012;109:8230–8235. doi: 10.1073/pnas.1120508109. [DOI] [PMC free article] [PubMed] [Google Scholar]
- 29.Sethi M, Sukumar R, Karve S, Werner ME, Wang EC, Moore DT, Kowalczyk SR, Zhang L, Wang AZ. Effect of Drug Release Kinetics on Nanoparticle Therapeutic Efficacy and Toxicity. Nanoscale. 2014;6:2321–2327. doi: 10.1039/c3nr05961h. [DOI] [PMC free article] [PubMed] [Google Scholar]
- 30.Govender T, Stolnik S, Garnett MC, Illum L, Davis SS. PLGA Nanoparticles Prepared by Nanoprecipitation: Drug Loading and Release Studies of a Water Soluble Drug. J Controlled Release. 1999;57:171–185. doi: 10.1016/s0168-3659(98)00116-3. [DOI] [PubMed] [Google Scholar]
- 31.Tetko IV, Gasteiger J, Todeschini R, Mauri A, Livingstone D, Ertl P, Palyulin VA, Radchenko EV, Zefirov NS, Makarenko AS, et al. Virtual Computational Chemistry Laboratory–Design and Description. J Comput-Aided Mol Des. 2005;19:453–463. doi: 10.1007/s10822-005-8694-y. [DOI] [PubMed] [Google Scholar]
- 32.Barzegar-Jalali M, Adibkia K, Valizadeh H, Shadbad MR, Nokhodchi A, Omidi Y, Mohammadi G, Nezhadi SH, Hasan M. Kinetic Analysis of Drug Release from Nanoparticles. J Pharm Pharm Sci. 2008;11:167–177. doi: 10.18433/j3d59t. [DOI] [PubMed] [Google Scholar]
- 33.Chithrani BD, Chan WC. Elucidating the Mechanism of Cellular Uptake and Removal of Protein-Coated Gold Nanoparticles of Different Sizes and Shapes. Nano Lett. 2007;7:1542–1550. doi: 10.1021/nl070363y. [DOI] [PubMed] [Google Scholar]
- 34.Win KY, Feng SS. Effects of Particle Size and Surface Coating on Cellular Uptake of Polymeric Nanoparticles for Oral Delivery of Anticancer Drugs. Biomaterials. 2005;26:2713–2722. doi: 10.1016/j.biomaterials.2004.07.050. [DOI] [PubMed] [Google Scholar]
- 35.Cheng J, Teply BA, Sherifi I, Sung J, Luther G, Gu FX, Levy-Nissenbaum E, Radovic-Moreno AF, Langer R, Farokhzad OC. Formulation of Functionalized Plga-Peg Nanoparticles for in Vivo Targeted Drug Delivery. Biomaterials. 2007;28:869–876. doi: 10.1016/j.biomaterials.2006.09.047. [DOI] [PMC free article] [PubMed] [Google Scholar]
- 36.Dhar S, Gu FX, Langer R, Farokhzad OC, Lippard SJ. Targeted Delivery of Cisplatin to Prostate Cancer Cells by Aptamer Functionalized Pt(Iv) Prodrug-Plga-Peg Nanoparticles. Proc Natl Acad Sci U S A. 2008;105:17356–17361. doi: 10.1073/pnas.0809154105. [DOI] [PMC free article] [PubMed] [Google Scholar]
- 37.Gu F, Zhang L, Teply BA, Mann N, Wang A, Radovic-Moreno AF, Langer R, Farokhzad OC. Precise Engineering of Targeted Nanoparticles by Using Self-Assembled Biointegrated Block Copolymers. Proc Natl Acad Sci U S A. 2008;105:2586–2591. doi: 10.1073/pnas.0711714105. [DOI] [PMC free article] [PubMed] [Google Scholar]
- 38.Franken NA, Rodermond HM, Stap J, Haveman J, van Bree C. Clonogenic Assay of Cells in Vitro. Nat Protoc. 2006;1:2315–2319. doi: 10.1038/nprot.2006.339. [DOI] [PubMed] [Google Scholar]
- 39.Alexis F, Pridgen E, Molnar LK, Farokhzad OC. Factors Affecting the Clearance and Biodistribution of Polymeric Nanoparticles. Mol Pharmaceutics. 2008;5:505–515. doi: 10.1021/mp800051m. [DOI] [PMC free article] [PubMed] [Google Scholar]
- 40.Chu KS, Hasan W, Rawal S, Walsh MD, Enlow EM, Luft JC, Bridges AS, Kuijer JL, Napier ME, Zamboni WC, et al. Plasma, Tumor and Tissue Pharmacokinetics of Docetaxel Delivered Via Nanoparticles of Different Sizes and Shapes in Mice Bearing Skov-3 Human Ovarian Carcinoma Xenograft. Nanomedicine. 2013;9:686–693. doi: 10.1016/j.nano.2012.11.008. [DOI] [PMC free article] [PubMed] [Google Scholar]
- 41.Klibanov AL, Maruyama K, Torchilin VP, Huang L. Amphipathic Polyethyleneglycols Effectively Prolong the Circulation Time of Liposomes. FEBS Lett. 1990;268:235–237. doi: 10.1016/0014-5793(90)81016-h. [DOI] [PubMed] [Google Scholar]
- 42.Bertrand N, Wu J, Xu X, Kamaly N, Farokhzad OC. Cancer Nanotechnology: The Impact of Passive and Active Targeting in the Era of Modern Cancer Biology. Adv Drug Delivery Rev. 2014;66:2–25. doi: 10.1016/j.addr.2013.11.009. [DOI] [PMC free article] [PubMed] [Google Scholar]
- 43.Lotfi-Jam K, Carey M, Jefford M, Schofield P, Charleson C, Aranda S. Nonpharmacologic Strategies for Managing Common Chemotherapy Adverse Effects: A Systematic Review. J Clin Oncol. 2008;26:5618–5629. doi: 10.1200/JCO.2007.15.9053. [DOI] [PubMed] [Google Scholar]
- 44.Liu D, Poon C, Lu K, He C, Lin W. Self-Assembled Nanoscale Coordination Polymers with Trigger Release Properties for Effective Anticancer Therapy. Nat Commun. 2014;5:4182. doi: 10.1038/ncomms5182. [DOI] [PMC free article] [PubMed] [Google Scholar]
- 45.Wang D, Stockard CR, Harkins L, Lott P, Salih C, Yuan K, Buchsbaum D, Hashim A, Zayzafoon M, Hardy RW, et al. Immunohistochemistry in the Evaluation of Neovascularization in Tumor Xenografts. Biotech Histochem. 2008;83:179–189. doi: 10.1080/10520290802451085. [DOI] [PMC free article] [PubMed] [Google Scholar]
- 46.Grant DS, Williams TL, Zahaczewsky M, Dicker AP. Comparison of Antiangiogenic Activities Using Paclitaxel (Taxol) and Docetaxel (Taxotere) Int J Cancer. 2003;104:121–129. doi: 10.1002/ijc.10907. [DOI] [PubMed] [Google Scholar]
- 47.Haimovitz-Friedman A, Kan CC, Ehleiter D, Persaud RS, McLoughlin M, Fuks Z, Kolesnick RN. Ionizing Radiation Acts on Cellular Membranes to Generate Ceramide and Initiate Apoptosis. J Exp Med. 1994;180:525–535. doi: 10.1084/jem.180.2.525. [DOI] [PMC free article] [PubMed] [Google Scholar]
- 48.Kuo LJ, Yang LX. Gamma-H2ax - a Novel Biomarker for DNA Double-Strand Breaks. In Vivo. 2008;22:305–309. [PubMed] [Google Scholar]
- 49.Werner ME, Copp JA, Karve S, Cummings ND, Sukumar R, Li C, Napier ME, Chen RC, Cox AD, Wang AZ. Folate-Targeted Polymeric Nanoparticle Formulation of Docetaxel Is an Effective Molecularly Targeted Radiosensitizer with Efficacy Dependent on the Timing of Radiotherapy. ACS Nano. 2011;5:8990–8998. doi: 10.1021/nn203165z. [DOI] [PMC free article] [PubMed] [Google Scholar]
- 50.Lomax MW, Folkes LK, O’Neill P. Biological Consequences of Radiation-Induced DNA Damage: Relevance to Radiotherapy. Clin Oncol (R Coll Radiol) 2013;25:578–585. doi: 10.1016/j.clon.2013.06.007. [DOI] [PubMed] [Google Scholar]
- 51.Porter AG, Jänicke RU. Emerging Roles of Caspase-3 in Apoptosis. Cell Death Differ. 1999;6:99–104. doi: 10.1038/sj.cdd.4400476. [DOI] [PubMed] [Google Scholar]
- 52.Watters D. Molecular Mechanisms of Ionizing Radiation-Induced Apoptosis. Immunol Cell Biol. 1999;77:263–271. doi: 10.1046/j.1440-1711.1999.00824.x. [DOI] [PubMed] [Google Scholar]
Associated Data
This section collects any data citations, data availability statements, or supplementary materials included in this article.