Abstract
The US egg industry is exploring alternative housing systems for laying hens. However, limited published research related to cage-free aviary systems and enriched colony cages exists related to production, egg quality, and hen nutrition. The laying hen's nutritional requirements and resulting productivity are well established with the conventional cage system, but diminutive research is available in regards to alternative housing systems. The restrictions exist with limited availability of alternative housing systems in research settings and the considerable expense for increased bird numbers in a replicate due to alternative housing system design. Therefore, the objective of the current study was to evaluate the impact of nutrient and energy intake on production and egg quality parameters from laying hens housed at a commercial facility. Lohmann LSL laying hens were housed in three systems: enriched colony cage, cage-free aviary, and conventional cage at a single commercial facility. Daily production records were collected along with dietary changes during 15 production periods (28-d each). Eggs were analyzed for shell strength, shell thickness, Haugh unit, vitelline membrane properties, and egg solids each period. An analysis of covariance (ANCOVA) coupled with a principal components analysis (PCA) approach was utilized to assess the impact of nutritional changes on production parameters and monitored egg quality factors. The traits of hen-day production and mortality had a response only in the PCA 2 direction. This finds that as house temperature and Met intake increases, there is an inflection point at which hen-day egg production is negatively effected. Dietary changes more directly influenced shell parameters, vitelline membrane parameters, and egg total solids as opposed to laying hen housing system. Therefore, further research needs to be conducted in controlled research settings on laying hen nutrient and energy intake in the alternative housing systems and resulting impact on egg quality measures.
Keywords: enriched colony cage, cage-free aviary, nutrition, conventional cage, egg quality
INTRODUCTION
Traditionally, laying hens in the United States have been housed in conventional cages and extensive years of research have explored the nutrition, management, egg quality, and safety aspects of the conventional cage system. The alternative housing systems, enriched colony cages and cage-free aviaries (aviary), have limited published research conducted within North America related to production, egg quality, and nutrition (Holt et al., 2011; Lay et al., 2011). A plethora of research populated in Europe has examined the enriched colony cage and cage-free aviary; however, differences in housing system management, bird genetics, and egg holding methodology limit the applicability of the results to the US system (Abrahamsson and Tauson, 1998; Wall and Tauson, 2002; Guesdon and Faure, 2004; Van Den Brand et al., 2004; Vits et al., 2005; Hidalgo et al., 2008; Wall, 2011).
Laying hen research conducted in a controlled setting allows for the subtle nuances related to the specific parameter to be fully explored. This has been the approach related to laying hens in the conventional cage focusing on nutritional requirements and impact on hen productivity and egg quality (Keshavarz and Nakajima, 1993; Latshaw and Zhao, 2011; Mejia et al., 2011; Anderson, 2012). However, the real-world applicability is achieved through commercial scale research. This approach relinquishes control over more variables, e.g., dietary formulation, feeding regimen, lighting program, and hen management; but allows for commercial application and assessment of the controlled research findings.
The laying hens’ nutrient requirements are well known in the conventional cage, but limited research has been conducted in enriched colony cages and aviary systems (Wahlström et al., 1999; Hetland et al., 2003; Hetland et al., 2004; Valkonen et al., 2006, 2008; Mertens et al., 2006; Neijat et al., 2011a,b). A few studies have evaluated the production impact of different systems where the focus was just the production (Abrahamsson and Tauson, 1998), production influenced by nutrition (Tactacan et al., 2009; Valkonen et al., 2010), or nutrition, production, and egg quality (Valkonen et al., 2006, 2008, 2010). The findings were contradictory preventing the development of concise management recommendations for alternative housing systems. Jones et al. (2014) reported differences between egg weight, albumen height, Haugh unit, and static compression shell strength in eggs from a commercial facility with hens housed in conventional cages, enriched colony cages, and cage-free aviaries. The differences observed were not germane to a single housing system and were the result of extended cold storage. Therefore, the objective of the current study was to evaluate the impact of nutrient and energy intake on production and egg quality parameters from laying hens housed in commercial conventional cages, enriched colony cages, and cage-free aviary systems.
MATERIALS AND METHODS
Birds and Diets
The experimental protocol was approved by the Michigan State University Institutional Animal Care and Use Committee. A detailed description of the housing systems and management practices is found in Jones et al. (2014). Briefly, Lohmann LSL White laying hens were housed at a commercial egg facility located in the Midwest United States from April 2011 to May 2012. Same age laying hens were housed in three different housing systems (conventional cage, cage-free aviary (aviary), and enriched colony cage) at 19 wk of age and depopulated at 77 wk of age. Production data including cases of eggs produced, feed intake/usage, water use, mortality, feed efficiency, house temperature, etc. (14 production parameters in total), of the flock in the test houses were provided by the producer from the commercial facility for each of 15 periods (a period consisted of 28 d). The commercial facility formulated all diets based on hen productivity and feed ingredient availability using least cost formulation. Tables 1 to 3 summarize the formulated nutrient specifications for the various diets fed during the production phase in the three different housing systems.
Table 1.
Changes in calculated nutrient and energy intake (g/100/hens/day) for laying hens housed in conventional cages at a commercial facility over 15 production periods.
| Calculated Nutrient and Energy Intake (g/100/hens/day) | |||||||||||||
|---|---|---|---|---|---|---|---|---|---|---|---|---|---|
| Production Period1 | Week2 | Protein | Fat | Crude Fiber | Ca | P | aP3 | Na | Cl | ME, kcal/kg | Lys | Met | Met/Cys |
| 1 | 20 | 809.20 | 251.31 | 98.36 | 160.21 | 25.79 | 20.86 | 8.18 | 8.00 | 12563.63 | 42.27 | 19.95 | 32.89 |
| 1 | 21 | 1367.32 | 530.11 | 157.35 | 341.85 | 44.33 | 36.60 | 15.20 | 15.24 | 21034.52 | 72.50 | 36.95 | 58.38 |
| 1 | 22 | 1454.61 | 611.91 | 161.99 | 373.88 | 47.85 | 39.95 | 16.57 | 16.76 | 22084.33 | 77.72 | 40.05 | 62.55 |
| 2 | 23 | 1817.03 | 741.38 | 204.21 | 455.23 | 58.42 | 48.40 | 20.27 | 20.94 | 27717.58 | 97.30 | 50.10 | 78.38 |
| 2 | 24 | 1862.22 | 720.60 | 212.85 | 455.33 | 58.82 | 48.31 | 20.32 | 21.15 | 28689.84 | 99.18 | 50.72 | 79.99 |
| 2 | 25 | 1848.84 | 633.10 | 219.13 | 447.44 | 58.17 | 47.37 | 19.90 | 21.05 | 29203.42 | 96.46 | 48.36 | 77.92 |
| 2 | 26 | 1766.17 | 519.49 | 217.37 | 425.82 | 55.00 | 44.41 | 19.33 | 21.31 | 28795.01 | 91.32 | 44.91 | 73.70 |
| 3 | 27 | 1662.73 | 436.56 | 209.96 | 399.89 | 51.67 | 41.51 | 19.45 | 21.87 | 27748.69 | 85.24 | 41.41 | 68.89 |
| 3 | 28 | 1760.60 | 462.25 | 222.32 | 423.42 | 54.71 | 43.95 | 20.59 | 23.15 | 29381.85 | 90.26 | 43.85 | 72.94 |
| 3 | 29 | 1840.02 | 481.19 | 238.41 | 441.41 | 57.17 | 45.71 | 20.81 | 23.79 | 30977.85 | 94.32 | 45.45 | 76.20 |
| 3 | 30 | 1725.59 | 457.32 | 251.61 | 410.52 | 54.52 | 42.52 | 17.71 | 20.63 | 29689.71 | 88.67 | 42.16 | 71.60 |
| 4 | 31 | 1397.70 | 382.01 | 218.05 | 331.72 | 45.13 | 34.65 | 14.28 | 15.97 | 24024.72 | 72.09 | 34.65 | 58.23 |
| 4 | 32 | 1710.84 | 460.34 | 256.10 | 406.89 | 54.58 | 42.47 | 18.16 | 20.23 | 29091.16 | 88.10 | 42.38 | 71.07 |
| 4 | 33 | 1715.85 | 444.33 | 230.99 | 410.13 | 53.14 | 42.73 | 19.83 | 21.91 | 28418.90 | 88.03 | 42.43 | 70.78 |
| 4 | 34 | 1655.06 | 431.85 | 227.67 | 395.21 | 51.55 | 41.19 | 18.82 | 20.83 | 27554.40 | 84.98 | 40.94 | 68.37 |
| 5 | 35 | 1758.68 | 489.46 | 271.00 | 417.55 | 56.89 | 43.64 | 19.26 | 23.10 | 30260.99 | 90.78 | 43.76 | 73.39 |
| 5 | 36 | 1691.72 | 477.17 | 258.25 | 401.77 | 54.81 | 42.00 | 19.46 | 24.38 | 29131.58 | 87.38 | 42.21 | 70.68 |
| 5 | 37 | 1746.04 | 492.49 | 266.55 | 414.68 | 56.57 | 43.35 | 20.09 | 25.16 | 30066.96 | 90.19 | 43.56 | 72.95 |
| 5 | 38 | 1765.62 | 498.02 | 269.54 | 419.33 | 57.20 | 43.84 | 20.31 | 25.45 | 30404.25 | 91.20 | 44.05 | 73.77 |
| 6 | 39 | 1761.18 | 496.77 | 268.86 | 418.27 | 57.06 | 43.73 | 20.26 | 25.38 | 30327.83 | 90.97 | 43.94 | 73.59 |
| 6 | 40 | 1747.46 | 505.34 | 267.91 | 426.34 | 56.63 | 44.00 | 20.09 | 24.60 | 30121.15 | 89.89 | 42.30 | 71.78 |
| 6 | 41 | 1705.04 | 506.62 | 258.37 | 419.46 | 54.56 | 42.86 | 19.67 | 23.12 | 29385.60 | 86.70 | 39.58 | 68.41 |
| 6 | 42 | 1721.20 | 529.86 | 263.15 | 422.61 | 54.70 | 43.05 | 20.50 | 24.71 | 30475.22 | 87.50 | 39.70 | 69.05 |
| 7 | 43 | 1801.36 | 554.53 | 275.40 | 442.29 | 57.25 | 45.05 | 21.45 | 25.86 | 31894.47 | 91.58 | 41.55 | 72.27 |
| 7 | 44 | 1764.48 | 543.18 | 269.76 | 433.24 | 56.08 | 44.13 | 21.01 | 25.33 | 31241.43 | 89.70 | 40.70 | 70.79 |
| 7 | 45 | 1788.68 | 547.62 | 272.54 | 439.86 | 56.99 | 44.88 | 21.21 | 25.46 | 31512.06 | 90.99 | 41.40 | 71.81 |
| 7 | 46 | 1657.49 | 513.27 | 252.00 | 455.63 | 52.90 | 52.02 | 19.89 | 24.05 | 29396.75 | 84.45 | 38.53 | 66.65 |
| 8 | 47 | 1711.14 | 529.89 | 260.16 | 466.75 | 54.61 | 52.57 | 20.53 | 24.83 | 30348.23 | 87.19 | 39.78 | 68.80 |
| 8 | 48 | 1738.96 | 538.50 | 264.39 | 455.61 | 55.50 | 47.81 | 20.87 | 25.24 | 30841.67 | 88.60 | 40.42 | 69.92 |
| 8 | 49 | 1736.72 | 537.81 | 264.05 | 436.66 | 55.43 | 44.36 | 20.84 | 25.20 | 30801.98 | 88.49 | 40.37 | 69.83 |
| 8 | 50 | 1726.67 | 533.14 | 280.25 | 420.81 | 56.37 | 43.07 | 20.51 | 25.21 | 30445.50 | 87.72 | 39.80 | 69.37 |
| 9 | 51 | 1690.66 | 521.41 | 281.28 | 410.14 | 55.69 | 42.00 | 20.00 | 24.74 | 29741.20 | 85.80 | 38.85 | 67.90 |
| 9 | 52 | 1733.08 | 529.29 | 279.70 | 423.12 | 56.76 | 43.32 | 20.32 | 24.86 | 30276.62 | 88.15 | 40.11 | 69.69 |
| 9 | 53 | 1808.94 | 539.31 | 270.09 | 448.44 | 58.43 | 45.87 | 20.75 | 24.68 | 31068.20 | 92.51 | 42.59 | 72.96 |
| 9 | 54 | 1928.05 | 480.13 | 281.35 | 449.52 | 58.23 | 45.23 | 21.22 | 23.88 | 31558.43 | 92.27 | 40.12 | 72.60 |
| 10 | 55 | 1922.06 | 443.00 | 278.02 | 437.41 | 56.52 | 43.71 | 20.81 | 22.89 | 30875.04 | 89.61 | 38.01 | 70.44 |
| 10 | 56 | 1942.71 | 447.76 | 281.01 | 442.11 | 57.13 | 44.18 | 21.04 | 23.14 | 31206.74 | 90.57 | 38.42 | 71.19 |
| 10 | 57 | 1957.21 | 451.10 | 283.11 | 445.41 | 57.56 | 44.51 | 21.19 | 23.31 | 31439.53 | 91.25 | 38.71 | 71.72 |
| 10 | 58 | 1835.51 | 453.64 | 267.17 | 443.55 | 56.44 | 44.30 | 20.43 | 23.74 | 31234.64 | 90.24 | 39.80 | 70.90 |
| 11 | 59 | 1743.12 | 454.99 | 255.05 | 441.65 | 55.55 | 44.09 | 19.84 | 24.03 | 31045.43 | 89.39 | 40.56 | 70.21 |
| 11 | 60 | 1757.84 | 458.83 | 257.20 | 445.38 | 56.02 | 44.46 | 20.01 | 24.23 | 31307.60 | 90.14 | 40.90 | 70.80 |
| 11 | 61 | 1761.78 | 459.86 | 257.78 | 446.38 | 56.15 | 44.56 | 20.05 | 24.29 | 31377.72 | 90.34 | 40.99 | 70.96 |
| 11 | 62 | 1709.86 | 446.65 | 251.07 | 433.32 | 54.46 | 43.20 | 20.25 | 25.29 | 30478.02 | 87.83 | 39.89 | 69.00 |
| 12 | 63 | 1741.54 | 455.06 | 256.08 | 441.39 | 55.45 | 43.98 | 20.95 | 26.46 | 31052.81 | 89.51 | 40.68 | 70.33 |
| 12 | 64 | 1791.79 | 468.19 | 263.47 | 472.02 | 57.05 | 49.79 | 21.55 | 27.22 | 31948.88 | 92.10 | 41.85 | 72.36 |
| 12 | 65 | 1708.30 | 453.15 | 274.67 | 490.89 | 57.27 | 56.99 | 19.36 | 23.91 | 30905.86 | 88.38 | 39.96 | 69.28 |
| 12 | 66 | 1723.14 | 471.99 | 303.63 | 479.29 | 61.54 | 51.57 | 18.32 | 22.87 | 31945.40 | 89.53 | 39.48 | 69.39 |
| 13 | 67 | 1685.21 | 461.61 | 296.95 | 452.12 | 60.19 | 45.81 | 17.91 | 22.36 | 31242.34 | 87.56 | 38.61 | 67.87 |
| 13 | 68 | 1685.22 | 461.61 | 296.95 | 448.59 | 60.19 | 45.62 | 17.91 | 22.36 | 31242.42 | 87.56 | 38.61 | 67.87 |
| 13 | 69 | 1670.21 | 457.50 | 294.30 | 444.60 | 59.65 | 45.21 | 17.75 | 22.16 | 30964.24 | 86.78 | 38.26 | 67.26 |
| 13 | 70 | 1691.07 | 458.83 | 295.73 | 448.52 | 60.25 | 45.68 | 17.83 | 22.28 | 31219.06 | 87.85 | 38.67 | 67.92 |
| 14 | 71 | 1691.58 | 457.22 | 294.93 | 448.00 | 60.21 | 45.66 | 17.77 | 22.22 | 31175.90 | 87.87 | 38.66 | 67.87 |
| 14 | 72 | 1703.17 | 460.35 | 296.95 | 451.07 | 60.62 | 45.97 | 17.90 | 22.37 | 31389.48 | 88.47 | 38.92 | 68.34 |
| 14 | 73 | 1694.57 | 458.03 | 295.45 | 448.79 | 60.31 | 45.74 | 17.80 | 22.26 | 31231.09 | 88.02 | 38.73 | 67.99 |
| 14 | 74 | 1682.16 | 465.61 | 313.57 | 441.64 | 59.65 | 43.90 | 17.41 | 22.59 | 31692.13 | 87.53 | 38.13 | 67.66 |
| 15 | 75 | 1621.54 | 457.10 | 317.61 | 422.81 | 57.33 | 41.19 | 16.59 | 22.15 | 31071.57 | 84.49 | 36.51 | 65.35 |
| 15 | 76 | 1596.79 | 450.12 | 312.76 | 416.35 | 56.46 | 40.56 | 16.33 | 21.82 | 30597.29 | 83.20 | 35.96 | 64.35 |
| 15 | 77 | 1581.22 | 445.73 | 309.71 | 412.29 | 55.91 | 40.17 | 16.17 | 21.60 | 30298.88 | 82.39 | 35.61 | 63.72 |
A production period consisted of 28 days.
Hen age.
aP - Available phosphorus.
Table 3.
Changes in calculated nutrient and energy intake (g/100/hens/day) for laying hens housed in cage-free aviary housing at a commercial facility over 15 production periods.
| Calculated Nutrient and Energy Intake (g/100/hens/day) | |||||||||||||
|---|---|---|---|---|---|---|---|---|---|---|---|---|---|
| Production Period1 | Week2 | Protein | Fat | Crude Fiber | Ca | P | aP3 | Na | Cl | ME, kcal/kg | Lys | Met | Met/Cys |
| 1 | 20 | 1141.46 | 366.20 | 136.97 | 227.01 | 36.27 | 29.44 | 11.53 | 11.47 | 17747.04 | 59.51 | 28.16 | 46.33 |
| 1 | 21 | 1652.60 | 634.07 | 190.09 | 403.82 | 52.26 | 42.91 | 17.99 | 18.42 | 25572.13 | 87.67 | 44.74 | 70.68 |
| 1 | 22 | 1938.26 | 729.64 | 223.97 | 472.12 | 61.27 | 50.23 | 21.07 | 21.72 | 30078.38 | 102.46 | 52.12 | 82.66 |
| 2 | 23 | 1701.25 | 526.72 | 207.58 | 414.88 | 53.06 | 42.96 | 18.10 | 19.53 | 27473.79 | 88.31 | 43.63 | 71.16 |
| 2 | 24 | 1803.72 | 538.43 | 222.76 | 437.60 | 56.22 | 45.40 | 19.13 | 20.58 | 29384.02 | 93.32 | 45.85 | 75.24 |
| 2 | 25 | 1775.27 | 478.79 | 226.08 | 424.90 | 55.23 | 44.29 | 18.68 | 19.92 | 29573.48 | 91.05 | 44.08 | 73.50 |
| 2 | 26 | 1755.15 | 467.99 | 222.71 | 420.95 | 54.58 | 43.80 | 19.35 | 21.15 | 29260.90 | 90.00 | 43.64 | 72.69 |
| 3 | 27 | 1683.22 | 441.94 | 212.55 | 404.82 | 52.30 | 42.02 | 19.69 | 22.14 | 28090.59 | 86.29 | 41.92 | 69.74 |
| 3 | 28 | 1769.98 | 460.98 | 235.31 | 423.52 | 55.00 | 43.75 | 19.31 | 22.49 | 30064.94 | 90.71 | 43.35 | 73.27 |
| 3 | 29 | 1650.27 | 428.91 | 222.22 | 394.36 | 51.28 | 40.69 | 17.67 | 20.78 | 28157.70 | 84.57 | 40.24 | 68.30 |
| 3 | 30 | 1758.84 | 459.07 | 228.41 | 421.88 | 54.57 | 43.86 | 20.47 | 22.84 | 29257.20 | 90.20 | 43.67 | 72.74 |
| 4 | 31 | 1686.41 | 436.70 | 227.02 | 403.09 | 52.23 | 41.99 | 19.49 | 21.53 | 27931.31 | 86.52 | 41.70 | 69.57 |
| 4 | 32 | 1801.26 | 466.45 | 242.49 | 430.54 | 55.78 | 44.85 | 20.81 | 23.00 | 29833.63 | 92.42 | 44.54 | 74.31 |
| 4 | 33 | 1778.60 | 460.58 | 239.44 | 425.13 | 55.08 | 44.29 | 20.55 | 22.71 | 29458.30 | 91.25 | 43.98 | 73.37 |
| 4 | 34 | 1778.22 | 460.48 | 239.38 | 425.03 | 55.07 | 44.28 | 20.55 | 22.71 | 29451.87 | 91.23 | 43.97 | 73.36 |
| 5 | 35 | 1787.32 | 478.45 | 248.59 | 426.32 | 56.10 | 44.42 | 20.63 | 24.27 | 29925.15 | 91.86 | 44.38 | 74.04 |
| 5 | 36 | 1752.84 | 494.41 | 267.59 | 416.29 | 56.79 | 43.52 | 20.17 | 25.26 | 30184.21 | 90.54 | 43.73 | 73.24 |
| 5 | 37 | 1774.21 | 500.44 | 270.85 | 421.37 | 57.48 | 44.05 | 20.41 | 25.57 | 30552.17 | 91.64 | 44.26 | 74.13 |
| 5 | 38 | 1753.90 | 494.71 | 267.75 | 416.54 | 56.82 | 43.54 | 20.18 | 25.28 | 30202.47 | 90.59 | 43.76 | 73.28 |
| 6 | 39 | 1718.54 | 484.74 | 262.35 | 408.15 | 55.68 | 42.67 | 19.77 | 24.77 | 29593.53 | 88.77 | 42.88 | 71.81 |
| 6 | 40 | 1721.31 | 497.78 | 263.90 | 419.95 | 55.78 | 43.34 | 19.79 | 24.23 | 29670.25 | 88.54 | 41.67 | 70.70 |
| 6 | 41 | 1813.74 | 538.92 | 274.84 | 446.20 | 58.04 | 45.60 | 20.93 | 24.59 | 31259.11 | 92.23 | 42.10 | 72.77 |
| 6 | 42 | 1749.85 | 538.68 | 267.53 | 429.65 | 55.61 | 43.77 | 20.84 | 25.12 | 30982.43 | 88.96 | 40.37 | 70.20 |
| 7 | 43 | 1731.57 | 518.12 | 262.85 | 425.82 | 55.34 | 43.49 | 20.10 | 23.75 | 30001.93 | 88.05 | 40.15 | 69.47 |
| 7 | 44 | 1761.70 | 516.23 | 266.04 | 433.72 | 56.53 | 44.38 | 20.07 | 23.35 | 30044.43 | 89.60 | 40.99 | 70.68 |
| 7 | 45 | 1712.78 | 503.84 | 258.57 | 422.81 | 55.04 | 43.23 | 19.57 | 22.82 | 29293.11 | 87.22 | 39.99 | 68.84 |
| 7 | 46 | 1784.14 | 529.92 | 269.12 | 443.42 | 57.56 | 45.25 | 20.52 | 24.08 | 30731.33 | 91.15 | 42.01 | 72.03 |
| 8 | 47 | 1790.15 | 544.44 | 271.23 | 442.89 | 57.41 | 45.23 | 21.09 | 25.18 | 31349.14 | 91.32 | 41.85 | 72.11 |
| 8 | 48 | 1786.78 | 553.31 | 271.66 | 440.49 | 57.03 | 45.01 | 21.44 | 25.93 | 31689.90 | 91.04 | 41.53 | 71.84 |
| 8 | 49 | 1771.83 | 560.35 | 286.89 | 437.52 | 57.77 | 44.73 | 20.87 | 25.60 | 31824.58 | 90.03 | 40.64 | 70.98 |
| 8 | 50 | 1828.40 | 585.33 | 328.92 | 448.21 | 62.07 | 45.90 | 21.06 | 26.38 | 32914.61 | 92.03 | 41.10 | 72.91 |
| 9 | 51 | 1744.73 | 557.69 | 321.00 | 426.24 | 59.79 | 43.67 | 20.04 | 25.19 | 31315.53 | 87.56 | 39.08 | 69.53 |
| 9 | 52 | 1750.73 | 559.61 | 322.10 | 427.71 | 59.99 | 43.82 | 20.11 | 25.28 | 31423.36 | 87.86 | 39.21 | 69.77 |
| 9 | 53 | 1791.05 | 572.50 | 329.52 | 437.56 | 61.38 | 44.82 | 20.57 | 25.86 | 32146.89 | 89.88 | 40.11 | 71.38 |
| 9 | 54 | 1875.74 | 510.06 | 301.09 | 435.31 | 58.82 | 44.60 | 20.44 | 23.87 | 31938.03 | 89.69 | 38.42 | 70.65 |
| 10 | 55 | 1913.13 | 457.67 | 276.33 | 427.96 | 56.19 | 43.85 | 20.07 | 22.09 | 31366.33 | 88.37 | 36.67 | 69.20 |
| 10 | 56 | 1917.82 | 458.80 | 277.01 | 429.00 | 56.32 | 43.96 | 20.12 | 22.15 | 31443.18 | 88.59 | 36.76 | 69.36 |
| 10 | 57 | 1944.61 | 471.48 | 282.80 | 439.57 | 57.57 | 45.00 | 20.62 | 22.87 | 32269.42 | 90.58 | 37.89 | 71.00 |
| 10 | 58 | 1749.08 | 471.77 | 269.78 | 432.16 | 56.15 | 44.13 | 20.27 | 24.77 | 32048.08 | 88.15 | 39.10 | 69.34 |
| 11 | 59 | 1690.79 | 471.38 | 269.70 | 431.73 | 54.86 | 42.76 | 19.60 | 24.90 | 32037.91 | 86.37 | 37.76 | 67.29 |
| 11 | 60 | 1645.49 | 466.99 | 267.94 | 427.67 | 53.32 | 41.33 | 18.93 | 24.42 | 31748.29 | 84.23 | 36.29 | 65.19 |
| 11 | 61 | 1664.36 | 472.34 | 271.01 | 432.57 | 53.93 | 41.81 | 19.15 | 24.70 | 32112.22 | 85.20 | 36.71 | 65.94 |
| 11 | 62 | 1609.43 | 457.18 | 263.07 | 418.56 | 52.32 | 40.59 | 18.60 | 24.59 | 31058.11 | 82.80 | 35.58 | 63.78 |
| 12 | 63 | 1670.51 | 474.70 | 273.47 | 434.55 | 54.38 | 42.20 | 19.34 | 25.82 | 32239.13 | 86.11 | 36.97 | 66.21 |
| 12 | 64 | 1662.07 | 472.31 | 272.09 | 432.35 | 54.10 | 41.99 | 19.24 | 25.69 | 32076.35 | 85.68 | 36.78 | 65.87 |
| 12 | 65 | 1613.67 | 462.68 | 284.34 | 424.49 | 55.53 | 42.15 | 17.52 | 23.33 | 31421.25 | 83.68 | 36.29 | 64.66 |
| 12 | 66 | 1638.66 | 456.86 | 285.55 | 433.70 | 57.72 | 43.94 | 17.08 | 21.90 | 31202.86 | 85.33 | 37.38 | 65.92 |
| 13 | 67 | 1698.43 | 461.60 | 282.09 | 448.77 | 59.09 | 45.60 | 17.84 | 22.30 | 31661.69 | 88.42 | 38.80 | 68.12 |
| 13 | 68 | 1716.67 | 466.55 | 285.12 | 487.79 | 59.73 | 54.46 | 18.03 | 22.54 | 32001.79 | 89.37 | 39.22 | 68.86 |
| 13 | 69 | 1748.05 | 475.08 | 290.33 | 503.15 | 60.82 | 57.26 | 18.36 | 22.95 | 32586.70 | 91.00 | 39.93 | 70.11 |
| 13 | 70 | 1778.30 | 481.42 | 305.85 | 496.96 | 62.89 | 54.76 | 18.68 | 23.35 | 32881.82 | 92.43 | 40.64 | 71.34 |
| 14 | 71 | 1672.73 | 469.80 | 303.32 | 453.74 | 59.40 | 47.63 | 17.31 | 22.68 | 32154.85 | 87.16 | 38.05 | 67.41 |
| 14 | 72 | 1615.99 | 461.04 | 297.77 | 426.47 | 57.32 | 42.71 | 16.62 | 22.19 | 31602.78 | 84.31 | 36.69 | 65.24 |
| 14 | 73 | 1619.57 | 462.06 | 298.43 | 427.41 | 57.45 | 42.81 | 16.65 | 22.24 | 31672.77 | 84.50 | 36.77 | 65.39 |
| 14 | 74 | 1670.06 | 462.56 | 289.07 | 442.55 | 58.63 | 44.66 | 17.34 | 22.30 | 31791.93 | 86.97 | 38.09 | 67.17 |
| 15 | 75 | 1689.39 | 457.86 | 278.92 | 448.98 | 58.87 | 45.54 | 17.66 | 22.10 | 31532.36 | 87.86 | 38.66 | 67.76 |
| 15 | 76 | 1696.51 | 463.59 | 282.58 | 455.84 | 58.79 | 45.36 | 17.95 | 22.46 | 32010.22 | 88.39 | 38.18 | 67.51 |
| 15 | 77 | 1640.13 | 457.70 | 279.43 | 453.12 | 56.00 | 42.92 | 17.88 | 22.35 | 31810.42 | 85.84 | 35.32 | 63.93 |
A production period consisted of 28 days.
Hen age.
aP - Available phosphorus.
Table 2.
Changes in calculated nutrient and energy intake (g/100/hens/day) for laying hens housed in enriched colony cages at a commercial facility over 15 production periods.
| Calculated Nutrient and Energy Intake (g/100/hens/day) | |||||||||||||
|---|---|---|---|---|---|---|---|---|---|---|---|---|---|
| Production Period1 | Week2 | Protein | Fat | Crude Fiber | Ca | P | aP3 | Na | Cl | ME, kcal/kg | Lys | Met | Met/Cys |
| 1 | 20 | 847.46 | 263.19 | 103.01 | 167.79 | 27.01 | 21.85 | 8.57 | 8.38 | 13157.64 | 44.27 | 20.90 | 34.44 |
| 1 | 21 | 1028.05 | 398.58 | 118.31 | 257.03 | 33.33 | 27.52 | 11.43 | 11.46 | 15815.30 | 54.51 | 27.78 | 43.89 |
| 1 | 22 | 1440.67 | 606.05 | 160.44 | 370.30 | 47.39 | 39.57 | 16.42 | 16.60 | 21872.75 | 76.98 | 39.67 | 61.95 |
| 2 | 23 | 1632.62 | 680.22 | 182.20 | 416.79 | 53.40 | 44.50 | 18.55 | 19.08 | 24817.69 | 87.27 | 45.00 | 70.29 |
| 2 | 24 | 1869.31 | 700.97 | 216.05 | 458.43 | 58.85 | 48.24 | 20.31 | 21.30 | 29041.92 | 99.40 | 50.57 | 80.08 |
| 2 | 25 | 1833.49 | 567.67 | 223.72 | 447.13 | 57.19 | 46.30 | 19.51 | 21.05 | 29609.35 | 95.18 | 47.02 | 76.70 |
| 2 | 26 | 1796.74 | 532.79 | 221.36 | 436.49 | 55.98 | 45.23 | 19.64 | 21.46 | 29285.19 | 92.95 | 45.71 | 74.96 |
| 3 | 27 | 1689.11 | 443.48 | 213.29 | 406.23 | 52.49 | 42.17 | 19.76 | 22.21 | 28188.91 | 86.59 | 42.07 | 69.98 |
| 3 | 28 | 1886.63 | 474.93 | 258.67 | 450.41 | 59.88 | 47.00 | 20.51 | 23.64 | 32037.23 | 97.16 | 46.89 | 78.39 |
| 3 | 29 | 1749.39 | 425.62 | 254.63 | 415.25 | 56.43 | 43.52 | 17.89 | 21.07 | 30105.98 | 90.42 | 43.41 | 72.84 |
| 3 | 30 | 1707.78 | 437.48 | 256.23 | 405.34 | 55.11 | 42.42 | 17.46 | 20.12 | 29374.81 | 88.19 | 42.36 | 71.13 |
| 4 | 31 | 1735.64 | 474.37 | 270.77 | 411.92 | 56.04 | 43.03 | 17.74 | 19.84 | 29833.44 | 89.52 | 43.03 | 72.31 |
| 4 | 32 | 1747.75 | 477.68 | 272.66 | 414.80 | 56.43 | 43.33 | 17.86 | 19.97 | 30041.69 | 90.15 | 43.33 | 72.81 |
| 4 | 33 | 1513.50 | 407.24 | 226.56 | 359.96 | 48.28 | 37.57 | 16.06 | 17.90 | 25735.44 | 77.94 | 37.49 | 62.87 |
| 4 | 34 | 1765.94 | 457.30 | 237.73 | 422.10 | 54.69 | 43.98 | 20.41 | 22.55 | 29248.62 | 90.60 | 43.67 | 72.85 |
| 5 | 35 | 1752.85 | 471.29 | 243.34 | 418.03 | 55.04 | 43.54 | 20.24 | 24.11 | 29346.99 | 90.09 | 43.56 | 72.64 |
| 5 | 36 | 1726.53 | 486.99 | 263.57 | 410.04 | 55.93 | 42.87 | 19.86 | 24.88 | 29731.02 | 89.18 | 43.07 | 72.14 |
| 5 | 37 | 1727.78 | 487.34 | 263.76 | 410.34 | 55.97 | 42.90 | 19.88 | 24.90 | 29752.59 | 89.25 | 43.11 | 72.19 |
| 5 | 38 | 1716.26 | 492.53 | 257.10 | 413.67 | 55.80 | 43.27 | 19.73 | 24.18 | 29322.91 | 88.14 | 43.05 | 71.79 |
| 6 | 39 | 1826.95 | 515.32 | 278.90 | 433.89 | 59.19 | 45.36 | 21.02 | 26.33 | 31460.38 | 94.37 | 45.58 | 76.34 |
| 6 | 40 | 1829.59 | 529.09 | 280.50 | 446.37 | 59.29 | 46.07 | 21.04 | 25.76 | 31536.69 | 94.11 | 44.29 | 75.15 |
| 6 | 41 | 1818.51 | 540.33 | 275.56 | 447.37 | 58.19 | 45.72 | 20.98 | 24.66 | 31341.24 | 92.47 | 42.21 | 72.96 |
| 6 | 42 | 1820.46 | 560.41 | 278.32 | 446.98 | 57.86 | 45.53 | 21.68 | 26.13 | 32232.60 | 92.55 | 41.99 | 73.03 |
| 7 | 43 | 1841.60 | 578.98 | 299.74 | 453.12 | 59.91 | 46.28 | 21.72 | 26.50 | 33008.63 | 93.07 | 41.90 | 73.59 |
| 7 | 44 | 1775.20 | 567.09 | 302.49 | 437.49 | 58.78 | 44.77 | 20.78 | 25.60 | 32118.07 | 89.31 | 39.95 | 70.71 |
| 7 | 45 | 1633.05 | 505.37 | 260.59 | 403.04 | 53.04 | 41.16 | 19.11 | 23.07 | 28944.47 | 82.78 | 37.52 | 65.45 |
| 7 | 46 | 1717.06 | 509.99 | 259.00 | 426.74 | 55.40 | 43.55 | 19.75 | 23.18 | 29575.85 | 87.72 | 40.43 | 69.32 |
| 8 | 47 | 1866.36 | 567.62 | 282.78 | 461.75 | 59.85 | 47.16 | 21.99 | 26.26 | 32683.78 | 95.20 | 43.63 | 75.18 |
| 8 | 48 | 1803.64 | 558.53 | 274.22 | 444.65 | 57.56 | 45.44 | 21.64 | 26.18 | 31988.93 | 91.90 | 41.93 | 72.52 |
| 8 | 49 | 1793.80 | 555.48 | 272.73 | 442.22 | 57.25 | 45.19 | 21.53 | 26.03 | 31814.29 | 91.40 | 41.70 | 72.13 |
| 8 | 50 | 1819.60 | 561.83 | 295.33 | 443.45 | 59.41 | 45.39 | 21.61 | 26.56 | 32084.01 | 92.45 | 41.95 | 73.10 |
| 9 | 51 | 1761.33 | 543.21 | 293.04 | 427.28 | 58.02 | 43.76 | 20.84 | 25.77 | 30984.55 | 89.38 | 40.47 | 70.74 |
| 9 | 52 | 1796.21 | 553.96 | 298.85 | 435.74 | 59.17 | 44.63 | 21.25 | 26.28 | 31598.00 | 91.15 | 41.27 | 72.14 |
| 9 | 53 | 1822.08 | 561.94 | 303.15 | 442.02 | 60.02 | 45.27 | 21.56 | 26.66 | 32053.17 | 92.47 | 41.86 | 73.18 |
| 9 | 54 | 1950.08 | 511.31 | 299.32 | 455.71 | 60.15 | 46.02 | 21.91 | 25.39 | 32537.99 | 94.19 | 41.11 | 74.25 |
| 10 | 55 | 1984.29 | 457.34 | 287.02 | 451.57 | 58.35 | 45.12 | 21.49 | 23.64 | 31874.61 | 92.51 | 39.24 | 72.72 |
| 10 | 56 | 1993.91 | 459.56 | 288.42 | 453.76 | 58.64 | 45.34 | 21.59 | 23.75 | 32029.10 | 92.96 | 39.43 | 73.07 |
| 10 | 57 | 1968.92 | 453.80 | 284.80 | 448.07 | 57.90 | 44.77 | 21.32 | 23.45 | 31627.75 | 91.79 | 38.94 | 72.15 |
| 10 | 58 | 1989.73 | 491.76 | 289.62 | 480.82 | 61.19 | 48.02 | 22.15 | 25.73 | 33859.04 | 97.82 | 43.14 | 76.86 |
| 11 | 59 | 1839.85 | 480.23 | 269.20 | 466.16 | 58.63 | 46.53 | 20.94 | 25.36 | 32768.15 | 94.35 | 42.81 | 74.11 |
| 11 | 60 | 1820.12 | 475.09 | 266.31 | 461.16 | 58.00 | 46.04 | 20.72 | 25.09 | 32416.86 | 93.34 | 42.35 | 73.31 |
| 11 | 61 | 1839.26 | 480.08 | 269.11 | 466.01 | 58.61 | 46.52 | 20.93 | 25.35 | 32757.59 | 94.32 | 42.80 | 74.08 |
| 11 | 62 | 1793.20 | 468.42 | 263.31 | 454.44 | 57.11 | 45.31 | 21.24 | 26.52 | 31963.46 | 92.11 | 41.84 | 72.36 |
| 12 | 63 | 1800.43 | 470.45 | 264.74 | 456.32 | 57.32 | 45.47 | 21.65 | 27.35 | 32102.89 | 92.54 | 42.05 | 72.71 |
| 12 | 64 | 1789.04 | 467.47 | 263.07 | 471.29 | 56.96 | 49.71 | 21.52 | 27.18 | 31899.81 | 91.95 | 41.79 | 72.25 |
| 12 | 65 | 1772.23 | 465.08 | 285.37 | 469.94 | 59.11 | 50.09 | 19.97 | 24.01 | 31881.30 | 91.90 | 42.08 | 72.45 |
| 12 | 66 | 1758.41 | 462.25 | 293.11 | 449.74 | 59.73 | 45.53 | 19.27 | 22.65 | 31745.65 | 91.50 | 42.03 | 72.23 |
| 13 | 67 | 1766.25 | 464.31 | 294.41 | 451.75 | 59.99 | 45.73 | 19.36 | 22.75 | 31887.25 | 91.91 | 42.22 | 72.56 |
| 13 | 68 | 1765.11 | 464.01 | 294.22 | 451.46 | 59.95 | 45.70 | 19.34 | 22.74 | 31866.61 | 91.85 | 42.19 | 72.51 |
| 13 | 69 | 1743.31 | 458.28 | 290.59 | 445.88 | 59.21 | 45.14 | 19.10 | 22.46 | 31473.10 | 90.72 | 41.67 | 71.61 |
| 13 | 70 | 1790.62 | 463.20 | 297.27 | 454.41 | 60.15 | 45.88 | 19.43 | 22.78 | 32296.20 | 93.12 | 42.49 | 73.52 |
| 14 | 71 | 1775.75 | 456.37 | 294.33 | 449.22 | 59.39 | 45.31 | 19.19 | 22.48 | 32015.84 | 92.32 | 42.01 | 72.90 |
| 14 | 72 | 1814.70 | 466.38 | 300.79 | 459.07 | 60.69 | 46.30 | 19.61 | 22.98 | 32718.09 | 94.34 | 42.94 | 74.50 |
| 14 | 73 | 1777.61 | 456.85 | 294.64 | 449.69 | 59.45 | 45.36 | 19.21 | 22.51 | 32049.24 | 92.42 | 42.06 | 72.98 |
| 14 | 74 | 1754.38 | 462.52 | 310.64 | 442.45 | 60.77 | 45.80 | 18.92 | 22.99 | 32446.13 | 91.28 | 41.20 | 72.20 |
| 15 | 75 | 1682.93 | 452.49 | 313.02 | 423.39 | 59.89 | 44.72 | 18.11 | 22.64 | 31741.86 | 87.62 | 39.28 | 69.40 |
| 15 | 76 | 1663.26 | 447.20 | 309.36 | 418.45 | 59.19 | 44.19 | 17.90 | 22.38 | 31370.90 | 86.60 | 38.82 | 68.58 |
| 15 | 77 | 1670.22 | 449.07 | 310.65 | 420.19 | 59.43 | 44.38 | 17.98 | 22.47 | 31502.05 | 86.96 | 38.99 | 68.87 |
A production period consisted of 28 days.
Hen age.
aP - Available phosphorus.
Egg Quality Assessments
Eggs from each housing system were collected during periods 1 to 13 and shipped to the USDA-ARS laboratory overnight. Immediately upon arrival, eggs were stored at 4°C to equilibrate to the refrigerated temperature overnight before conducting assessments due to egg temperature impacts on egg quality measurements (Keener et al., 2006).
Each period, eggs were screened via candling to remove cracked eggs and up to 24 random eggs per housing system were selected for egg quality assessments. Eggs were removed from cold storage immediately before egg quality assessments were conducted to ensure comparable egg temperatures. Egg temperature was monitored throughout quality assessments and ranged between 7 to 9°C. Egg quality measurements were tracked for individual eggs with the exception of whole egg solids, which were conducted on six pools of 4 eggs each per housing system.
Egg quality assessments conducted each production period included: shell dynamic stiffness, static compression shell strength, egg weight, albumen height, Haugh unit, static compression vitelline membrane strength and deformation, shell thickness, and whole egg total solids. Shell thickness was determined using a shell thickness gauge (BC Ames, Inc., Melrose, MA), with three measurements made from the equatorial region of each egg. The remaining egg quality methods and sources of instrumentation are described by Jones et al. (2014).
Statistical Analysis
Analyses were divided into two parts dealing with: 1) production and mortality data and 2) egg quality data. The egg quality data were obtained monthly while the production and mortality data were obtained weekly. In comparing the different housing systems, we utilized an analysis of covariance (ANCOVA) approach using model selection and a Bayesian statistical framework as described below.
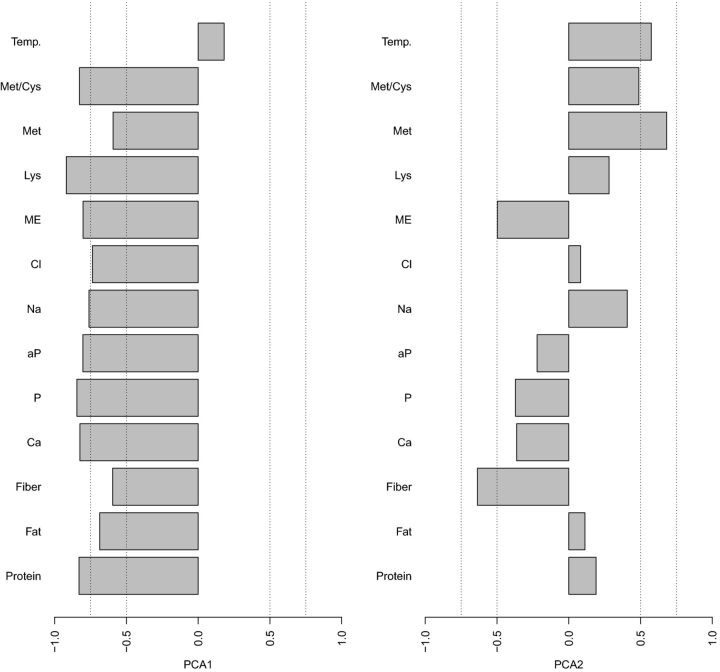
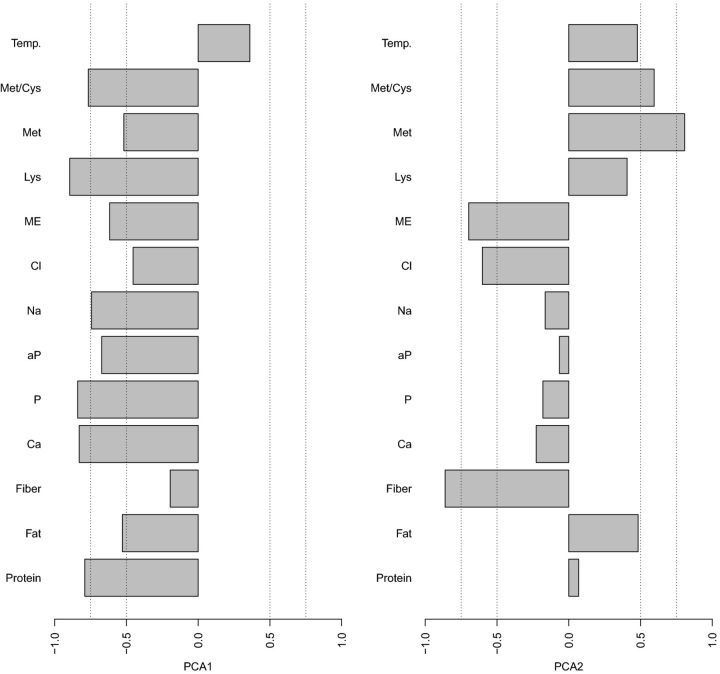
The covariates of interest in this ANCOVA analysis were nutrients consumed by laying hens in each housing system. The formulated values for each diet were multiplied by the feed intake (weighted average as weekly and monthly) per 100 hens to arrive at the nutrient and energy intake for each production period. Additionally, house temperature was added as a variable of interest for a total of thirteen covariates. To simplify the analysis we utilized a principle components analysis approach (PCA; Johnson and Wichern, 1992) to reduce the dimensionality of the problem by replacing these variables by the first two PCA's explaining about 70% of the total variability for these variables. Figures 1 and 2 illustrate the correlations for the first and second PCA modeled components for the weekly (production and mortality) and monthly (egg quality) analyses, respectively. Our model selection approach evaluated the significance of the relationship between the response variables and these PCA components to identify if one or both could explain the variability in the data. In many cases both PCAs showed significance and our presentation focused on that component that better highlighted the trends in the observed data.
Figure 1.
Correlations between weekly variables (temperature and weighted nutrient and energy intake; g/100/hens/day) associated with principle component approach (PCA) 1 and PCA 2.
Figure 2.
Correlations between monthly variables (temperature and weighted nutrient and energy intake; g/100/hens/day) associated with principle component approach (PCA) 1 and PCA 2.
This PCA analysis indicates that, on a weekly basis, the first PCA (PCA 1) forms a weighted average of all nutrient and energy intakes. The weekly PCA 1 is negatively correlated with these variables (Figure 1). PCA 2 for the weekly analysis forms a contrast between crude fiber and ME (and to a lesser extent Ca and P) and variables Met, Met/Cys, temperature, Na, and Lys. The weekly PCA 2 is negatively correlated with crude fiber, ME, Ca, and P and positively correlated with the others. This reflects that an increase in crude fiber indicates a reduction in the weekly PCA 2 and vice versa for temperature, for example. Met and Met/Cys were found to be highly correlated with one another, which is not surprising. A similar story can be observed for the monthly data with PCA 1 representing a weighted average of most nutrient and energy intake, except for crude fiber (Figure 2). A correlation analysis indicates that these variables are negatively correlated with this PCA, hence a reduction in relatedness within the PCA is associated with an increase in these variables. The monthly PCA 2 seems to show a contrast between the variables crude fiber, Cl, ME (negatively correlated to PCA 2) and variables Met, Met/Cys, temperature, Lys, and fat (positively correlated to PCA 2; Figure 2).
A Bayesian framework was used for the ANCOVA, referred to above, with PCA 1 and PCA 2 taken as the covariates. This analysis was chosen for the flexibility in comparing the different housing systems to one another at any fixed level of application of the covariates. One hundred and ninety-six models were compared that had different levels of complexity to determine a model that best described the data. This was done for each of the variables that were studied and was completed using the Deviance Information Criterion (DIC; Spiegelhalter et al., 2002). The compared models included a baseline null model that assumed no difference in behavior between the different housing systems. More complex models included linear and quadratic trends between the response variables and the covariates. The variance structure was also compared by relaxing the assumption of equality of variance for the three housing systems. The model was chosen that had the minimum DIC score as best representative of the data. Residual plots used to further assess model fit and credibility intervals were utilized to assess significance in differences between the different housing systems. All analyses were performed in R (R Core Team, 2014) and utilizing JAGS (Plummer, 2003). Table 4 reports models used for data analysis. Data was used beginning after 20 wk, as the system appears to have not been in a steady state initially, and the observed outcome might have been deceiving. Comparisons were made at predefined PCA values to simplify visualization of the results and restricting the graphs to levels that are biologically relevant. This was done to assess differences between the housing systems at different levels of nutrition and temperature.
Table 4.
Best-fit models chosen based on the maximum DIC criterion described in the text.
| Variable | Model1 | Variance |
|---|---|---|
| Production | mu[k] <− a + b*pca2[j,i] + b1[j]* pow(pca2[j,i],2) | sig.e |
| Mortality | mu[k] <− a + b*pca2[j,i] | sig.e |
| Egg Weight | mu[k] <− a + b*pca1[j,i] + b1[j]* pow(pca1[j,i],2) + c[j]*pca2[j,i] + c1*pow(pca2[j,i],2) | sig.e |
| Haugh Unit | mu[k] <− a[j] + b[j]*pca1[j,i] + b1* pow(pca1[j,i],2) + c*pca2[j,i] + c1[j]*pow(pca2[j,i],2) | sig.e[j] |
| Whole Egg Solids | mu1[j,i] <− a + b*pca1[j,i] + c[i]*pca2[j,i] + c1[i]*pow(pca2[j,i],2) | sig.e |
| Vitelline Membrane - Force | mu[k] <− a + b*pca1[j,i] + b1[j]* pow(pca1[j,i],2) + c[j]*pca2[j,i] | sig.e |
| Vitelline Membrane - Deformation | mu[k] <− a + b[j]*pca2[j,i] | sig.e |
| Shell Strength - Force | mu[k] <− a + b*pca1[j,i] + c[j]*pca2[j,i] | sig.e |
| Shell Dynamic Stiffness | mu1[j,i] <− a + b*pca1[j,i] + b1[i]* pow(pca1[j,i],2) + c[i]*pca2[j,i] | sig.e |
| Shell Thickness | mu1[j,i] <− a + b*pca1[j,i] + b1* pow(pca1[j,i],2) + c*pca2[j,i] + c1[i]*pow(pca2[j,i],2) | sig.e |
Y is the response; i, refers to the housing system (Aviary, Enriched or Conventional); j, refers to the time period (week in production or month for quality); k, l, refer to the replicate, and replicate measurement per replicate, respectively, per time period and housing system; PC1, the first principal component; PC2, the second principal component; α, intercept; αi, represents a different intercept per housing system; b, c, linear slope in association with PC1 and PC2, respectively; bi, ci variable linear slope per housing system in association with PC1 and PC2, respectively; b1, c1, regression coefficient representing the non-linear, quadratic, trend in association with PC1 and PC2, respectively; b1i, c1i, variable regression coefficient representing the non-linear, quadratic, trend per housing system in association with PC1 and PC2, respectively; σ2,  , the residual variance and its version when assumed different between housing systems; DIC, the Deviance Information Criterion used for model selection (please refer to the text).
Model Presentation and Interpretation
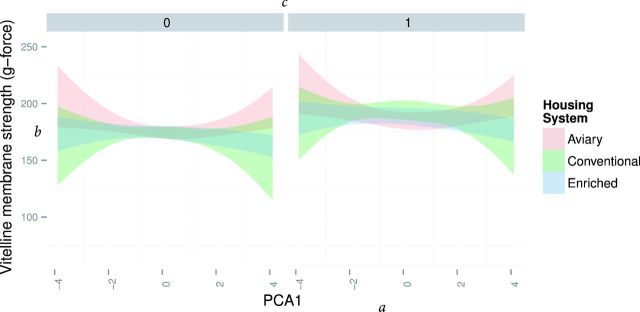
The remainder of the figures (Figures 5 to 13) will present the 95% credibility intervals as expected at each computed PCA 1 and PCA 2 value. Figure 4 is an example explaining how to interpret these figures. As reflected in figure 4, the x-axis will represent one of the PCA variables (PCA 1 or PCA 2) as indicated in the legend and figure title and the write up for each figure. In the current figure the x-axis increases from −4 to 4 for PCA 1. The y-axis will reflect the variable understudy. In many of these figures, as in Figure 4, the third dimension (PCA 2 in this case) of the plot will be represented by a number of panels with values increasing from the bottom to the top, which will be reflected in the gray headers of each panel (here the values will increase from 0 to 1). The colored bands show the model responses for the different housing systems with red representing the aviary system, green the conventional cage, and blue the enriched colony housing system and are defined by the shown legend per figure. The overlapped areas indicate no significant difference while band separation indicates significant difference in the housing system.
Figure 5.
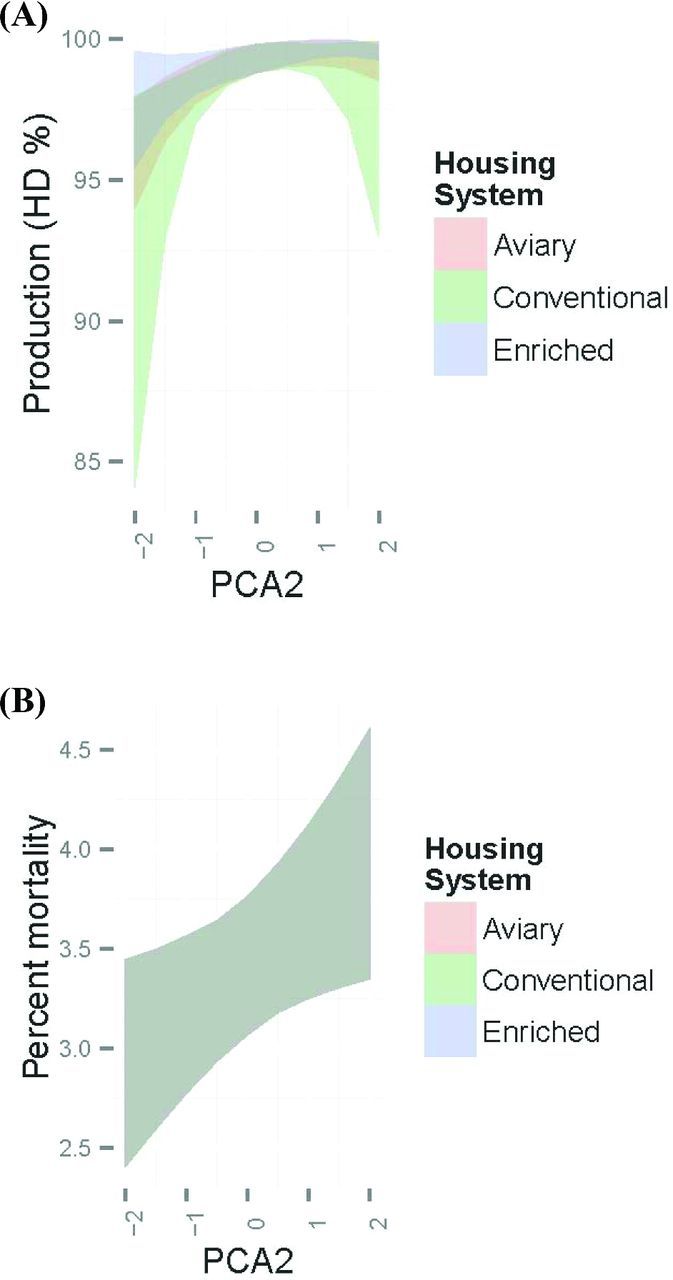
A) Hen-day egg production and B) Mortality. Weekly production data analyzed with principle component approach (PCA) evaluating nutrient and energy intake values for laying hens during the production period. The figures present the 95% credibility intervals with red (aviary), green (conventional cage), and blue (enriched colony cage) with overlapping colors indicating no significant difference.
Figure 13.
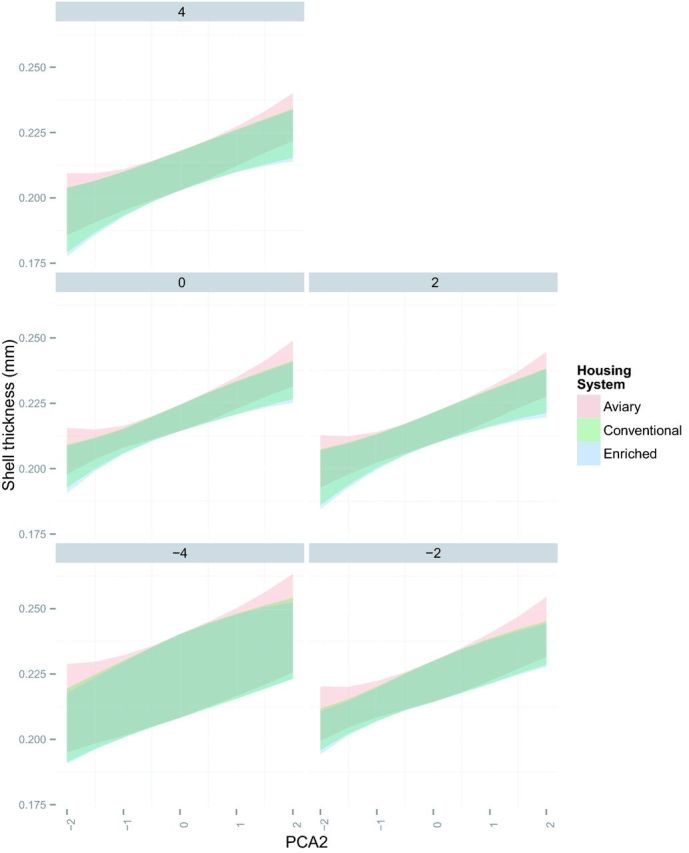
Shell thickness. Monthly egg quality data analyzed with principle component approach (PCA) evaluating nutrient and energy intake values for laying hens during the production period. The figures present the 95% credibility intervals with red (aviary), green (conventional cage), and blue (enriched colony cage) with overlapping colors indicating no significant difference.
Figure 4.
Example output of the principle component approach (PCA). a represents one of the PCA variables (PCA 1) increasing from negative to positive value along the x-axis. b represents the y-axis and variable that is being modeled. c are the gray headers above each panel with increasing value (0 to 1) to represent the third dimension (PCA 2). The colored bands (red for aviary, green for conventional, and blue for enriched) illustrate the model responses representing the 95% credibility interval. Any overlapped areas indicate no significant difference while band separation indicates significant difference in the housing system.
RESULTS AND DISCUSSION
Laying hen production performance parameters are essential to the evaluation and expression of economic and environmental impacts (e.g., air pollutant emissions per hen or per kg egg produced), and to the comparative assessment of the three housing systems. The data presented is considering the nutrient and energy intake of the laying hens in the different housing systems and assessing the impact on egg quality. Although there was only a single house of each production system, the nutrient and energy intake and the impact on the egg quality parameters can be considered.
Weekly Production and Mortality Data
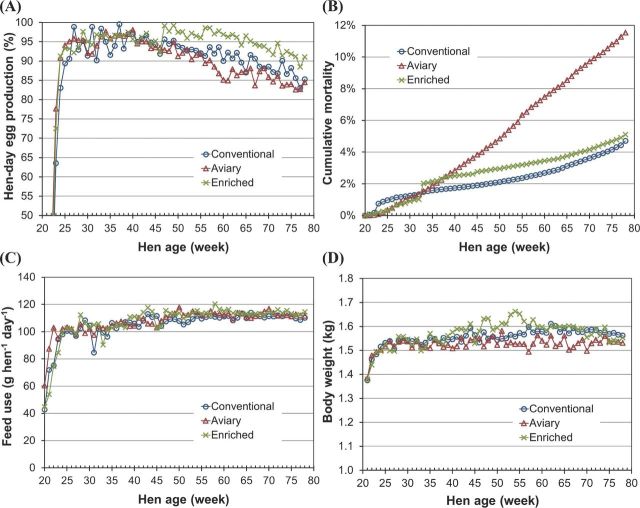
The weekly production data, including hen inventory numbers, cumulative mortality, hen-day egg production, feed use, and body weight (BW) in the three housing systems are found in Figure 3. Table 5 summarizes the means of 12 weekly production parameters as compared to the Lohmann breeder reference values for LSL white hens (Lohmann Tierzucht, 2014). The hen-day egg production was similar amongst housing systems until period 8 at which point the hens in the enriched colony cage had higher production and maintained a higher level through the end of the production period (Figure 3A, Table 5). The mortality rates were similar amongst the housing systems (Figure 3B, Table 5) until period 4 at which the aviary continued to increase rapidly compared to the other housing systems resulting in cumulative mortality being 2.5 times higher in the aviary compared to the other systems. Although the reasons attributed to the difference is unknown, the increase might be due to the learning curve of managing a new housing system and larger hen groups within the pen resulting in pecking and crowding. Figure 3C and Table 5 reveal that the feed supplied was slightly higher in the aviary but hen BW (Figure 3D, Table 5) were similar amongst the housing systems. Since the enriched colony system used feed on the forage mat, the feed might or might not have been consumed. Therefore, the increase in feed supplied might be related to factors like temperature, feed usage, or hen activity level.
Figure 3.
Commercial site production data from laying hens housed in conventional cage, cage-free aviary (aviary), and enriched colony cage. Data graphed is over 15 periods (28 d per period) beginning at 20 wks of age: A) Hen-day egg production, B) cumulative mortality on a percentage basis, C) feed usage g/hen/day, and D) hen BW.
Table 5.
Performance summary of Lohmann LSL white hens in conventional cage, cage-free aviary, and enriched colony cage systems over 15 production periods.
| Housing System | ||||
|---|---|---|---|---|
| Production Parameter | Conventional | Aviary | Enriched Colony | Reference1 |
| No. of Hens House−1 (wk 20) | 193,424 | 49,830 | 46,795 | - |
| No. of Hens House−1 (wk 78) | 184,322 | 44,082 | 44,404 | - |
| Cumulative Mortality (%) | 4.7 | 11.5 | 5.1 | 4 to 6 |
| Avg. hen-day Egg Prod. (%) | 87.3 | 86.6 | 90.5 | 87.0 |
| Eggs per Hen Housed | 352 | 340 | 363 | 349 |
| Egg Weight (g) | 58.5 | 58.4 | 59.1 | 66.9 |
| Feed Use (g hen−1 day−1) | 105.0 | 107.7 | 107.3 | 105 to 115 |
| Water use (g hen−1 day−1) | 221.0 | 182.9 | 195.0 | - |
| Water/Feed (kg/kg) | 2.06 | 1.64 | 1.73 | - |
| Feed Conversion (kg/doz. egg) | 1.44 | 1.49 | 1.42 | - |
| Feed Conversion (kg feed/kg egg) | 2.02 | 2.12 | 1.99 | 2.0 to 2.1 |
| Body weight at wk 78 (kg) | 1.56 | 1.53 | 1.55 | 1.72 to 1.86 |
Breeder company reference for Lohmann LSL white hen (20 to 78 wk).
The hen-day production (Figure 5A) model did not show any significance in the PCA 1 direction though it did indicate a linear and a nonlinear trend in the PCA 2 direction. These trends were observed to be similar for all housing systems with production increasing as PCA 2 increased and reaching an inflection where production started to decrease at higher levels of PCA 2. The figure indicates a range between −1 and 2 of PCA 2 where production seems to be optimal (Figure 5A). The model for mortality was the simplest of all models with one intercept and one linear slope in association with all housing systems (Table 4). Figure 5B shows the outcome model indicating a linear increase in mortality as PCA 2 increases with no effect observed for PCA 1.
Monthly Egg Quality Data with Concurrent Nutrient and Energy Intake
Egg Weight.
Table 4 reports the resulting model chosen in association with the egg weight variable. The best-fit model included nonlinear trends that were only different in the PCA 1 direction and linear trends that were only different in the PCA 2 direction. Figure 6 depicts the outcome and indicates a decrease in egg weight as PCA 2 increases for all housing systems. The figure also shows a decrease in egg weight for the laying hens in enriched colony cages as PCA 1 increases. This trend is nonlinear for the other housing systems where egg weight rebounds after the zero level of PCA 1. The negative relationship in the PCA 2 with crude fiber would suggest there could be a level at which the amount of crude fiber consumed by the laying hen could impact egg weight. Shalash et al. (2010) reported a slight (<0.5 g) decrease in egg weight across diets that had approximately a 1% increase in crude fiber content. However, the type of laying hen utilized by Shalash et al. (2010) for the study is not a common breed and, therefore, might be a reflection of strain differences and not necessarily nutrient and energy intake.
Figure 6.
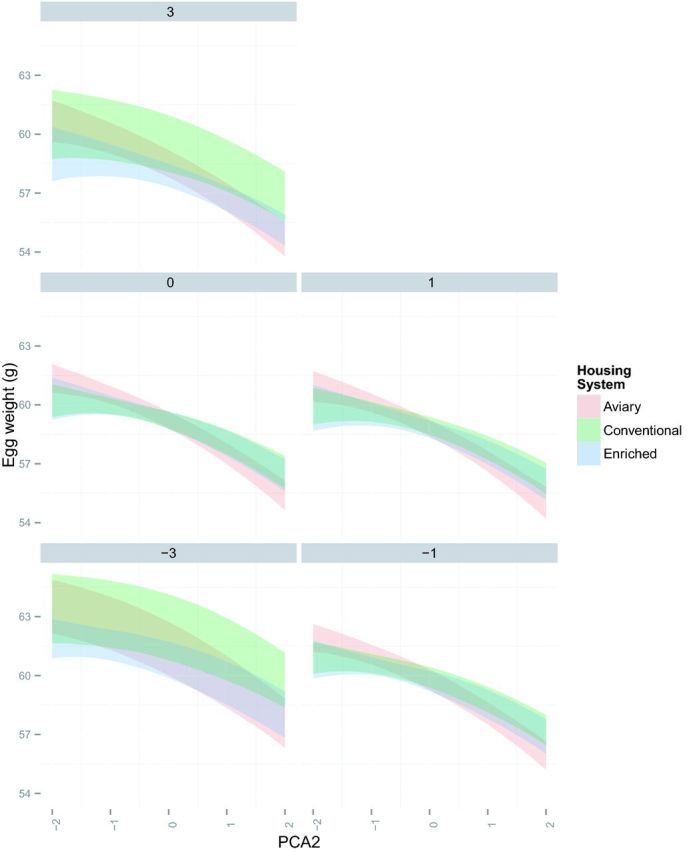
Egg weight. Monthly egg quality data analyzed with principle component approach (PCA) evaluating nutrient and energy intake values for laying hens during the production period. The figures present the 95% credibility intervals with red (aviary), green (conventional cage), and blue (enriched colony cage) with overlapping colors indicating no significant difference.
Haugh Unit.
The best model chosen for this variable included different intercepts, a different linear slope in the PCA 1 direction, and different nonlinear trends in the PCA 2 direction (Table 4). Additionally, the model shows similar linear slopes in the PCA 2 direction and a similar nonlinear trend in the PCA 1 direction. Again, the trends are presented in the PCA 2 direction to highlight the nonlinear trend (Figure 7). This figure indicates that the hens in the aviary housing system show a profound nonlinear component in the PCA 2 direction with a minimum Haugh Unit (HU) attained at the zero PCA 2 access. At that point, the aviary system has a lower HU than that for the other two housing systems when nutrients are high (PCA 1 = −4 and 0) especially as compared to the conventional housing system. The conventional housing system shows a decrease in the direction of the increase in PCA 1 more so than the other two housing systems and is significantly different than both at the low and high PCA 2 values.
Figure 7.
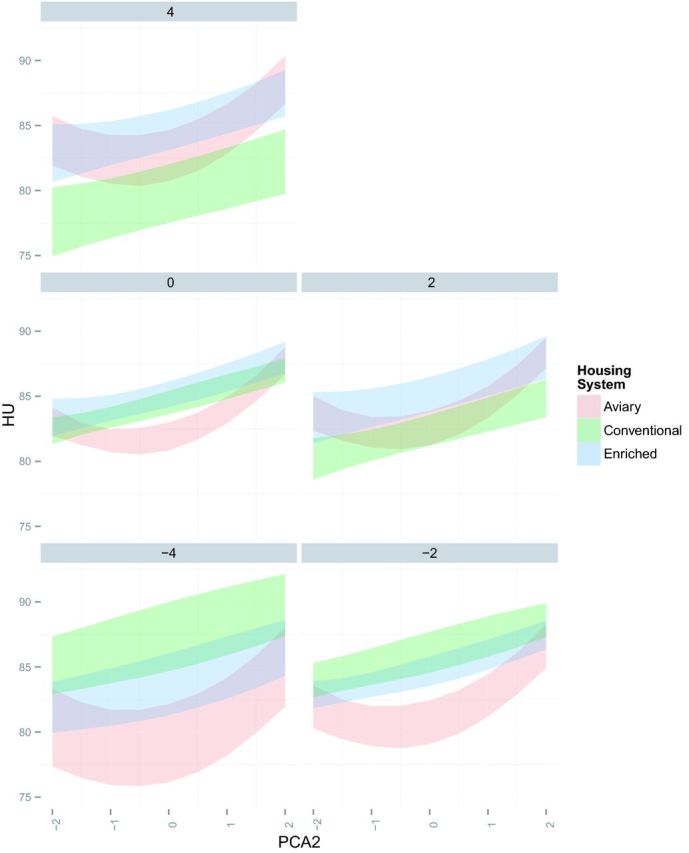
Haugh unit. Monthly egg quality data analyzed with principle component approach (PCA) evaluating nutrient and energy intake values for laying hens during the production period. The figures present the 95% credibility intervals with red (aviary), green (conventional cage), and blue (enriched colony cage) with overlapping colors indicating no significant difference.
Valkonen et al. (2006) reported higher HU when laying hens were fed a low protein diet (14%) compared to a high protein diet (19%). Contradictorily, several articles have reported no impact on HU when evaluating different energy and protein intake levels (Valkonen et al., 2008; Gunawardana et al., 2009; Wall et al., 2010). The confound of the housing system has only slightly been explored with Valkonen et al. (2010) reporting no differences in HU between conventional and furnished colony cages. Figure 7 illustrates at specific nutrient and energy intake levels in the conventional cage and enriched colony cage (PCA 1 levels of −4 to 0; PCA 1 levels −1 to 1) that this is the case.
Whole Egg Solids.
The model chosen for this variable showed a difference in linear and nonlinear trends only in the PCA 2 direction. Figure 8 shows this trend difference in the PCA 2 direction with the enriched housing system showing a different, reversed nonlinear trend than that observed for the conventional and aviary housing systems. A maximum value for whole eggs solids for the aviary and conventional housing systems is attained around the value 0 for the PCA 2, while the enriched housing system has a minimum around that value. Significant differences are only observed between the enriched and aviary housing systems at the highest levels of PCA 2. Several articles have reported no nutritional impact on whole egg solids when evaluating different nutrient and energy intake levels (Gunawardana et al., 2009; Yuan et al., 2009) as well as no differences between housing systems when evaluating changes in long-term egg storage (Jones et al., 2014).
Figure 8.
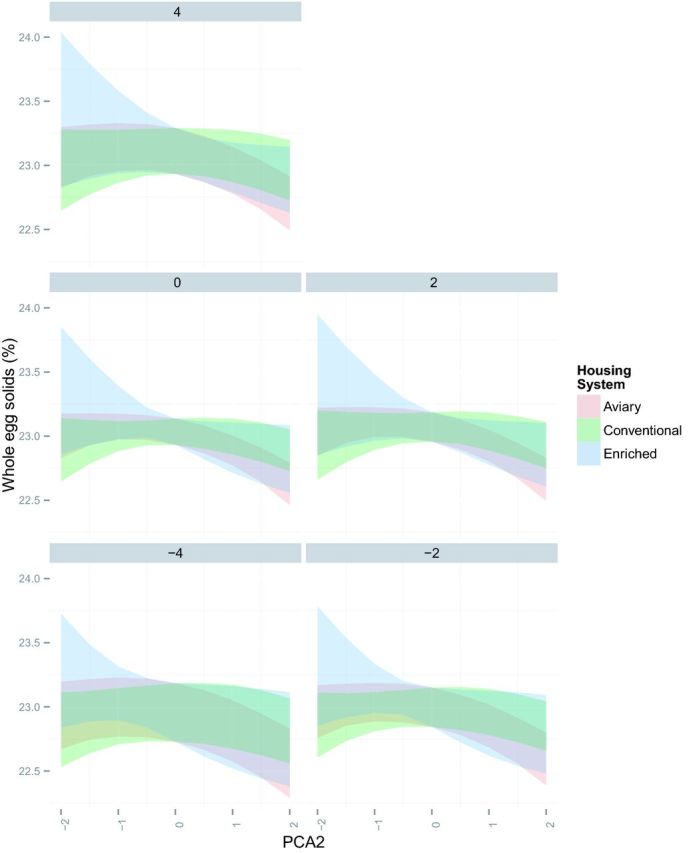
Whole egg solids. Monthly egg quality data analyzed with principle component approach (PCA) evaluating nutrient and energy intake values for laying hens during the production period. The figures present the 95% credibility intervals with red (aviary), green (conventional cage), and blue (enriched colony cage) with overlapping colors indicating no significant difference.
Vitelline Membrane Strength and Deformation.
The selected model for this variable (Table 4) included equal intercepts and equal linear slopes in the PCA 1 direction, housing system dependent linear slopes in the PCA 2 direction, and a housing system dependent nonlinear trend in the PCA 1 direction. Figure 9 clearly indicates a significant difference between the aviary and conventional housing systems at the high levels of PCA 1 at low to moderate levels of PCA 2. The observed trend indicates vitelline membrane strength increases and then decreases as nutrient and energy intake declines in both the conventional and enriched colony systems. This trend is reversed in the aviary housing system. Vitelline membrane strength increases in all housing systems as PCA 2 increases.
Figure 9.
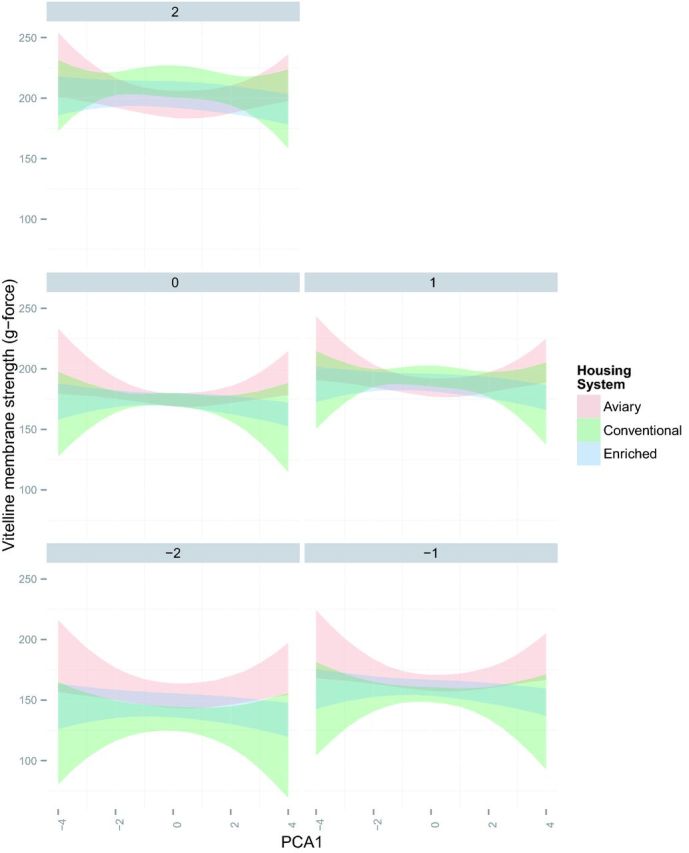
Vitelline membrane strength. Monthly egg quality data analyzed with principle component approach (PCA) evaluating nutrient and energy intake values for laying hens during the production period. The figures present the 95% credibility intervals with red (aviary), green (conventional cage), and blue (enriched colony cage) with overlapping colors indicating no significant difference.
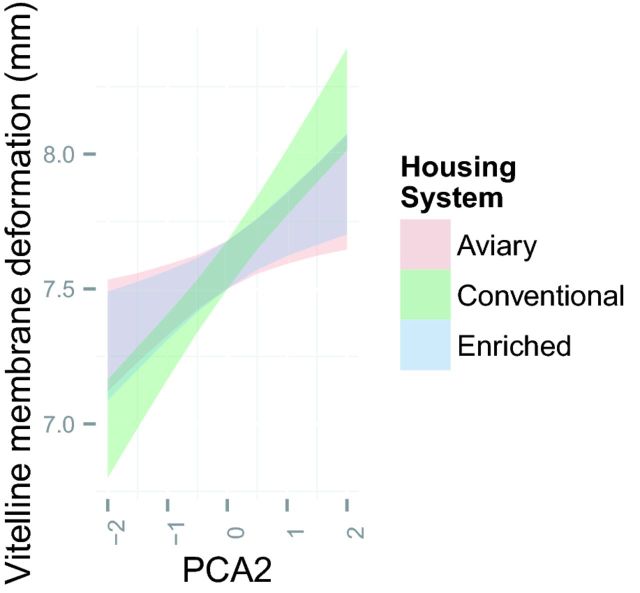
Vitelline membrane deformation resulted in a simpler model than that for vitelline membrane strength (Table 4). The model did not indicate any particular trend in the PCA 1 direction for this variable. A common intercept was present for all housing systems though different linear slopes in the PCA 2 direction and no nonlinear trend. Figure 10 shows the resulting outcome indicating a significant linear increase in vitelline membrane deformation in the direction of increase of PCA 2. This has not been previously reported, but the increase might be associated with the decrease in crude fiber, Cl, ME, and the increase in Met (Figure 2).
Figure 10.
Vitelline membrane deformation. Monthly egg quality data analyzed with principle component approach (PCA) evaluating nutrient and energy intake values for laying hens during the production period. The figures present the 95% credibility intervals with red (aviary), green (conventional cage), and blue (enriched colony cage) with overlapping colors indicating no significant difference.
Shell Strength.
The chosen model to fit the data (Table 4) included different intercepts, different linear slopes in the PCA 2 direction, but similar linear slopes in the PCA 1 direction. Figure 11 provides a plot of the change in shell strength force as PCA 1 changes at each level of PCA 2 (as presented in each of the panels). The figure indicates, as expected, that an increase in PCA 1, a reduction in nutrient and energy intake, is associated with a reduction in shell strength force. The figure also indicates that the different housing systems behave similarly in this dimension with the aviary housing system having a lower, flatter slope than the other two systems in the PCA 2 direction. This indicates that change in the composition of variables associated with PCA 2 has less impact on shell strength force for the aviary housing system as compared to the other two. Additionally, an increase in PCA 2 is associated with an increase in shell strength force for the enriched colony and conventional housing systems. The interpretation of this result might indicate that a decrease in crude fiber and an increase in Met and Met/Cys might result in improving shell strength force, though this is not conclusive within the observed range as all credibility intervals overlap.
Figure 11.
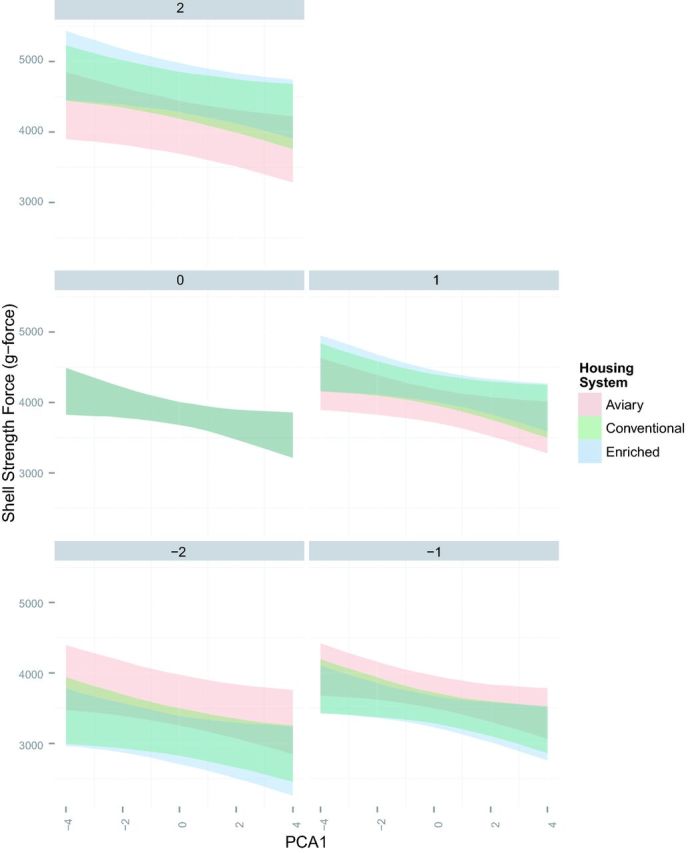
Shell strength. Monthly egg quality data analyzed with principle component approach (PCA) evaluating nutrient and energy intake values for laying hens during the production period. The figures present the 95% credibility intervals with red (aviary), green (conventional cage), and blue (enriched colony cage) with overlapping colors indicating no significant difference.
Valkonen et al. (2006; 2008) found laying hens in conventional cages had greater shell strength than hens in the furnished cages. A high protein diet (19%) resulted in higher shell strength and supports well our interpretation, but requires further investigation (Valkonen et al., 2006).
Shell Dynamic Stiffness.
Differences between housing systems were observed only in linear trends in the PCA2 direction and the nonlinear trend in the PCA 1 direction (Table 4 and Figure 12). Figure 12 shows a consistent decrease in shell dynamic stiffness as PCA 1 increases from −4 to 0. This trend continues for the enriched colony and aviary housing systems but tapers for the conventional housing system at the zero point of PCA 1. Also, a reduction in shell dynamic stiffness occurs as PCA 2 increases and is consistent for all housing systems. The reduction in shell dynamic stiffness is slower in eggs from the conventional cage system, which has a significantly higher shell dynamic stiffness than the other two housing systems at high levels of PCA 2 for the highest and lower levels of PCA 1.
Figure 12.
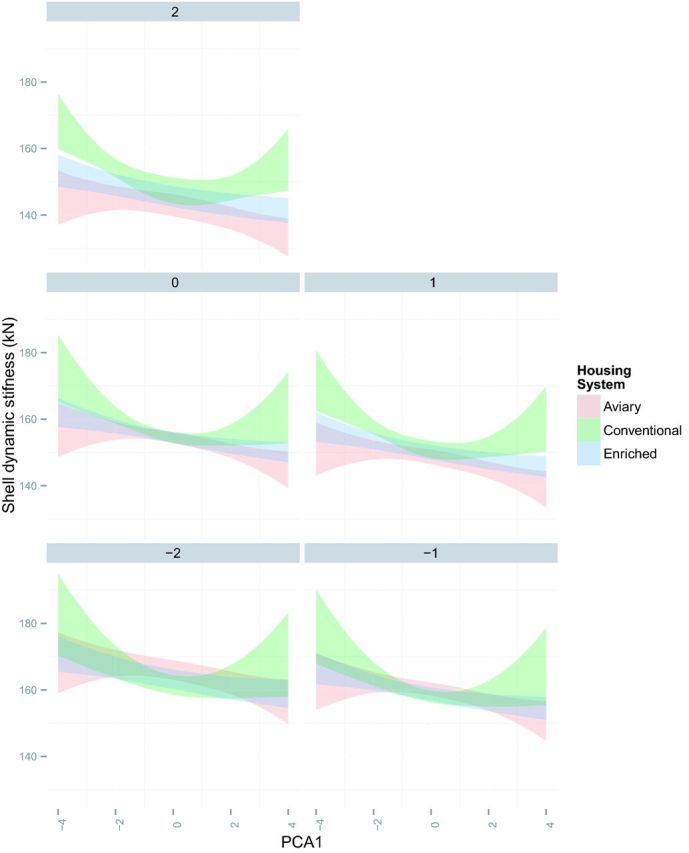
Shell dynamic stiffness. Monthly egg quality data analyzed with principle component approach (PCA) evaluating nutrient and energy intake values for laying hens during the production period. The figures present the 95% credibility intervals with red (aviary), green (conventional cage), and blue (enriched colony cage) with overlapping colors indicating no significant difference.
Shell Thickness.
The chosen model for thickness included linear and nonlinear trends in both the PCA 1 and PCA 2 directions with a nonlinear trend difference in the PCA 2 direction only (Table 4). Figure 13 shows the trends with differences in concavity between the housing systems with shell thickness increasing with PCA 2 for both the conventional and enriched colony housing systems and tapering off at the high levels of PCA 2 while continuing in an increasing trend for the aviary housing system. Yuan et al. (2009) reported no differences in shell thickness from conventional cage eggs as a result of diets with different energy values similar to the observations made in Figure 13.
Overall the data explores the complexity of conducting applied research at a commercial scale. While no direct conclusion can be made related to housing system and production variables, observed differences between housing systems might be more management related, with adjustments needed by a commercial entity adopting new housing systems, than differences due to the actual housing system. The various egg quality traits (shell parameters, vitelline membrane parameters, and whole egg solids) are more directly influenced by nutrition as opposed to the laying hen housing structures. Therefore, further research needs to be conducted in controlled research settings to delineate any nuances of specific housing systems on egg quality measures.
Acknowledgments
The authors appreciate the laboratory contributions of Patsy Mason, Bradley Covington, Robin Woodroof, and Stephen Norris (USDA, Agricultural Research Service, Athens, GA) throughout this project.
Footnotes
Research support provided in part by a grant from the Coalition for a Sustainable Egg Supply (Kansas City, MO).
REFERENCES
- Abrahamsson P., Tauson R. Performance and egg quality of laying hens in an aviary system. J. Appl. Poult. Res. 1998;7:225–232. [Google Scholar]
- Anderson K. E. Final Report of the Thirty Eighth North Carolina Layer Performance and Management Test. NC Cooperative Extension Service. 2012;38(5) http://www.ces.ncsu.edu/depts/poulsci/tech_manuals/layer_reports/38_final_report.pdf. Date accessed: August 8, 2013. [Google Scholar]
- Guesdon V., Faure J. M. Laying performance and egg quality in hens kept in standard or furnished cages. Anim. Res. 2004;53:45–57. [Google Scholar]
- Gunawardana P., Bryant M. M., Roland D. A., Sr., Wu G., Yuan K. Effect of dietary energy on performance, egg components, egg solids, egg quality and profits in seven commercial leghorn strains during second cycle phase two. Int. J. Poult. Sci. 2009;8:323–327. [Google Scholar]
- Hetland H., Svihus B., Lervik S., Moe R. Effect of feed structure on performance and welfare in laying hens housed in conventional and furnished cages. Acta Agric. Scand. Sect. A. Anim. Sci. 2003;53:92–100. [Google Scholar]
- Hetland H., Moe R., Tauson R., Lervik S., Svihus B. Effect of including whole oats into pellets on performance and plumage condition in laying hens housed in conventional and furnished cages. Acta Agric. Scand. Sect. A. Anim. Sci. 2004;54:206–212. [Google Scholar]
- Hidalgo A., Rossi M., Clerici F., Ratti S. A market study on the quality characteristics of eggs from different housing systems. Food Chem. 2008;106:1031–1038. [Google Scholar]
- Holt P. S., Davies R. H., Dewulf J., Gast R. K., Huwe J. K., Jones D. R., Waltman D., Willian K. R. The impact of different housing systems on egg safety and quality. Poult. Sci. 2011;90:251–262. doi: 10.3382/ps.2010-00794. [DOI] [PubMed] [Google Scholar]
- Johnson R. A., Wichern D. W. Applied multivariate statistical analysis. 3rd Edition. Upper Saddle River, New Jersey: Printice Hall; 1992. [Google Scholar]
- Jones D. R., Karcher D. M., Abdo Z. Effect of a commercial housing system on egg quality during extended storage. Poult. Sci. 2014;93:1282–1288. doi: 10.3382/ps.2013-03631. [DOI] [PubMed] [Google Scholar]
- Keener K. M., McAvoy K. C., Foegeding J. B., Curtis P. A., Anderson K. E., Osborne J. A. Effect of testing temperature on internal egg quality measurements. Poult. Sci. 2006;85:550–555. doi: 10.1093/ps/85.3.550. [DOI] [PubMed] [Google Scholar]
- Keshavarz K., Nakajima S. Re-evaluation of calcium and phosphorus requirements of laying hens for optimum performance and eggshell quality. Poult Sci. 1993;72:144–153. [Google Scholar]
- Latshaw J. D., Zhao L. Dietary protein effects on hen performance and nitrogen excretion. Poult Sci. 2011;90:99–106. doi: 10.3382/ps.2010-01035. [DOI] [PubMed] [Google Scholar]
- Lay D. C., Fulton R. M., Hester P. Y., Karcher D. M., Kjaer J. B., Mench J. A. Hen welfare in different housing systems. Poult. Sci. 2011;9:278–294. doi: 10.3382/ps.2010-00962. [DOI] [PubMed] [Google Scholar]
- Lohmann Tierzucht. Layer management guide for Lohmann LSL white hen (20–78 week) 2014 http://www.lskpoultry.fi/materiaalit/lsl_managementguide.pdf. Date accessed on April 9. [Google Scholar]
- Mejia L., Meyer E. T., Studer D. L., Utterback P. L., Utterback C. W., Parsons C. M., Koelkebeck K. W. Evaluation of limit feeding varying levels of distillers dried grains with solubles in non-feed-withdrawal molt programs for laying hens. Poult. Sci. 2011;90:321–327. doi: 10.3382/ps.2010-01078. [DOI] [PubMed] [Google Scholar]
- Mertens K., Bamelis F., Kemps B., Kamers B., Verhoelst E., De Ketelaere B., Bain M., Decuypere E., De Baerdemaeker J. Monitoring of eggshell breakage and eggshell strength in different production chains of consumption eggs. Poult. Sci. 2006;85:1670–1677. doi: 10.1093/ps/85.9.1670. [DOI] [PubMed] [Google Scholar]
- Neijat M., House J. D., Guenter W., Kebreab E. Production performance and nitrogen flow of Shaver White layers housed in enriched or conventional cage systems. Poult. Sci. 2011a;90:543–554. doi: 10.3382/ps.2010-01069. [DOI] [PubMed] [Google Scholar]
- Neijat M., House J., Guenter W., Kebreab E. Calcium and phosphorus dynamics in commercial laying hens housed in conventional or enriched cage systems. Poult. Sci. 2011b;90:2383–2396. doi: 10.3382/ps.2011-01401. [DOI] [PubMed] [Google Scholar]
- Plummer M. Proc. 3rd Int. Workshop on Distributed Statistical Computing. Vienna, Austria: 2003. JAGS: A program for analysis of Bayesian graphical models using Gibbs sampling. [Google Scholar]
- R Core Team. R: A language and environment for statistical computing. Vienna, Austria: R Foundation for Statistical Computing; 2014. http://www.R-project.org/ [Google Scholar]
- Shalash S. M. M., Abou El-Wafa S., Hassan R. A., Ramadan N. A., Mohamed M. S., El-Gabry H. E. Evaluation of distillers dried grains with solubles as feed ingredient in laying hen diets. Int. J. Poult. Sci. 2010;9:537–545. [Google Scholar]
- Spiegelhalter D. J., Best N. G., Carlin B. P., van der Linde A. Bayesian measures of model complexity and fit (with discussion). J. Royal Stat. Soc. Series B. 2002;64:583–639. [Google Scholar]
- Tactacan G. B., Guenter W., Lewis N. J., Rodriguez-Lecompte J. C., House J. D. Performance and welfare of laying hens in conventional and enriched cages. Poult. Sci. 2009;88:698–707. doi: 10.3382/ps.2008-00369. [DOI] [PubMed] [Google Scholar]
- Valkonen E., Venäläinen E., Rossow L., Valaja J. Effects of dietary protein on egg production of laying hens housed in furnished or conventional cages. Acta Agric. Scand. Sect. A. Anim. Sci. 2006;56:33–41. [Google Scholar]
- Valkonen E., Venalainen E., Rossow L., Valaja J. Effects of dietary energy content on the performance of laying hens in furnished and conventional cages. Poult. Sci. 2008;87:844–852. doi: 10.3382/ps.2007-00237. [DOI] [PubMed] [Google Scholar]
- Valkonen E., Venalainen E., Rossow L., Valaja J. Effects of calcium diet supplements on egg strength in conventional and furnished cages, and effects of 2 different nest floor materials. Poult. Sci. 2010;89:2307–2316. doi: 10.3382/ps.2010-00700. [DOI] [PubMed] [Google Scholar]
- Van Den Brand H., Parmentier H. K., Kemp B. Effects of housing system (outdoor vs cages) and age of laying hens on egg characteristics. Brit. Poult. Sci. 2004;45:745–752. doi: 10.1080/00071660400014283. [DOI] [PubMed] [Google Scholar]
- Vits A., Weitzenbürger D., Hamann H., Distl O. Production, egg quality, bone strength, claw length, and keel bone deformities of laying hens housed in furnished cages with different group sizes. Poult. Sci. 2005;84:1511–1519. doi: 10.1093/ps/84.10.1511. [DOI] [PubMed] [Google Scholar]
- Wahlström A., Tauson R., Elwinger K. Production and egg quality as influenced by mash or crumbled diets fed to laying hens in an aviary system. Poult. Sci. 1999;78:1675–1680. doi: 10.1093/ps/78.12.1675. [DOI] [PubMed] [Google Scholar]
- Wall H. Production performance and proportion of nest eggs in layer hybrids housed in different designs of furnished cages. Poult. Sci. 2011;90:2153–2161. doi: 10.3382/ps.2011-01495. [DOI] [PubMed] [Google Scholar]
- Wall H., Tauson R. Egg quality in furnished cages for laying hens – effects of crack reduction measures and hybrid. Poult. Sci. 2002;81:340–348. doi: 10.1093/ps/81.3.340. [DOI] [PubMed] [Google Scholar]
- Wall H., Jonsson L., Johansson L. Effects on egg quality traits of genotype and diets with mussel meal or wheat-distillers dried grains with solubles. Poult. Sci. 2010;89:745–751. doi: 10.3382/ps.2009-00358. [DOI] [PubMed] [Google Scholar]
- Yuan K., Guangbing W., Bryant M. M., Roland D. A., Sr Effect of dietary energy on performance, egg component, egg solids, and egg quality in Bovans White and Dekalb White hens during phase 2. J. Poult. Sci. 2009;46:30–34. [Google Scholar]


