Abstract
To measure stress in caged hens, differential counts of their wing vein blood were used to determine heterophil/lymphocyte (H/L) ratios and total white blood cell counts (TWBC). The H/L values of 18-wk samples from conventionally caged hens (CC) were not statistically different from hens raised in aviaries (AV) when calculated by either of 2 methods (H/L 1 and H/L 2). However, there was a high degree of variation among samples within each cage type. The TWBC data and hematology indicated leukocytosis, leukemoid reactions, and a high frequency of atypia. Reactive lymphocytes, large plasmacytoid lymphocytes, cyanophils, coccinocytes, and atypical heterophils were common. Analysis of 77-wk data indicated significant differences among 3 cage types. The H/L 1 of enriched caged (EN) hens was twice (0.91) that of either AV (0.33) or CC (0.44) hens (P < 0.01); the H/L 2 values were also highest for EN (0.46) versus AV (0.29) and CC (0.34; P <0.01). As was the case with 18-wk samples, TWBC distributions and hematological data indicated leukocytosis, leukemoid reactions, and a high frequency of atypia. Among the likely reasons for the hematological observations was the occurrence of polymicrobial bacteremia and fungemia, both of which could account for high TWBC and atypical cells. Collectively, these observations challenge the general application of the H/L ratio method when applied alone as an indicator of stress and welfare of hens caged in modern systems.
Keywords: heterophil/lymphocyte ratio, stress, caged hen, welfare
INTRODUCTION
The application of heterophil-lymphocyte ratios (H/L) to assess stress has its origins in a series of papers published during the 1980s. Davison and Rowell (1983) described how dietary cortisone could induce lymphocytopenia and granulocytosis and so affect the granulocyte:lymphocyte ratio. They suggested the granulocyte:lymphocyte ratio might provide a convenient measure of adrenal-corticoid hyperactivity. Gross (1989) indicated that social stress, chilling, and injected Escherichia coli affect the H/L ratio. The H/L ratios of Leghorns rose from 0.38 to >9 with the addition of corticosterone to the diet. Higher H/L ratios of socialized hens caged as 5 females with 5 males resulted in elevated plasma corticosterone (Gross and Siegel, 1983). Fasting raised H/L ratios in experimental hens, but a second fast period did not affect these to the same degree as the initial exposure (Gross and Siegel, 1986). The use of H/L to assess stress across taxa reviewed by Davis et al. (2008) indicates that the inherent variation in white blood cell counts among individuals limits the utility of this method. In addition, the lack of appropriate reference values needed for comparative work and the difficulty of differentiating between acute and chronic stress types are also limitations. Dhabhar (2009) suggested that acute stress as the fight-or-flight response might augment immunity, but long-term stress would be immunosuppressive. Because both experiences are common in caged animals, 2 kinds of stress can be confounded. The purpose here is to examine the H/L ratio method as a stress/welfare indicator for commercial hens housed conventionally (CC) in aviaries (AV) or in enriched cages (EN). No deliberate exposures to other treatments were a part of the management scheme.
MATERIALS AND METHODS
Chickens
Chicks of a Lohmann White Egg commercial type (LSL) destined for CC and EN were reared in common and separated at placement (18 wk) into their final cage assignments. Aviary chicks occupied those units from hatching until the termination of production (77 wk). Adults were housed in AV at 850 to 1,700 hens per compartment, 6 per CC, and 60 per EN. Vaccines against Marek's disease and laryngotracheitis were applied at the hatchery, and additional vaccinations were given later; hens were reared using a typical program for the management of commercial hens as described by Jones et al. (2014). Two consecutive flocks were studied; only flock 2 data are here.
These hens were a part of a larger study (Jones et al., 2014) called the Coalition for a Sustainable Egg Supply.
Blood and Stain Procedure
Samples collected from wing veins into EDTA tubes, 1 to 3 mL, were obtained at 18 (placement), 32, 48, 56, and 77 wk. Only 18- and 77-wk data are here. Monolayer films made by pushing approximately 3 μL of blood across a standard microscope slide were dried immediately by a hot air stream. Slides were then immersed in 95% ethanol and postfixed for 10 to 15 min. Films were stained by Wright's method following the times and procedures recommended by the manufacturer (procedure WSGD-128, Sigma Chemicals, St. Louis, MO).
Differential Counts
A minimum of 200 leukocytes per slide were sorted into categories: small or medium lymphocytes, monocytes, heterophils (typical, variant, and classic types), basophils, or eosinophils. Morphological criteria for sorting were as described by Lucas and Jamroz (1961). Atypical lymphocytes were included in the differential counts, their locations noted, and later photographed. Parts of this study, emphasizing variation in granulocyte morphology, are in Cotter et al. (2012, 2013) and Cotter (2014b).
H/L 1 and 2 Calculations
Division of the sum of all heterophil types (typical, variant, and classic) by the number of small “resting” lymphocytes gives H/L 1. Division of the same heterophil value by the sum of all lymphocyte types, (resting, reactive, and atypical) gives H/L 2. Representative cells used for each H/L calculation are in Figure 1 where cell size is estimated by the long axis of erythrocytes, averaging 9 μM.
Figure 1.
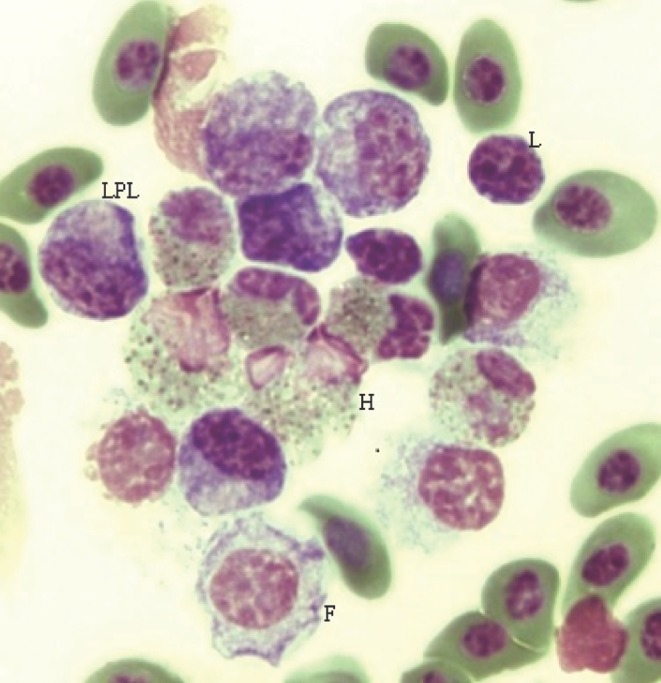
Examples of cells used in calculating heterophil/lymphocyte H/L 1 and H/L 2 ratios. LPL, large plasmacytoid lymphocyte, L, small resting lymphocyte, H, classic heterophils, F, foam-type lymphocyte. H/L 1 = 2 (6 heterophils/3 small lymphocytes); H/L 2 = 0.67 (6 heterophils/9 lymphocytes, all types). All cells were found in an 18-wk hen (#707, conventionally caged). Scale: 1 erythrocyte (long axis) ∼9 μM, magnification, 100× (oil).
Total White Blood Cell Count
The average number of white blood cells in five 40× microscopic fields multiplied by 4,000 provides the total white blood cell count (TWBC; per mm3) estimate, after a modification of a method described by Campbell and Ellis (2007).
Statistics
One-way ANOVA, means separation tests (Tukey), and graphics were done using Minitab Statistical Software (Release 16 for Windows, State College, PA).
Light Microscopy and Photomicrograph
An Olympus CX-41(Olympus America, Center Valley, PA) fitted with Plan N 40×, 0.65 Numerical Aperture dry, and Plan N, 1.25 N.A. 100× (oil) objectives. The Figure 1 image was captured by an Infinity-2 1.4 Megapixel CCD USB 2.0 Camera and processed with Infinity Analyze software (Release 5.0.3, Lumenera Inc., Ottawa, Ontario, Canada). Magnification was 100× (oil).
RESULTS
To conserve space, information derived from 2 sample periods only (18 and 77 wk) is presented; the first data set came at placement (18 wk) and included only AV and CC hens. The CC and EN pullets raised in common were separated into their final cage assignments at placement; AV pullets were in those cages since hatching. The second data set, obtained at wk 77, now composed of AV, CC, and EN caged hens, came from the same flock. The younger hen data are first. Figure 1, which shows examples of cells included in both methods for H/L calculation, came from an 18-wk hen blood film. Cells similar to those displayed in Figure 1 were present in 77-wk samples and used accordingly.
Neither H/L 1 nor H/L 2 ratios of AV and CC hens were statistically different at 18 wk (Table 1). However, the magnitudes of the respective SD and the consequent CV (67 and 58%, respectively) indicate highly variable blood pictures in each group, supporting one of the limitations cited in Davis et al. (2008). The scatter plot of H/L 2 versus H/L 1 (Figure 2) shows high ratios in a few hens of both types. A normalized TWBC frequency histogram (Figure 3) indicates the proportion of hens having frank leukocytosis (>25 K/mm3) and leukemoid reactions (>50 K/mm3), both of which were confirmed microscopically. The CC hens had a higher mean TWBC (∼57 K) versus AV (∼36 K; P < 0.0001); however, as with H/L ratios, the high SD and CV of 55 and 46%, respectively, reflect hemogram abnormality. Although not indicated by either Figure 1 or 2 or by the statistical analyses (Table 1), several samples had frank bacteremia and other pathology. Examination of Table 2, giving differential counts for selected hens, of both cage types, indicates a complex blood picture suggestive of stress and pathology. It was possible to find hens in which relatively low H/L were accompanied by high TWBC. This is both a consequence of computational methodology (TWBC do not enter into H/L calculations) and a high frequency of atypia.
Table 1.
Eighteen-week hematological statistical analyses (1-way ANOVA) of total white blood cell count (TWBC),1 H/L 1 and H/L 2 means,2 and SD.
| Item | No. | TWBC | SD | No | H/L 1 | SD | H/L 2 | SD |
|---|---|---|---|---|---|---|---|---|
| Cage3 | ||||||||
| AV | 37 | 36,351 | 19,352 | 49 | 0.25 | 0.73 | 0.24 | 0.73 |
| CC | 48 | 57,167 | 25,583 | 50 | 0.16 | 0.12 | 0.14 | 0.10 |
| F(1,83) | 17 | |||||||
| F(1,97) | 0.88 | 0.96 | ||||||
| P-value | 0.0 | 0.35 | 0.33 |
TWBC could not be estimated from the complete sample set due to clotting and other technical difficulties.
H/L 1 and H/L 2 are 2 different methods of calculating heterophil to lymphocyte ratio.
AV = aviary; CC = conventional cage.
Figure 2.
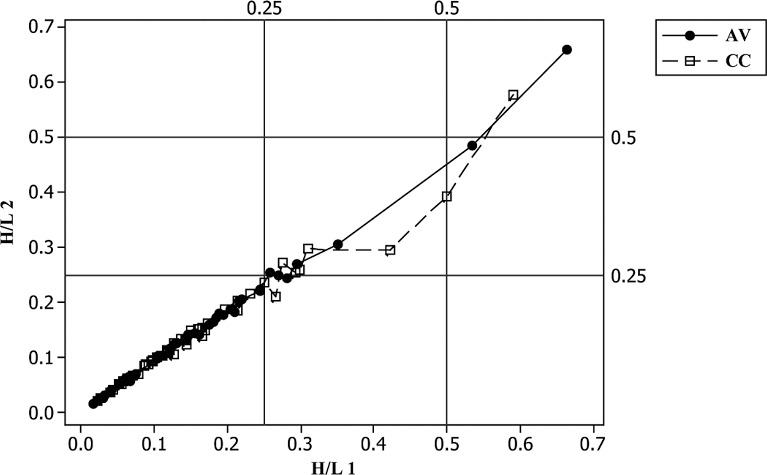
Scatter plot of 18-wk heterophil/lymphocyte H/L 2 versus H/L 1 with 0.25 and 0.5 reference values. AV = aviary; CC = conventional cage.
Figure 3.
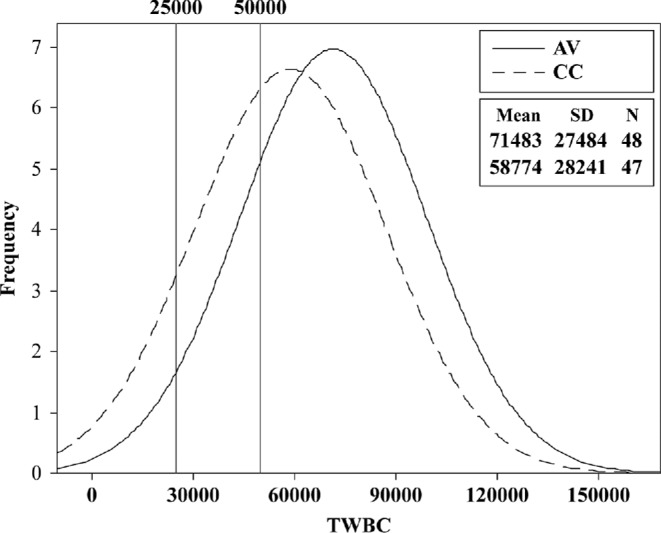
Histogram (normalized) of total white blood cell count (TWBC) distributions of aviary (AV) and conventionally caged (CC) hens at wk 18, with leukocytosis (25 K) and leukemoid reaction (50 K) cut-off points.
Table 2.
Differential counts, H/L 1, H/L 2, and total white blood cell counts (TWBC) of selected 18-wk hens1.
| Hen2 | Typ Het3 | Var Het | Classic Het | Lymp (sm) | Lymp (med) | NK | GBlast | Mono | Baso | Eosin | Total | H/L 1 | H/L 2 | TWBC (K) |
|---|---|---|---|---|---|---|---|---|---|---|---|---|---|---|
| 698 AV | 2.6 | 3.0 | 8.7 | 66.5 | 3.9 | 0.9 | 2.2 | 1.3 | 8.7 | 0.0 | 230 | 0.22 | 0.20 | 80 |
| 675 AV | 8.9 | 3.6 | 2.2 | 72.3 | 6.7 | 2.2 | 0.0 | 0.9 | 0.0 | 0.0 | 224 | 0.20 | 0.19 | 40 |
| 749 CC | 6.5 | 0.9 | 2.3 | 65.6 | 0.5 | 0.0 | 0.0 | 17.7 | 4.2 | 0.0 | 215 | 0.15 | 0.15 | 100/1804 |
| 748 CC | 7.8 | 0.0 | 7.8 | 79.1 | 3.4 | 0.0 | 0.0 | 0.0 | 0.0 | 0.0 | 206 | 0.20 | 0.19 | 50 |
Cell data are the percentage of each type based on the total count. H/L 1 and H/L 2 are 2 different methods of calculating heterophil to lymphocyte ratio.
AV = aviary; CC = conventional cage.
Typ, Var, Classic Het = typical, variant, and classic heterophil, respectively; Lymp = lymphocyte; sm = small; med = medium; NK = lymphocyte with azure granules; GBlast = gramuloblast; Mono = monocyte; Baso = basophilic granulocyte; Eosin = eosinophil.
TWBC for hen #749 CC was calculated from microscopic fields located at the slide center only (100 K) and by including fields at the edges (180 K).
As an example, the differential for hen #749 (CC, 18 wk) included many coccinocytes, representing developmental stages of natural killer cells (Cotter et al., 2013), atypical monocytes, a giant Mott cell (P. F. Cotter, unpublished observation), and other atypia. All presented in the context of a polymicrobial bacteremia (Cotter, 2014c). Neither atypical monocytes nor coccinocytes, found in this sample, were included in calculating H/L. To date, 78 photomicrographs of (multiple) atypical cells are found in this representative sample.
DISCUSSION
One of the purposes of the Coalition for a Sustainable Egg Supply study was to assess welfare of commercial type hens in cages using hematologic data, among other criteria. The intent was to apply the H/L ratio method to measure stress based on established principles and its wide use, reviewed in Davis et al. (2008). In theory, stress alters homeostasis by affecting the adrenal-corticoid axis. Because of high hormone levels, leukopenia (lymphocyte) and leukocytosis (heterophil) result in a change of the H/L. If a certain housing style provided for a more or less stressful environment, it is reflected in the hematology. Statistical analysis of H/L data at 18 wk did not indicate this was the case. However, it is also clear from the hematological observations that application of the H/L method alone is inadequate. Low H/L values were found in hens with leukocytosis and leukemoid reactions, and some hens with high TWBC had normal H/L. Moreover, the differential counts of many hens revealed atypia. Among the unusual cells were “toxic” and dwarf heterophils (Cotter, 2014b), large plasmacytoid lymphocytes, and Mott cells (Cotter, 2014a). Cyanophils, a recently described granulocyte (Cotter et al., 2012), were common. They are a good indication of the coexistence of monotypic or polymicrobial bacteremia (Cotter, 2014b). Finding 1 or 2 cyanophils, during a 200-cell differential count, led to finding free or phagocytosed bacteria upon more extensive examination.
The H/L ratio(s) of both cage types at 18 wk averaging ∼0.2 were similar to those of control chickens, ∼0.3 reported by Gross (1989); however, the H/L 1 and 2 SD were much higher in the present study (Table 2). This difference was at an extreme in AV hens. Moreover, the experimental treatments used in the Gross study altered the H/L ratios without having much effect on the TWBC. Here, however, that was not the case. The TWBC in the present study indicated population-wide leukocytosis and leukemoid reactions. Perhaps the current data emphasize how observations on experimental subjects may not reflect events of a practical poultry environment.
Scatter plots of H/L 2 versus H/L 1 indicate some of the hematological complications found in these hens. At placement (18 wk), H/L 2/1 linearity is suggested by the location of most data points along the diagonal. However, outliers were already present (Figure 2). This happens when a large number of reactive lymphocytes and other atypical cells increases the H/L 2 denominator value. The result is a large difference between the 2 H/L, placing some data points away from the linear. Hematological data collected at 77 wk are more complex than at 18 wk. Both H/L means indicated a statistical difference among cages (Table 3). The EN H/L were absolutely higher than AV or CC. Moreover, the magnitude of the EN SD was 1.5 times its mean and the SD of the CC group was almost its equal, both indications of hematological abnormality not revealed by means. Additionally the normalized TWBC frequency distribution of EN was clearly different from AV and CC distributions (Figure 4; Figure 5). The TWBC of approximately one-half of the EN hens are high enough to indicate leukocytosis or more extreme leukemoid reactions, both of which were confirmed microscopically. As was the case at placement, the abnormal blood picture at wk 77 included absolute leukocyte numbers and a high frequency of atypical cells. Bacteremia and fungemia, likely causal factors, were also common.
Table 3.
Seventy-seven-week hematological statistical analyses (1-way ANOVA) of total white blood cell count (TWBC),1 H/L 1 and H/L 2 means,2 and SD.
| Item | No. | H/L 1 | SD | H/L 2 | SD | No. | TWBC (K) | SD |
|---|---|---|---|---|---|---|---|---|
| Cage3 | ||||||||
| AV | 38 | 0.33B | 0.22 | 0.29B | 0.18 | 34 | 28B | 15 |
| CC | 57 | 0.44B | 0.41 | 0.34AB | 0.22 | 36 | 28B | 14 |
| EN | 47 | 0.91A | 1.58 | 0.46A | 0.35 | 46 | 57A | 35 |
| F(2,139) | 4.68 | 4.61 | ||||||
| F(2,113) | 19 | |||||||
| P-value | 0.011 | 0.012 | 0.0 |
A,BMeans that do not share a superscript are significantly different (Tukey test).
TWBC could not be determined in some samples because of clotting.
H/L 1 and H/L 2 are 2 different methods of calculating heterophil to lymphocyte ratio.
AV = aviary; CC = conventional cage; EN = enriched cage.
Figure 4.
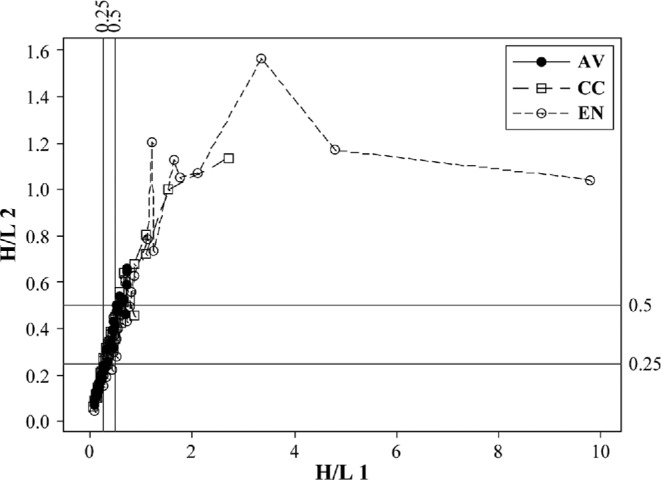
Scatter plot of 77-wk heterophil/lymphocyte H/L 2 versus H/L 1 with 0.25 and 0.5 reference values.
Figure 5.
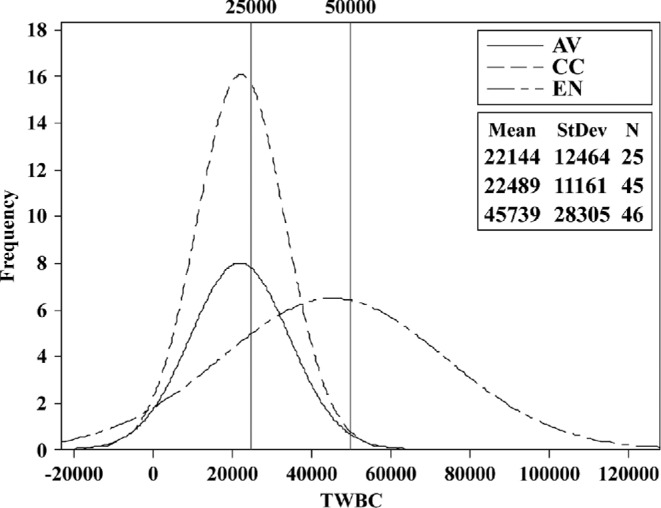
Histogram (normalized) of total white blood cell count (TWBC) distributions of aviary (AV), conventionally caged (CC), and enriched caged (EN) hens at wk 77, with leukocytosis (25 K) and leukemoid reaction (50 K) cut-off points.
Collectively, the observations described here indicate the inadequacies of the H/L method, used alone, as a reliable stress indicator when applied to hens caged in modern facilities. Its lack of sensitivity is partly dependent on computation. A low H/L accompanied by a high TWBC, a frank indication of stress, cannot be detected by calculation procedure(s) in common use. More important than H/L ratios or TWBC is the recognition of abnormal hematological phenomena, cellular atypia, including leukocytes, thrombocytes, and erythrocytes (Cotter 2014d, unpublished data). These cells alone indicate stress or a more serious pathology.
Given the level of interest in stress measurements as applied to the welfare of caged animals, hematological methods must be broad based. The H/L ratios without reference to TWBC, and cellular atypia, appear to lack the necessary power to give a realistic assessment of stress status.
Acknowledgments
The data are a part of the Coalition for a Sustainable Egg Supply project. I thank 2 anonymous reviewers for suggesting improvements to an earlier version of this manuscript.
REFERENCES
- Campbell T. W., Ellis C. K. Avian and Exotic Animal Hematology and Cytology. 3rd ed. Ames, IA: Blackwell Publ.; 2007. [Google Scholar]
- Cotter P. F. Avian Immunology Research Group Meeting. Guelph, Ontario, Canada: University of Guelph; 2014a. Are peripheral Mott cells an indication of inefficient immunity? Abstract No. 20, 2014, July 16–18. [Google Scholar]
- Cotter P. Atlanta, Georgia: International Poultry Scientific Forum, Georgia World Congress Center; 2014b. Cell death in healthy hens, leukocytes that challenge interpretation of the standard differential count. Abstract No. T92, January 27–28, 2014. [Google Scholar]
- Cotter P. Atlanta, Georgia: International Poultry Scientific Forum, Georgia World Congress Center; 2014c. Examples of atypical leukocytes associated with polymicrobial bacteremia. Abstract No. P15, January 27–28, 2014. [Google Scholar]
- Cotter P. F. Avian Immunology Research Group Meeting. Guelph, Ontario, CA: University of Guelph; 2014d. Reactive lymphocytes, plasma cells, and foam cells, in the peripheral circulation of healthy hens. Abstract No. 10, 2014, July 16–18. [Google Scholar]
- Cotter P. F., Karcher D. M., Robison C. Abstract No. 19, 101st Annual Meeting, Athens, GA. Champaign, IL: Poultry Science Association; 2012. Cyanophil; a novel granulocyte in peripheral blood of caged hens. [Google Scholar]
- Cotter P. F., Karcher D. M., Robison C. Atlanta, Georgia: International Poultry Scientific Forum Georgia World Congress Center; 2013. Coccinocyte: A precursor to NK cells of commercial pullets? Abstract No. M10, January 28–29, 2013. [Google Scholar]
- Davis A. K., Maney D. L., Maerz J. C. REVIEW: The use of leukocyte profiles to measure stress in vertebrates: A review for ecologists. Funct. Ecol. 2008;22:760–772. 10.1111/j.1365-2435.2008.01467.x. [Google Scholar]
- Davison T. F., Rowell J. G. Effects of corticosterone of peripheral lymphocyte and granulocyte populations in immature domestic fowl. Res. Vet. Sci. 1983;34:236–239. [PubMed] [Google Scholar]
- Dhabhar F. S. A hassle a day may keep the pathogens away: The fight-or-flight stress response and the augmentation of immune function. Integr. Comp. Biol. 2009;49:215–236. doi: 10.1093/icb/icp045. 10.1093/icb/icp045. [DOI] [PubMed] [Google Scholar]
- Gross W. B. Factors affecting chicken thrombocyte morphology and the relationship with heterophil: lymphocyte ratios. Br. Poult. Sci. 1989;30:919–925. doi: 10.1080/00071668908417218. [DOI] [PubMed] [Google Scholar]
- Gross W. B., Siegel H. S. Evaluation of the heterophil lymphocyte ratio as a measure of stress in chickens. Avian Dis. 1983;27:972–979. [PubMed] [Google Scholar]
- Gross W. B., Siegel P. B. Effects of initial and second periods of fasting on heterophil/lymphocyte ratios and body weight. Avian Dis. 1986;30:345–346. [PubMed] [Google Scholar]
- Jones D. R., Karcher D. M., Abdo Z. Effect of a commercial housing system on egg quality during extended storage. Poult. Sci. 2014;93:1282–1288. doi: 10.3382/ps.2013-03631. 10.3382/ps.2013-03631. [DOI] [PubMed] [Google Scholar]
- Lucas A. M., Jamroz C. Washington, DC: USDA; 1961. Atlas of Avian Hematology. Monograph 25. [Google Scholar]


