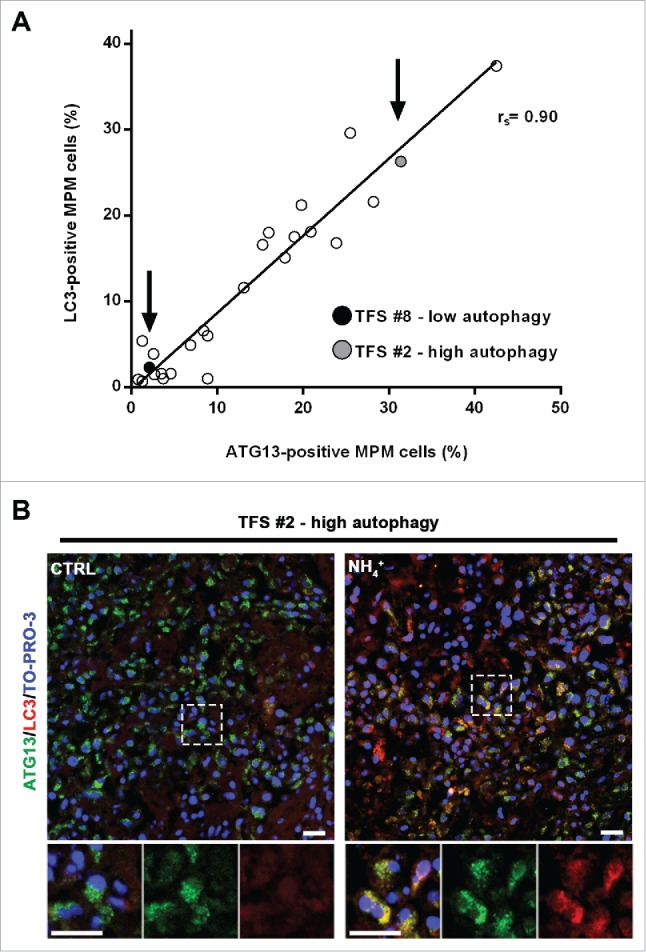
Figure 6.

In tumor fragment spheroids, autophagy initiation correlates with the autophagic flux. (A) TFS exposed to NH4+ were stained for LC3 and the same TFS not exposed to NH4+ were stained for ATG13; both were stained for KRT/cytokeratin to identify the mesothelioma cells. The correlation plot of the percentages of LC3-positive MPM cells (y axis, TFS grown in the presence of NH4+) relative to that of ATG13-positive MPM cells (x axis, TFS grown without NH4+) is shown. Arrows identify the position of the representative low autophagy TFS (#8, black circle) and high autophagy TFS (#2, gray circle), previously shown on Figures 4 and 5. Spearman rank correlation (rs), 0.8997; P (2-tailed)< 0.0001. (B) TFS grown in the presence or absence of NH4+ for 12 h were stained for ATG13 (green), LC3A/B (red), and nuclei (blue) and imaged by confocal microscopy. ATG13 and LC3A/B double immunostaining images of a representative TFS with high autophagy levels (TFS #2) grown in the presence (NH4+) or absence of the lysosomal inhibitor (CTRL) are shown. Zoom-in views of the regions in the dashed boxes are shown for representative cells. Scale bars: 10 µm.
