Abstract
Background/Aim:
To establish L, M, and S parameters and z score reference for the assessment of nutrition and growth of Saudi school-age children and adolescents.
Subjects and Methods:
Data from the original cross-sectional study were reanalyzed. The L, M, and S parameters and z scores were calculated for weight, height and body mass index for school-age children and adolescents.
Results:
A total of 19,299 subjects from 5 to 18 years of age were included. All were Saudi nationals and 9,827 (50.9%) were boys. The L M S parameters and z scores for weight for age, height for age, and BMI for age for boys and girls are presented in detailed tables across the age of commonly used z scores (+3, +2, +1, 0, -1, -2, -3). Graphs corresponding to the same parameters (weight, height, and BMI) showing the main z scores across all ages from 5 to 18 years are illustrated.
Conclusion:
This report provides the first reference for nutritional status and growth of Saudi school-age children and adolescents. This tool is essential for more accurate assessment of growth and nutrition in various clinical conditions and research.
Key Words: Growth, nutritional status, Z score reference
Assessment of nutritional status and growth of children and adolescents using growth charts is an important part of clinical practice. The history of development of growth charts dates back to the end of the 18th century, with continued improvements mainly in terms of statistical methods and chart design.[1] The National Center for Health Statistics (NCHS) set of growth charts was the first to be endorsed by the World Health Organization (WHO), and was designated as NCHS/WHO growth charts and recommended for international use in 1978.[2,3] However, because of the increasing awareness of shortcomings of the existing charts and the secular trends in growth, the Center for Disease Control (CDC) revised and updated NCHS growth charts and published in 2000, the CDC 2000 reference growth charts for the United States of America (USA) children and adolescents.[4] Similarly, the WHO, recognizing that the CDC 2000 is designed for children in USA, decided to create growth charts for school age children and adolescents that align with the WHO Child Growth Standards for preschool children. The latter was based on a more international multiethnic sample.[5] After consideration of several growth charts, it was found that the NCHS data aligned best with the WHO preschool standards. Therefore, data from the NCHS were reanalyzed using state-of-the-art statistical methods to develop the WHO Growth Reference Charts for School-age Children and Adolescents in 2007.[6] Although the CDC 2000 and WHO growth reference charts are commonly used worldwide, many countries have created their local national charts.[7,8,9,10] Growth charts have been developed for the Kingdom of Saudi Arabia (KSA), and are recommended for use in hospitals and clinics.[11] However, the latter did not report z-score values of the main growth indicators. Therefore, the objective of this analysis was to report the L, M, and S parameters and z score tables and graphs of a representative sample of Saudi school-age children and adolescents.
SUBJECTS AND METHODS
The design and methodology of the original study have been published elsewhere.[11] In summary, random sampling methodology was used to select a representative sample from the 13 regions of the KSA. Only healthy children, as determined clinically by physicians, were eligible for body measurements. Age was converted to Gregorian to conform with the international studies. Weight was measured in kilograms (kg) and height in centimeters (cm). Body mass index (BMI) was calculated using the formula: BMI = Weight (kg)/Height2 (cm).
Statistical analysis
In order to determine the standard deviation (−3 to +3) of weight, height, and BMI for boys and girls, school-age children, and adolescents 5 to 18 years of age, the L, M, and S method was used. The LMS parameters are the median (M), the generalized coefficient of variation (S), and the power in the Box–Cox transformation (L). The Box–Cox transformation is used to adjust the distribution of anthropometric data to a normal distribution. The method models the data taking into consideration the degree of skewness (L), central tendency (M), and dispersion (S). The L, M, and S parameters are calculated and smoothed according to the method of maximum penalized likelihood.[12,13,14] Z score and percentiles were calculated according to the following formula.[13]
P = M [1 + LSZ]1/L, L ≠ 0
where L, M, and S are the values from the appropriate table corresponding to the age, in years, of the child. Z is the z-score that corresponds to the percentile.
For the present analysis, we have calculated the z-score values of −3, −2, −1, 0, +1, +2, +3 for weight, height, and BMI for age. Data processing was performed using the LMS Chart Maker Light 2.1 (Medical Research Council, London, UK). The goodness of fit of all L, M, and S models was assessed using Q-test.[15]
Ethics
This study is a part of the national health profile of Saudi children and adolescents approved by the King Abdul Aziz City for Science and Technology, Riyadh, Kingdom of Saudi Arabia.
RESULTS
In this study, there were 19,299 Saudi children and adolescents aged 5 to 18 years, with 9,827 (50.9%) boys. Table 1 shows the L, M, and S parameters and z scores for weight for age for boys aged 5 to 13 years. Table 2 illustrates the same parameters for height for age for boys aged 5 to 18 years, and Table 3 shows the same parameters for BMI for age for boys aged 5 to 18 years. Similarly, Table 4 shows the L, M, and S parameters and z scores for weight for age for girls aged 5 to 13 years. Table 5 illustrates the same parameters for height for age for girls aged 5 to 18 years, and Table 6 shows the same parameters for BMI for age for girls aged 5 to 18 years.
Table 1.
L, M, and S parameters and z scores for weight for age: Boys 5-13 years

Table 2.
L, M, and S parameters and Z scores for height for age: Boys 5 to 18 years
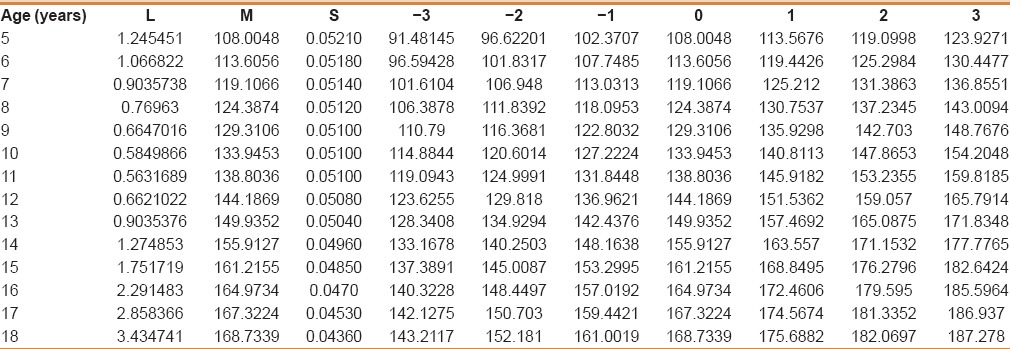
Table 3.
L, M, and S parameters and z scores for body mass index for age: Boys 5-18 years
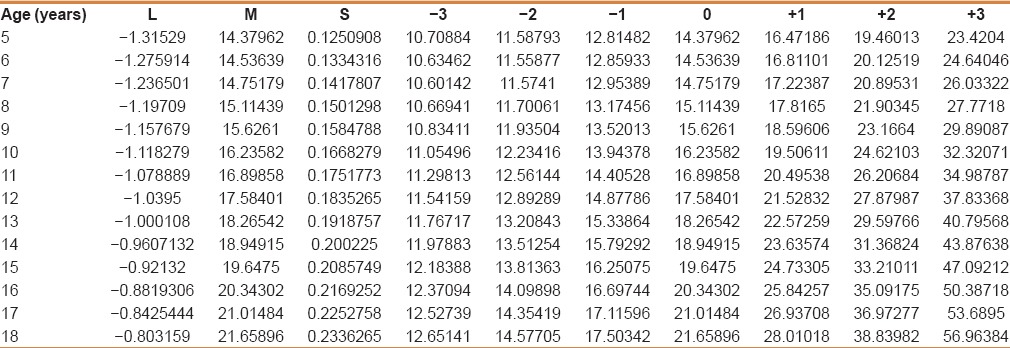
Table 4.
L, M, and S parameters and z scores for weight for age: Girls 5-13 years

Table 5.
L, M, and S parameters and Z scores for height for age: Girls 5 to 18 years
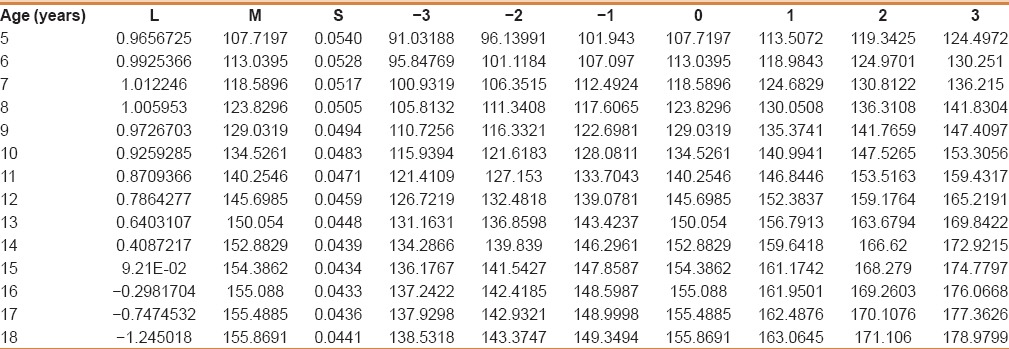
Table 6.
L, M, and S parameters and z scores for body mass index for age: Girls 5-18 years
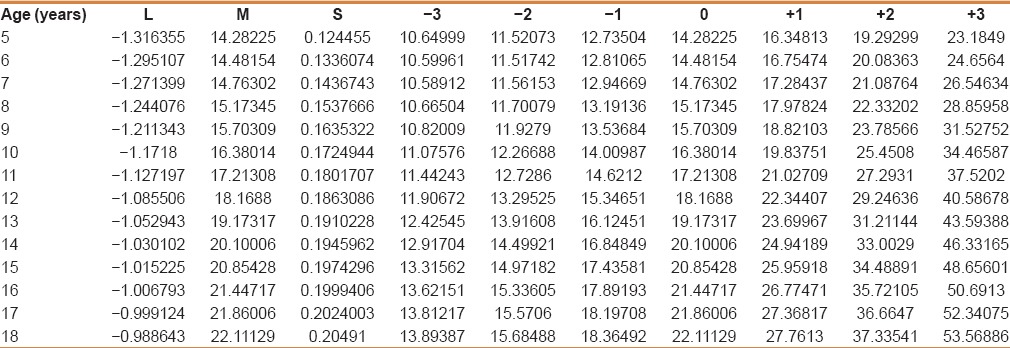
Figure 1 displays z scores for weight for age for boys aged 5 to 13 years. Figure 2 shows the same parameters for height for age for boys aged 5 to 18 years, and Figure 3 depicts the same parameters for BMI for age for boys aged 5 to 18 years. Similarly, Figure 4 shows z scores for weight for age for girls aged 5 to 13 years. Figure 5 illustrates the same parameters for height for age for girls aged 5 to 18 years, and Figure 6 shows the same parameters for BMI for age for girls aged 5 to 18 years.
Figure 1.
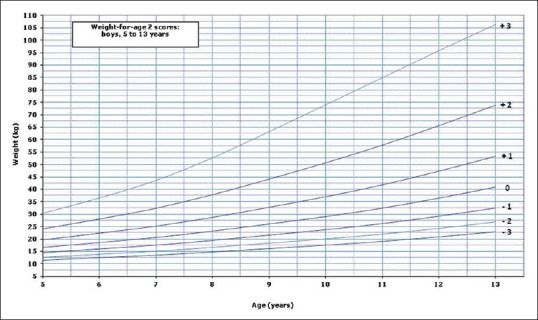
Weight for age z scores for boys
Figure 2.
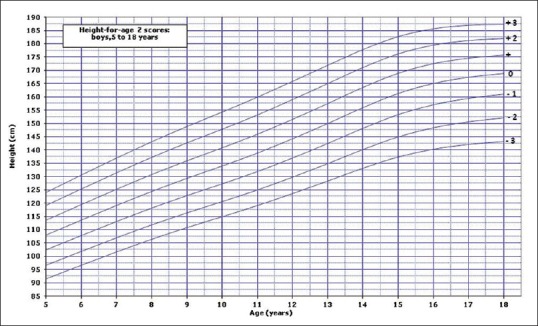
Height for age z scores for boys
Figure 3.
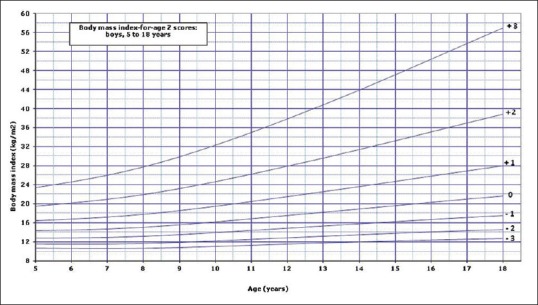
Body mass index for age z scores for boys
Figure 4.
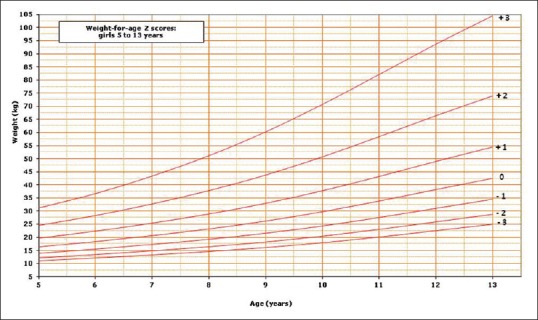
Weight for age z scores for girls
Figure 5.
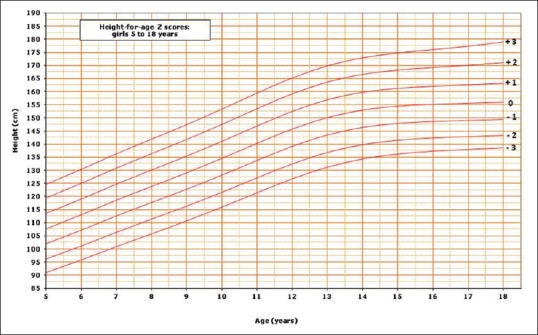
Height for age z scores for girls
Figure 6.
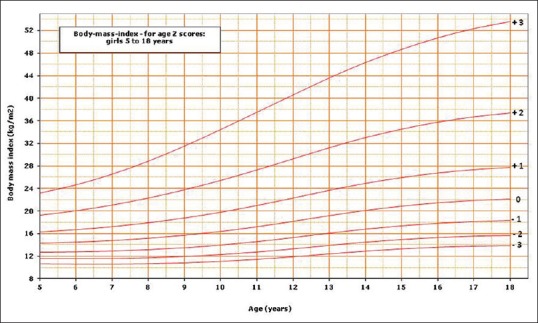
Body mass index for age z scores for girls
DISCUSSION
In a recent systematic review, worldwide variations of human growth was demonstrated, indicating the risks of using a single reference growth chart in all countries.[16] In fact, the same remarks have been reported in previous studies from the KSA indicating the difference in growth between children in the USA and KSA.[17,18,19] This was confirmed in two recent reports regarding the implications of using the CDC or WHO growth charts for the assessment of nutrition and growth of Saudi children, potentially exaggerating the prevalence of short stature and malnutrition.[20,21]
The z score (standard deviation score) is considered the best system for presentation and analysis of anthropometric data both at the individual and population levels.[3] The LMS parameters and z score growth reference is an important tool for research and health care. Children and adolescents are growing subjects and regular evaluation of their growth and nutritional status is mandatory. This is especially true for those affected by chronic medical conditions known to affect growth and nutrition such as inflammatory bowel disease. In addition, availability of the LMS parameters of z scores allows the incorporation of growth charts in electronic hospital and clinic records.
To our knowledge, neither L, M, and S parameters nor z-score tables and corresponding growth charts have been reported in Saudi school-age children and adolescents. Z score reference data presented in this report include the most commonly used growth indicators such as weight for age, height for age, and BMI for age. Because of the pubertal growth spurt, weight for age is not an accurate measure of nutritional status beyond 11–12 years. Therefore, this indicator was not calculated beyond 13 years of age. The availability of this reference allows not only more accurate assessment but also comparison with other populations using their local growth chart references. In addition, the application of WHO definition of growth and nutritional disorders in Saudi school-age children and adolescents, individuals or groups, is now possible using the Saudi z-score reference described in this article. Accordingly, short stature is defined by z score < −2 standard deviation (SD), overweight by BMI > +1 SD, obesity by BMI > +2 SD, and thinness by BMI < −2 SD.[22]
CONCLUSION
The availability of L, M, and S parameters' z scores tables and charts for height for age, BMI for age, and to lesser extent weight for age for school-age children and adolescent is an important landmark for research and health care. This population-based reference provides a tool for more accurate assessment of nutritional status and growth of Saudi school-age children and adolescents in various clinical conditions and research.
Financial support and sponsorship
The Deanship of Scientific Research, King Saud University, through Research Group # RG-1436-007.
Conflicts of interest
There are no conflicts of interest.
Acknowledgments
The authors extend their appreciations to the Deanship of Scientific Research at King Saud University for funding this work through Research Group No. RG-1436-007. The authors also thank Dr Shaffi Ahamed Shaik for performing statistical analysis.
REFERENCES
- 1.Cole TJ. The development of growth references and growth charts. Ann Hum Biol. 2012;39:382–94. doi: 10.3109/03014460.2012.694475. [DOI] [PMC free article] [PubMed] [Google Scholar]
- 2.Hamill PV, Drizd TA, Johnson CL, Reed RB, Roche AF, Moore WM. Physical growth: National Center for Health Statistics percentiles. Am J Clin Nutr. 1979;32:607–29. doi: 10.1093/ajcn/32.3.607. [DOI] [PubMed] [Google Scholar]
- 3.Physical status: The use and interpretation of anthropometry. Report of a WHO Expert Committee. World Health Organ Tech Rep Ser. 1995;854:1–452. [PubMed] [Google Scholar]
- 4.Kuczmarski RJ, Ogden CL, Guo SS, Grummer-Strawn LM, Flegal KM, Mei Z, et al. 2000 CDC Growth Charts for the United States: Methods and development. Vital Health Stat. 2002;11:1–190. [PubMed] [Google Scholar]
- 5.de Onis M, Onyango A, Borghi E, Siyam A, Pinol A. Department of Nutrition for Health and Development. Geneva, Switzerland: WHO; 2006. The WHO Child Growth Standard: Methods and Development. [Google Scholar]
- 6.de Onis M, Onyango AW, Borghi E, Siyam A, Nishida C, Siekmann J. Development of a WHO growth reference for school-aged children and adolescents. Bull World Health Organ. 2007;85:660–7. doi: 10.2471/BLT.07.043497. [DOI] [PMC free article] [PubMed] [Google Scholar]
- 7.Bonthuis M, van Stralen KJ, Verrina E, Edefonti A, Molchanova EA, Hokken-Koelega AC, et al. Use of national and international growth charts for studying height in European children: Development of up-to-date European height-for-age charts. PLoS One. 2012;7:e42506. doi: 10.1371/journal.pone.0042506. [DOI] [PMC free article] [PubMed] [Google Scholar]
- 8.Tinggaard J, Aksglaede L, Sørensen K, Mouritsen A, Wohlfahrt-Veje C, Hagen CP, et al. The 2014 Danish references from birth to 20 years for height, weight and body mass index. Acta Paediatr. 2014;103:214–24. doi: 10.1111/apa.12468. [DOI] [PubMed] [Google Scholar]
- 9.Indian Academy of Pediatrics Growth Charts Committee. Khadilkar V, Yadav S, Agrawal KK, Tamboli S, Banerjee M, et al. Revised IAP growth charts for height, weight and body mass index for 5- to 18-year-old Indian children. Indian Pediatr. 2015;52:47–55. doi: 10.1007/s13312-015-0566-5. [DOI] [PubMed] [Google Scholar]
- 10.Zong XN, Li H. Construction of a new growth references for China based on urban Chinese children: Comparison with the WHO growth standards. PLoS One. 2013;8:e59569. doi: 10.1371/journal.pone.0059569. [DOI] [PMC free article] [PubMed] [Google Scholar]
- 11.El-Mouzan MI, Al-Herbish AS, Al-Salloum AA, Qurachi MM, Al-Omar AA. Growth charts for Saudi children and adolescents. Saudi Med J. 2007;28:1555–68. [PubMed] [Google Scholar]
- 12.Cole TJ, Green PJ. Smoothing reference centile curves: The LMS method and penalized likelihood. Stat Med. 1992;11:1305–19. doi: 10.1002/sim.4780111005. [DOI] [PubMed] [Google Scholar]
- 13.Cole TJ, Freeman JV, Preece MA. British 1990 growth reference centiles for weight, height, body mass index and head circumference fitted by maximum penalized likelihood. Stat Med. 1998;17:407–29. [PubMed] [Google Scholar]
- 14.Rigby RA, Stasinopoulos DM. Generalized additive models for location, scale and shape. Appl Stat. 2005;64:507–54. [Google Scholar]
- 15.Pan H, Cole TJ. A comparison of goodness of fit tests for age-related reference ranges. Stat Med. 2004;23:1749–65. doi: 10.1002/sim.1692. [DOI] [PubMed] [Google Scholar]
- 16.Natale V, Rajagopalan A. Worldwide variation in human growth and the World Health Organization growth standards: A systematic review. BMJ Open. 2014;4:e003735. doi: 10.1136/bmjopen-2013-003735. [DOI] [PMC free article] [PubMed] [Google Scholar]
- 17.Al Sekait MA, Al Nasser AN, Bamgboye EA. The growth pattern of schoolchildren in Saudi Arabia. Saudi Med J. 1992;13:141–6. [Google Scholar]
- 18.al-Nuaim AR, Bamgboye EA, al-Herbish A. The pattern of growth and obesity in Saudi Arabian male school children. Int J Obes Relat Metab Disord. 1996;20:1000–5. [PubMed] [Google Scholar]
- 19.Al-Mazrou YY, Al-Amoud MM, El-Gizouli SE, Khoja T, Al-Turki K, Tantawi NE, et al. Comparison of the growth standards between Saudi and American children aged 0-5 years. Saudi Med J. 2003;24:598–602. [PubMed] [Google Scholar]
- 20.El Mouzan MI, Foster PJ, Al-Herbish AS, Al-Salloum AA, Al-Omar AA, Qurachi MM, et al. The implication of using the World Health Organization child growth standards in Saudi Arabia. Nutr Today. 2009;44:62–70. [Google Scholar]
- 21.El Mouzan MI, Al Herbish AS, Al Salloum AA, Foster PJ, Al Omar AA, Qurachi MM, et al. Comparison of the 2005 growth charts for Saudi children and adolescents to the 2000 CDC growth charts. Ann Saudi Med. 2008;28:334–40. doi: 10.5144/0256-4947.2008.334. [DOI] [PMC free article] [PubMed] [Google Scholar]
- 22.World Health Organization. Training course on child growth assessment. Geneva: WHO; 2008. [Google Scholar]


