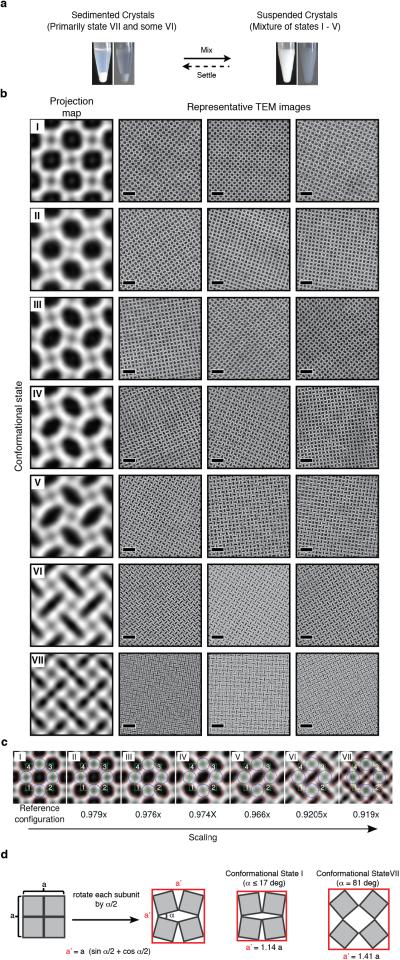
Extended Data Figure 10. Conformational analysis of C98RhuA lattices.
a, Photographs of sedimented and resuspended C98RhuA crystals (alternative views with different backgrounds are shown for clarity). b, Representative TEM images for different conformational states (I – VII) of C98RhuA crystals shown in Fig. 3. Scale bars are 25 nm in all panels. c, Digital image processing of reconstructed images of each conformational state. Red lines represent the border of the pores in the lattice structure. Selected RVEs are shown with green lines. Blue lines show the circles circumscribed to the square RhuA building block. Values of scaling between TEM images (with conformational state I as reference) are shown below each image. d, Changes in the dimensions of a C98RhuA lattice of arbitrary size assuming a rotating-rigid-squares model.

