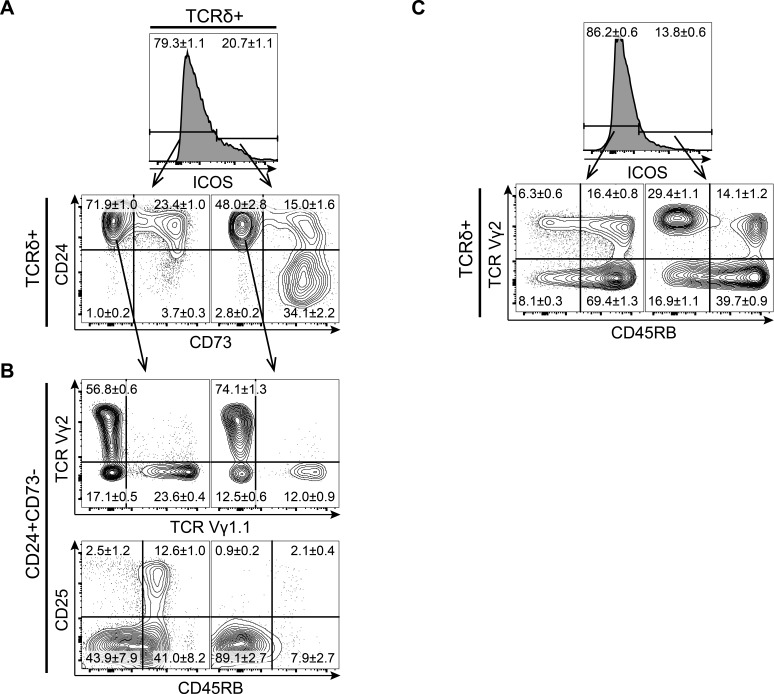
Figure 2. ICOS is expressed by a large subset of immature γδ T cells enriched for Vγ2+ CD45RB- cells.
Representative flow cytometric plots of CD4/CD8 depleted thymocytes or inguinal lymph nodes lymphocytes isolated from 7-8 weeks old mice and stained for ICOS, TCRδ, TCRβ, TCR Vγ2, TCR Vγ1.1, CD24, CD25, CD45RB and CD73. A. Expression of the maturation markers CD24 and CD73 on ICOS− (left) and ICOS+ (right) cells within CD4/CD8 DN γδ T cells. B. Expression of TCR Vγ1.1, TCR Vγ2, CD25 and CD45RB within ICOS− (left) and ICOS+ (right) immature CD24+CD73− γδ T cells, (n = 8). C. Expression of TCR Vγ2 and CD45RB within ICOS− (left) and ICOS+ (right) γδ T cells from inguinal lymph nodes, (n = 6). Numbers denote mean percentage ± SEM of the gated populations.

