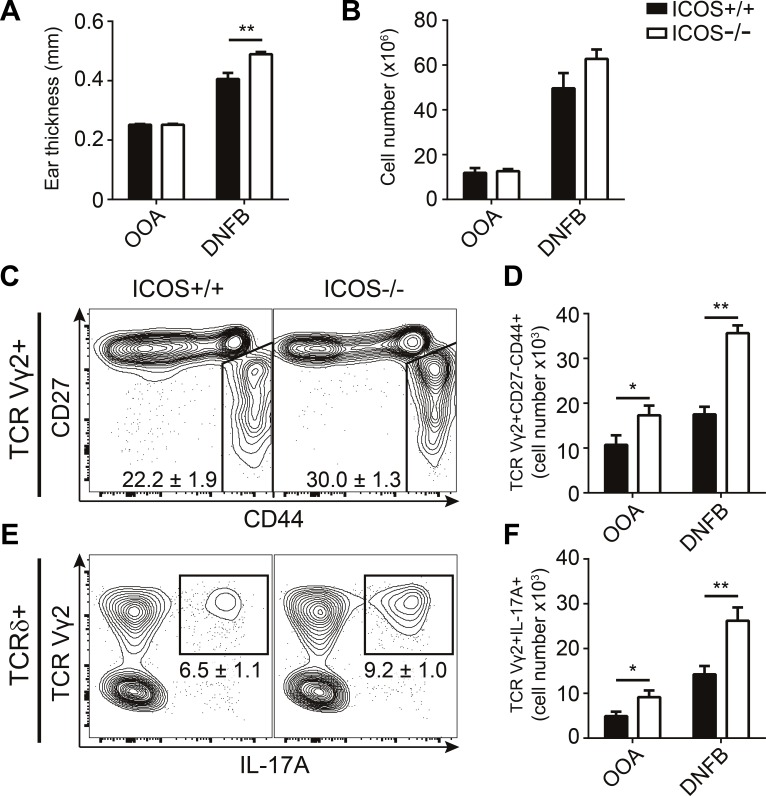
Figure 6. ICOS−/− mice exhibit exacerbated responses during sensitization with DNFB.
Comparison of sensitization response to DNFB in ICOS+/+ and ICOS−/− mice. A. Ear swelling measurements at day 5 after three consecutive days (day 0-2) treatments with DNFB or OOA (vehicle control). B. Quantification of lymphocyte numbers in the draining lymph nodes (dLN) of treated mice at day 5. C. Representative flow cytometric plots from DNFB treated mice showing CD27 and CD44 expression within TCR Vγ2+ γδ T cells from the dLN. D. Quantification of the number of TCR Vγ2+CD27−CD44+ γδ T cells. E. Representative flow cytometric plots from DNFB treated mice showing IL-17A and TCR Vγ2 expression in γδ T cells from dLN stimulated with PMA and ionomycin. F. Quantification of the number of TCR Vγ2+IL-17A+ γδ T cells in dLN after re-stimulation with PMA and ionomycin. Bars and numbers denote mean ± SEM from two independent experiments (n = 6).

