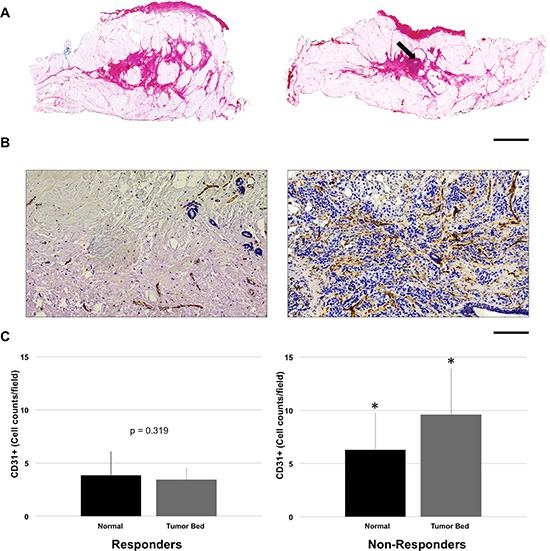
Figure 7. Representative comparison of responder and non-responder based on pathological examination.

(A) Reduction in the bulk tumor size in responder (left) and minimal reduction in non-responder (right, arrow); H & E stain, scale bar = 2.0 cm. (B) Reduction in vascular density within the tumor in responder (left) as compared to non-responder (right); CD31 immunostain, Scale bar = 200 μm. (C) Vessel quantification: For non-responders, there was significantly higher vascular staining in the tumor bed compared to normal breast tissue (p < 0.05). In contrast for responders, vessel counts per field showed insignificant differences (p = 0.319) between the tumor bed and normal tissue. Error bars = Standard deviation. *p < 0.05, within group comparison.
