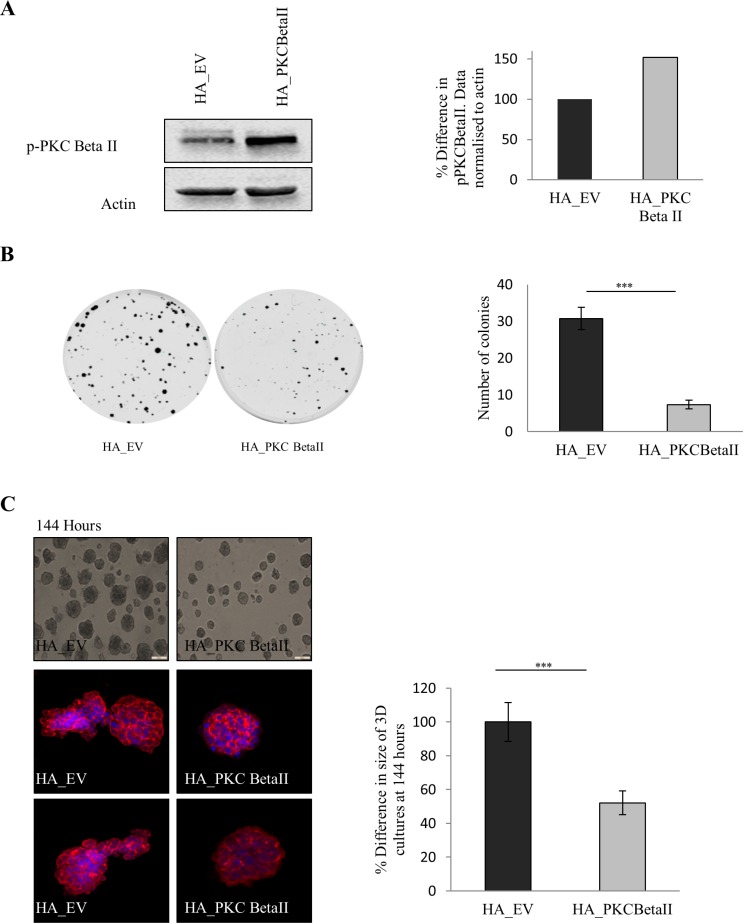
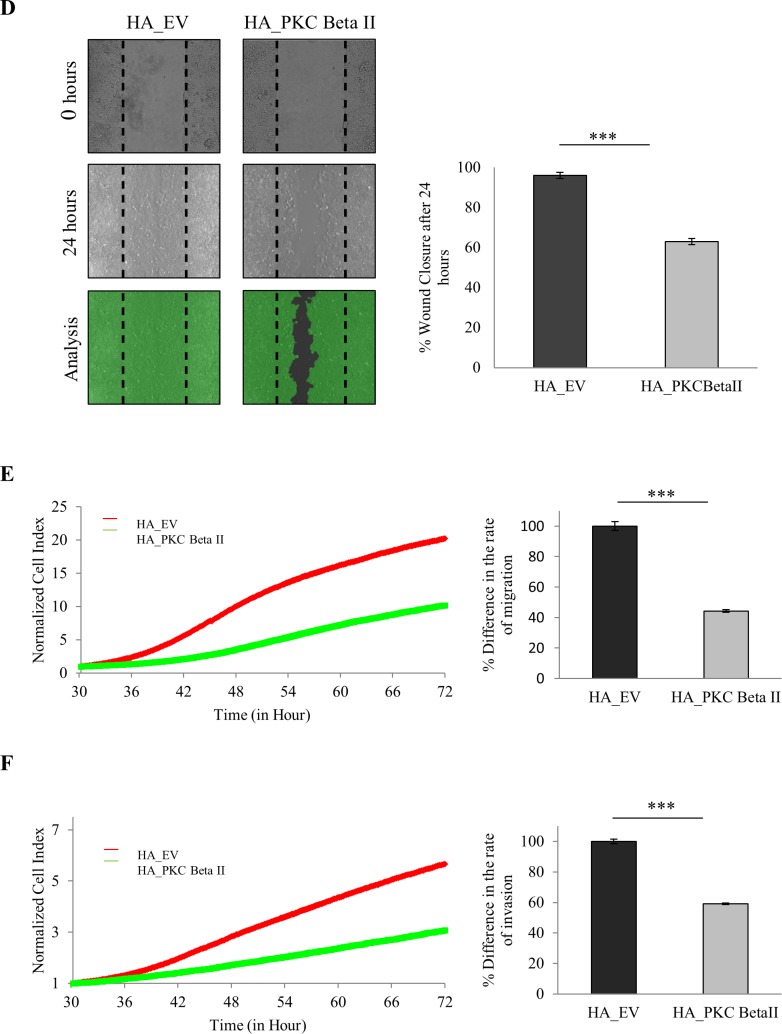
Figure 4. Effect of overexpression of PKC Beta II on colon cancer cells.
The effect of overexpressing PKC Beta II in colon cancer cells was examined using HCT116 cells stably over expressing HA_PKCBeta II. (A) Representative western blot showing the expression of p-PKC Beta II in stable overexpressing HCT116 cells (n = 3). (B) Representative images demonstrating the difference in the cells ability to form colonies when overexpressing PKC Beta II (n = 3). (C) Images demonstrating the difference in the size of cells growing in a 3D matrix over 144 hours (n = 3). Bar graph represents the percentage difference in the size of 3D cultures at 144 hours. Confocal images are cells harvested and stained after 144 hours (n = 3). (D) Representative image of cells that were scored with a wound and allowed to migrate over 24 hours. Bar graph represents the percentage wound closer after 24 hours (n = 3). (E) Representative graph of cells migrating over a period of 72 hours analysed in real time on the xCELLigence system (n = 3). Bar graph represents the percentage difference in cell index. (F) Representative graph of cells invading over a period of 72 hours analysed in real time on the xCELLigence system (n = 3). Bar graph represents the percentage difference in cell index.


