

Summary
Recently, there has been considerable interest in using 4‐methylumbelliferone (4‐MU) to inhibit hyaluronan (HA) synthesis in mouse models of cancer, autoimmunity and a variety of other inflammatory disorders where HA has been implicated in disease pathogenesis. In order to facilitate future studies in this area, we have examined the dosing, treatment route, treatment duration and metabolism of 4‐MU in both C57BL/6 and BALB/c mice. Mice fed chow containing 5% 4‐MU, a dose calculated to deliver 250 mg/mouse/day, initially lose substantial weight but typically resume normal weight gain after 1 week. It also takes up to a week to see a reduction in serum HA in these animals, indicating that at least a 1‐week loading period on the drug is required for most protocols. At steady state, more than 90% of the drug is present in plasma as the glucuronidated metabolite 4‐methylumbelliferyl glucuronide (4‐MUG), with the sulphated metabolite, 4‐methylumbelliferyl sulphate (4‐MUS) comprising most of the remainder. Chow containing 5% but not 0·65% 4‐MU was effective at preventing disease in the experimental autoimmune encephalomyelitis (EAE) mouse model of multiple sclerosis, as well as in the DORmO mouse model of autoimmune diabetes. While oral 4‐MU was effective at preventing EAE, daily intraperitoneal injections of 4‐MU were not. Factors potentially affecting 4‐MU uptake and plasma concentrations in mice include its taste, short half‐life and low bioavailability. These studies provide a practical resource for implementing oral 4‐MU treatment protocols in mice.
Keywords: 4‐methylumbelliferone, autoimmunity, hyaluronan, hymecromone
Introduction
Hyaluronan (HA) is an extracellular matrix (ECM) glycosaminoglycan (GAG) with many roles in normal tissue function and development 1, 2, 3. HA is synthesized by three independently regulated hyaluronan synthase (HAS) proteins, which generate predominantly high molecular weight HA (HMW‐HA) of >5×10⁵ Da 4. These enzymes lengthen hyaluronan by adding uridine diphosphate (UDP)‐glucuronic acid and UDP‐N‐acetyl‐glucosamine repeatedly to the anchored UDP‐reducing end of the nascent hyaluronan polysaccharide as it is extruded through the cell membrane into the extracellular space 4. HA levels are elevated greatly in injured tissues and this accumulation of HA is thought to contribute to inflammation in many chronic diseases, including type 2 diabetes 5, 6, multiple sclerosis (MS) 7 and others 8, 9, 10.
Recently, we reported that insulitis in autoimmune type 1 diabetes (T1D) was associated with islet‐specific deposition of HA 11. We have made similar observations in animal models of autoimmune diabetes, including non‐obese diabetic (NOD) mice 12 and D011.10xRIPmOVA (DORmO) mice 13. Together with recently published histological and biochemical analyses by our group and others of islet ECM in non‐diabetic human and murine islets 14, 15, these data implicate HA and islet ECM in the onset of T1D.
Similarly, HA is highly abundant within central nervous system (CNS) tissues under autoimmune attack. High levels of HA are present within demyelinated lesions in MS and in the model of the disease, experimental autoimmune encephalomyelitis (EAE), where it facilitates the extravasation of activated T cells into the CNS 7, 16. HA has also been implicated in other autoimmune diseases, including rheumatoid arthritis 17 and lupus 18.
HA is known to have substantial effects on immune phenotypes. At sites of inflammation HA typically takes the form of catabolized low molecular weight fragments (LMW‐HA), which trigger damage‐associated pattern recognition receptors, such as Toll‐like receptors 2 and 4 (TLR‐2, TLR‐4) 19, 20, 21. This, in turn, drives the activation and maturation of dendritic cells (DC) 22, the release of proinflammatory chemokines and cytokines 23, 24, and proliferation 25 and migration 26 of leukocytes. These signals may be particularly relevant in settings of sterile inflammation 27, 28. HA and its receptor interactions are also known to influence both the number and function of the T cell effector subsets that both drive and prevent autoimmunity 29, 30, 31, 32, 33, 34, 35.
Based on HA's role as an inflammatory mediator, there has been an increasing number of studies targeting HA synthesis using the small molecule inhibitor of HA synthesis 4‐methylumbelliferone (4‐MU) 36. This drug has been shown to inhibit HA production in multiple cell lines and tissue types both in vitro and in vivo 17, 37, 38, 39, 40. We have reported that 4‐MU treatment prevented or reversed autoimmune disease in mouse models of T1D and MS 13, 16.
4‐MU is thought to inhibit HA production in at least two ways. First, it functions as a competitive substrate for UDP‐glucuronyltransferase (UGT), an enzyme involved in HA synthesis 41. When 4‐MU is present, UGT conjugates glucuronic acid to 4‐MU, resulting in 4‐MU‐glucuronide (4‐MUG), rather than forming UDP‐glucuronic acid, one of the two precursors of HA, consequently inhibiting its synthesis. Secondly, 4‐MU reduces expression of HAS mRNA as well as mRNA for UDP glucose pyrophosphorylase and dehydrogenase 42. The pharmacokinetics and metabolism of 4‐MU in humans are well characterized, as detailed in our recent review on the therapeutic potential of 4‐MU 36. This reflects the extensive study of 4‐MU that was performed in the course of its approval as a therapeutic agent in humans. Under the name ‘hymecromone’, it is used in multiple countries in Europe mainly as a treatment for bile disorders, due to its choleretic and biliary anti‐spasmodic activity 43.
Here, we have addressed several practical issues pertaining to the use of 4‐MU in mouse models that have arisen during the course of our recent studies of this molecule. These issues include the dosing, treatment duration, metabolism and plasma drug levels of 4‐MU. In contrast to previous rodent pharmacokinetic studies with 4‐MU given intravenously (i.v.) 44, we present data on the bioavailability of 4‐MU when given as an oral supplement, providing a practical resource to facilitate further studies of 4‐MU in mouse models of autoimmunity and other diseases.
Materials and methods
Mice
All animals were bred and maintained under specific pathogen‐free conditions, with free access to food and water, in the vivarium at the Benaroya Research Institute (Seattle, WA, USA) and the animal facilities at Stanford University Medical School (Stanford, CA, USA). DO11.10 transgenic mice were purchased from The Jackson Laboratory (Bar Harbor, ME, USA) and bred with BALB/c mice expressing RIPmOVA (available at the Benaroya Research Institute) to generate the DORmO double‐transgenic mice. All animal experiments and use procedures were approved by the Institutional Animal Care and Use Committee at the Benaroya Research Institute and/or at Stanford University Medical School.
4‐MU treatment
4‐MU (Alfa Aesar, Haverhill, MA, USA) was pressed at 5% (w/w) into mouse chow by TestDiet® (St. Louis, MO, USA) and irradiated before shipment, as described previously 37. This dose was calculated previously to deliver approximately 150–250 mg/mouse/day 37. Mice were initiated on the 4‐MU chow between 5 and 6 weeks of age, unless noted otherwise, and were maintained on this diet until they were euthanized, unless noted otherwise.
Pharmacokinetics of 4‐MU
Mice were placed on chow containing 5% (w/w) 4‐MU for 2 weeks, after which groups of three mice were euthanized every 4 h by cardiac puncture under 2,2,2‐tribromoethanol anaesthesia. Blood was collected in heparin‐coated syringes and kept at 4°C until spun down to collect the plasma. Plasma levels of 4‐MU, 4‐MUG and 4‐MUS were determined by high‐performance liquid chromatography (HPLC)‐mass spectrometry.
Induction of EAE
EAE was induced in female C57BL/6 mice (The Jackson Laboratory) at 8–12 weeks of age by subcutaneous immunization in the flank with an emulsion containing 200 μg of myelin oligodendrocyte glycoprotein peptide 35–55 (MOG35–55) in saline and an equal volume of complete Freund's adjuvant (CFA) containing 400 ng of mycobacterium tuberculosis H37RA (Difco Laboratories, Detroit, MI, USA). All mice were administered 400 ng of pertussis toxin (List Biological, Campbell, CA, USA) intraperitoneally (i.p.) at 0 and 48 h post‐immunization. Mice were given food and water ad libitum and were weighed and monitored daily for clinical symptoms as follows: 0, no clinical disease; 1, tail weakness; 2, hindlimb weakness; 3, complete hindlimb paralysis; 4, hindlimb paralysis and some forelimb weakness; 5, moribund or dead. Mice were given 4‐MU chow starting 4 days before immunization, or were injected i.p. once daily with 1 mg of 4‐MU in 200 μl 0.08% carboxymethylcellulose (4‐MU was diluted ×100 from a stock solution in dimethyl sulphoxide), as described in the figure legends.
Weight and diabetes monitoring
Beginning at 6 weeks of age, mice were weighed daily both before and after the administration of 4‐MU chow. For blood glucose measurements, mice were bled via the saphenous vein or tail vein for the determination of their blood glucose level using a Contour blood glucose meter and blood glucose monitoring strips (Bayer Healthcare, Tarrytown, NY, USA). When two consecutive blood glucose readings of 250 mg/dl were recorded, animals were considered diabetic. When two consecutive blood glucose readings of 300 mg/dl were recorded, animals were euthanized.
HA quantification
Plasma samples were thawed and assayed for HA levels in triplicate in a single batch using a modified HA‐enzyme‐linked immunosorbent assay (ELISA), as described earlier 45. Briefly, total amount of HA was determined by a modified competitive ELISA‐like assay in which the samples to be assayed were first mixed with biotinylated HA‐binding protein (b‐HABP) and then added to HA‐coated microtitre plates, the final signal being inversely proportional to the level of hyaluronan added to the b‐HABP.
Immune cell activation and cytokine analysis
Mouse splenocytes were isolated from BALB/c mice, as described previously 16. Briefly, spleens were homogenized through a strainer and red blood cells were lysed in the cell suspensions. Splenocytes were then cultured in triplicate at 5 × 10⁶ cells/ml and stimulated with concanavalin A (ConA, 2 μg/ml) in RPMI‐1640 supplemented with L‐glutamine (2 mM), sodium pyruvate (1 mM), non‐essential amino acids (0·1 mM), penicillin (100 U/ml), streptomycin (0·1 mg/ml), 2‐mercaptoethanol (5 × 10⁻⁵ M) and 10% fetal bovine serum. Supernatants were collected after 48 h and cytokine levels were quantified using anti‐mouse OPTEIA ELISA kits from BD Pharmingen [San Jose, CA, USA; interferon (IFN)‐γ and interleukin (IL‐4)] and R&D Systems (Minneapolis, MN, USA; IL‐17).
Statistics
Data are expressed as means ± standard error of the mean (SEM) of n independent measurements. The comparison between two groups was performed with unpaired t‐tests for normally distributed data or a Mann–Whitney U‐test for non‐parametric data. A P‐value less than < 0·05 was considered statistically significant. Multiple group analysis was performed using analysis of variance (anova). Data analysis was performed with GraphPad Prism version 5·0 software.
Results
4‐MU‐mediated suppression of HA serum levels requires prolonged treatment
One practical question in using oral 4‐MU treatment in mice is how long it is necessary to treat animals to suppress HA production. To address this, we incorporated 5% 4‐MU into standard mouse chow, a formulation which we previously established delivers 250 mg/mouse/day 37. We then studied C57BL/6 mice given 5% 4‐MU chow over a 2‐week treatment period and tracked serum HA levels over this time.
We found that a significant decrease in serum HA levels was not seen until day 7 with this regimen (Fig. 1). Previously, we have shown that 4‐MU treatment reduces clinical symptoms significantly in both the DORmO model of T1D [using offspring of ovalbumin (OVA)‐specific T cell receptor transgenic DO11.10 mice crossed with RIPmOVA mice, which express OVA in conjunction with the insulin gene promoter] and the EAE model of MS 13, 16. The time–course in reduction of serum HA levels shown here is consistent with our functional biomarker data in these models, which indicated that a period of 2–7 days on 5% 4‐MU chow was required until full effects on blood glucose or neurological scores were seen 13, 16.
Figure 1.
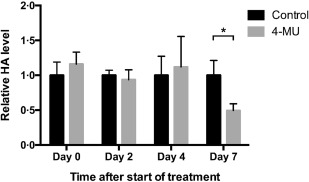
Kinetics of hyaluronan (HA) suppression in blood upon in‐vivo treatment with 4‐methylumbelliferone (4‐MU). C57BL/6 mice were fed chow containing 5% 4‐MU or control chow ad libitum. Serum from both treatment groups was taken at baseline (day 0) and on days 2, 4 and 7, and HA levels were measured in triplicate using an HA‐specific enzyme‐linked immunosorbent assay (ELISA) assay. *P < 0·05, n = 3–5 mice per group.
These data indicate that a pretreatment period is required in vivo if reduced HA serum levels are desired at disease‐onset in mouse models.
4‐MU induces temporary weight loss
To understand how consumption patterns influence oral intake of 4‐MU, we tracked weight and food intake of C57BL/6 and BALB/c mice fed 4‐MU versus control chow. 4‐MU chow evidently has a poor taste, as mice given chow without supplemental flavouring would not eat this at all (data not shown). Chocolate flavouring was required to render the chow palatable to mice. Even then, mice tended to shred the chow and not eat it for the first week. Consequently, they had a significant decrease in weight upon initiation of this treatment. After approximately 1 week they began eating the chow and gained weight at a similar pace to that of mice fed control chow. This was the case for both C57BL/6 (Fig. 2a) as well as BALB/c mice (Fig. 2b). We note that C57BL/6 mice tend to lose more weight on this regimen than BALB/c mice. A similar pattern was seen in two disease models, the MOG‐induced EAE model of MS (which uses C57BL/6 mice; Fig. 2c) and the DORmO model of autoimmune diabetes (which uses mice on a BALB/c background; Fig. 2d). In the DORmO model, the weight of mice fed 4‐MU chow eventually overtook those of mice fed control chow, due probably to 4‐MU‐mediated amelioration of disease severity in these mice 13, 16.
Figure 2.

Body weight is temporarily reduced in mice fed 4‐methylumbelliferone (4‐MU). (a,b). Body weight of C57BL/6 (a) and BALB/c (b) mice fed chow containing 5% 4‐MU or control chow. Mice were 9 weeks of age at the initiation of the experiment and were followed‐up to 16–17 weeks of age. (c). Body weight of C57BL/6 mice after induction of experimental autoimmune encephalomyelitis (EAE). Mice were fed chow containing 5% 4‐MU or control chow starting at 8 weeks of age (black arrow), 4 days before immunization (grey arrow). The dotted line depicts the onset of clinical symptoms in this model. (d). Body weight of D011.10xRIPmOVA (DORmO) mice fed chow containing 5% 4‐MU or control chow. Mice were 8 weeks of age at the initiation of the experiment and were followed‐up to 20 weeks of age, at which point 100% of DORmO mice fed control chow were diabetic, while none of the DORmO mice fed 4‐MU were. *P < 0·05, n = 7–12 animals per group.
These data indicate that a period of time is required to allow mice on 4‐MU to regain weight and normal food intake patterns and suggest that the time lag before serum HA is reduced on this treatment probably reflects limited initial 4‐MU chow intake.
Oral but not i.p. 4‐MU prevents autoimmunity
We demonstrated recently that 4‐MU treatment prevents autoimmune disease in the EAE mouse model of MS 16. We also examined whether the route of delivery impacted the efficacy of 4‐MU in this model. Indeed, we found that oral 4‐MU treatment inhibited disease (Fig. 3a), whereas once‐daily i.p. injections of 50 mg/kg 4‐MU (a dose estimated to be in the range of that reaching the blood by a 5% formulation of 4‐MU chow 37) did not (Fig. 3b).
Figure 3.
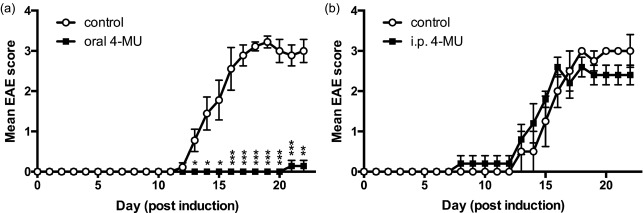
Oral but not intraperitoneal (i.p.) 4‐methylumbelliferone (4‐MU) delivery prevents autoimmunity. (a,b). Experimental autoimmune encephalomyelitis (EAE) scores of mice following treatment with 4‐MU delivered (a) in chow at 5% or (b) via daily i.p. injections of 50 mg/kg. *P < 0·05, **P < 0·01, ***P < 0·001, Mann–Whitney comparing treated mice with untreated mice (n = 5–10 animals per group).
These data indicate that processes involved in uptake of 4‐MU through oral administration contribute to its therapeutic efficacy.
4‐MU is rapidly metabolized in vivo
We next sought to quantify 4‐MU and its metabolites in the plasma of mice receiving a stable oral dose of 4‐MU. Metabolism of 4‐MU occurs via conjugation to either a glucuronic acid to form 4‐MUG or a sulphate, forming 4‐MU sulphate (4‐MUS) (Fig. 4a). We allowed mice to acclimate to 5% 4‐MU chow for 2 weeks prior to analysing plasma levels. We then sampled plasma from these animals at frequent intervals over a 24‐h time‐period. Upon sampling, we found that plasma drug concentrations of 4‐MU were quite low in mice on 5% 4‐MU chow, averaging 0·89 ± 0·51 µg/ml (5·1 ± 2·9 µM) over 24 h (Fig. 4b).
Figure 4.
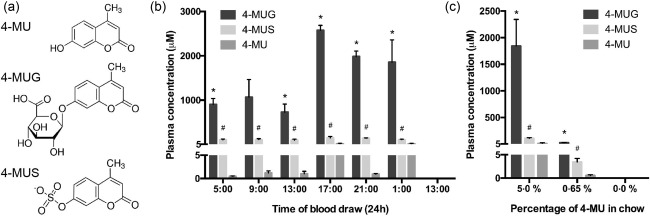
4‐methylumbelliferone (4‐MU) is metabolized rapidly in vivo. (a) Molecular structures for 4‐MU and its primary metabolites, 4‐methylumbelliferyl glucuronide (4‐MU) and 4‐methylumbelliferyl sulphate (4‐MUS). (b) Concentrations of 4‐MU and its metabolites in plasma isolated over a 24‐h cycle from mice that had been fed chow containing 5% 4‐MU for 2 weeks. (c) Concentrations of 4‐MU and its metabolites in plasma of animals that had been fed chow containing 5% or 0·65% 4‐MU for 2 weeks. *P < 0·05 comparing 4‐MUG to 4‐MU. #P < 0·05 comparing 4‐MUS to 4‐MU, n = 3 animals per group.
In contrast, the concentrations of 4‐MU metabolites were much higher. In man, 4‐MUG is the predominant metabolite 46. Consistent with this, we observed that in mice fed 5% 4‐MU chow 4‐MUG was the most abundant metabolite found in plasma, yielding an average concentration of 531 ± 66 µg/ml (1519 ± 189 µM), while 4‐MUS was present in much lower concentrations (30·5 ± 2·1 µg/ml; 119 ± 8 µM) (Fig. 4b). However, concentrations of both metabolites were significantly higher than the parent 4‐MU (P < 0·001) (Fig. 4b).
Plasma 4‐MUG drug concentrations varied in mice depending on the time of day. They tended to be higher during the night and lower during the day (Fig. 4b). Given that mice are nocturnal, the fluctuations in concentrations are consistent with the expected higher exposures during periods of feeding (i.e. night) followed by much lower concentrations during periods of fasting (day), due presumably to rapid metabolism. Plasma concentrations of 4‐MU, by comparison, were uniformly low, irrespective of the time of day (Fig. 4b), another indication that it is metabolized rapidly during oral uptake.
4‐MU dosage impacts its efficacy in treating autoimmunity
We then asked whether lower doses of 4‐MU were sufficient to prevent autoimmunity in our mouse models of autoimmunity. Similar to our previously published results 16, oral treatment with chow containing 5% 4‐MU, started after onset of symptoms, decreased the severity of MOG35–55‐induced EAE in C57BL/6 mice significantly, indicating that 4‐MU is able to affect already established disease processes (Fig. 5a). However, this effect was not observed in mice treated with chow containing 0·65% 4‐MU (Fig. 5b). Similarly, whereas the higher dose of 4‐MU was effective in preventing onset of diabetes in DORmO mice, the lower 0·65% formulation of chow was eventually unable to prevent disease in this model (Fig. 5c,d).
Figure 5.

4‐methylumbelliferone (4‐MU) dosage impacts its efficacy in treating autoimmunity. (a,b). Impact of 4‐MU dose on the severity of experimental autoimmune encephalomyelitis (EAE). Treatment with either (a) 5% or (b) 0·65% 4‐MU in the chow was initiated after the onset of symptoms. *P < 0·05, **P < 0·01, ***P < 0·001, Mann–Whitney U‐test comparing treated mice with untreated mice (n = 10). (c,d). Impact of 4‐MU dose on glycaemic control, indicated by blood glucose levels, in D011.10xRIPmOVA (DORmO) mice fed either (c) 5% or (d) 0·65% 4‐MU chow initiated at 6 weeks of age; n = 5 mice per group. Grey shaded boxes indicate the duration of 4‐MU treatment.
These data are explained most readily by the low bioavailability (< 2%) of 4‐MU 46 and suggest that the 0·65% 4‐MU chow formulation was not able to yield adequate concentrations of 4‐MU in the mice to be effective. Consistent with this interpretation, minimal concentrations of 4‐MU and its metabolites were detectable in the plasma of mice fed the 0·65% 4‐MU chow formulation (Fig. 4c).
4‐MU dosage impacts T helper (Th) subset polarization
In our previous report we also showed that 4‐MU significantly decreased the fraction of IFN‐γ‐producing Th1 T cells and increased the fraction of IL‐4‐producing Th2 T cells in mice fed 5% 4‐MU chow 16. We therefore next examined how 4‐MU dosage affects the impact of 4‐MU on T cell subset polarization, as assessed by cytokine production. For this, we isolated splenocytes from mice fed chow containing 5% or 0·65% 4‐MU or control chow, and assessed these for cytokine production after in‐vitro stimulation. We found that only the 5% 4‐MU chow reduced the production of IFN‐γ significantly (Fig. 6a) and increased the production of IL‐4 (Fig. 6c), whereas the 0·65% 4‐MU chow did not result in a significant change in cytokine production compared to control (Fig. 6a,b,c). We also observed a moderate increase in IL‐17 production by unstimulated cells after 5% 4‐MU treatment, as we have observed previously, but not after 0·65% 4‐MU treatment. These data are consistent with the effect of chow formulation strength on autoimmune disease in the EAE and DORmO models (Fig. 5).
Figure 6.
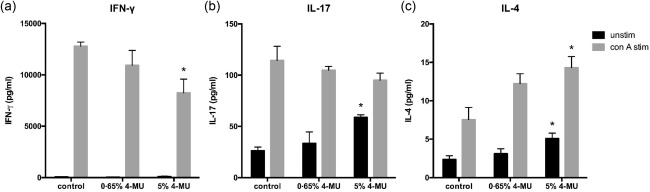
4‐methylumbelliferone (4‐MU) dosage impacts T helper (Th) subset polarization. (a–c). Cytokine production profiles for (a) interferon (IFN)‐γ, a Th1 cytokine, (b) interleukin (IL)−17, a Th17 cytokine and (c) IL‐4, a Th2 cytokine, of splenocytes isolated from mice fed chow containing 5% or 0·65% 4‐MU or control chow. Cells were cultured for 48 h with (grey bars) or without (black bars) activation using concanavalin A (ConA) and cytokine levels were measured in the supernatants using enzyme‐linked immunosorbent assay (ELISA). *P < 0·05, n = 5 animals per group.
Discussion
We have examined a number of variables that influence the practical implementation of oral treatment protocols to suppress HA synthesis in mouse models of autoimmunity using 4‐MU.
We report that a significant reduction in serum HA in C57BL/6 mice was observed after 7 days of treatment with oral 4‐MU at a dose of 5% of the total chow volume. While this duration may vary between different tissues, from a practical perspective it suggests that a pretreatment period is necessary to suppress systemic HA synthesis. In contrast, using pancreatic islets cultured in vitro with 4‐MU, significant suppression of HA synthesis was observed after 24 h 13. This difference may reflect the pharmacokinetics of 4‐MU in vivo after oral uptake 46. However, mice also take time to adjust to the unfavourable taste of oral 4‐MU, and we speculate that they may not consume sufficient chow initially to achieve suppression of HA synthesis. Regardless, it has become our practice to treat for a minimum of 1 week prior to performing functional analyses of mice on 4‐MU.
Notably, even long‐term oral 4‐MU treatment does not remove all HA in pancreatic islets 13, EAE CNS 16 or other tissues 37, suggesting that some HA is slow to turn over and/or that 4‐MU‐mediated inhibition of HA synthesis is not 100% efficient. We speculate that the residual HA seen in histological stains of mice treated with 4‐MU may be bound substantially to hyaladherins 47, 48 or otherwise less susceptible to catabolism.
We found initially that C57BL/6 mice typically lost significant weight on 4‐MU chow, despite the inclusion of chocolate flavouring. After the first week, however, mice fed 4‐MU start to gain weight again at the same rate as mice fed control chow. None the less, they often do not catch up to mice fed control until later in the disease process, when studying disease models. This may be relevant to treatment protocols where body weight is a significant variable. For example, this diminished food intake may account for some of the early improvement in glycaemic control and leptin‐related regulation of neuroinflammation in the DORmO and EAE mouse models in our recent studies 13, 16, 49. However, it is unlikely to account for the long‐term effect seen in these animals, given that mice regained normal food intake within weeks and were maintained on 4‐MU chow for up to a year in these studies 13.
Of note, 4‐MU has fluorescent properties and might therefore be light sensitive. It might therefore better be stored in a darkened container to preserve efficacy (data not shown). Along related lines, it has been suggested that chow formulations older than 4 months are less effective (data not shown), implying that 4‐MU chow formulation might have a limited shelf life.
With regard to in‐vivo metabolism of 4‐MU, we find that 4‐MUG is the predominant metabolite present in plasma in mice on a steady 5% chow regimen; indeed, it was present at concentrations 300‐fold higher than those seen for the parent molecule, 4‐MU. Glucuronidation is a common mechanism to solubilize hydrophobic noxious agents, allowing them to be cleared from the body. Consistent with this, in humans it has been shown that 4‐MU is metabolized extensively and that less than 1% of a given dose is excreted unchanged in the urine 46. Glucuronidation into 4‐MUG accounts for more than 90% of this metabolism and 93% of a single i.v. dose of 4‐MU is eliminated as the 4‐MUG metabolite in the urine 46, 50.
Our data suggest that giving daily i.p. injections of 4‐MU, despite bypassing first‐pass metabolism, is not an effective treatment approach for preventing EAE. This is consistent with the high clearance of hymecromone: using i.v. infusion of 4‐MU it was shown previously that the clearance of 4‐MU is rapid, having a half‐life of ∼30 min 46. In our experiments, each day's dose was made up freshly to avoid issues of formulation stability. In light of this, our interpretation of our i.p. data is that the half‐life of 4‐MU is probably too short for daily injections to be effective. We considered more frequent dosing, but deemed this approach impractical given that weeks to months of treatment are necessary to demonstrate efficacy in some of our autoimmunity models.
The effectiveness of 4‐MU is concentration‐dependent. A 5% 4‐MU chow formulation prevented autoimmunity efficiently in both the EAE and DORmO models and polarized T cell subsets away from pathogenic Th1 cytokine production and towards Th2. However, a 0·65% 4‐MU chow formulation was ineffective. This is consistent with the known low bioavailability of 4‐MU; in one pharmacokinetic study of hymecromone in human volunteers, the systemic bioavailability of hymecromone after oral dosing was less than 2% 46. In rodents, previous studies have demonstrated the extraction of hymecromone by the gastrointestinal system (prehepatic) to be ∼40% and extraction by the liver as high as 97% 50. As a result of this high extraction, the fraction of an administered oral dose of hymecromone that reaches the systemic circulation (post‐hepatic) as unchanged drug is very low. In light of this low bioavailability, using higher doses is warranted in in vivo studies.
Together, these studies provide a practical resource for implementing 4‐MU treatment protocols in mice. Our hope is that this will contribute to further investigation of the role of HA in autoimmunity and other disease conditions and the development of potential therapeutic strategies targeting HA synthesis for these diseases.
Disclosure
The authors declare no disclosures.
Author contributions
H. F. K., N. N., T. N. W., L. S. and P. L. B. designed the experiments. H. F. K., N. N., S. M. R., V. G. K., P. M., J. A. G. and H. D. I. performed the experiments. S. K., T. N. W. and L. S. provided reagents. J. B., A. F. and P. L. B. wrote the manuscript.
Acknowledgements
This work was supported in part by Human Frontier Science Program (HFSP) Long Term Fellowship LT830 and California Institute for Regenerative Medicine (CIRM) Training Grant TG2‐01159 to H. F. K., German Research Foundation grant (DFG) NA 965/2‐1 and Juvenile Diabetes Research Foundation (JDRF) grant 3‐PDF‐2014‐224‐A‐N to N. N., NIH grants R01 DK096087‐01, R01 HL113294‐01A1 and U01 AI101984 and grants from the Stanford University Child Health Research Institute and SPARK Program to P. L. B, U01 AI101990 Pilot Project and Building Interdisciplinary Research Team (BIRT) supplement AR037296 to J. A. G. and T. N. W. and a Benaroya Research Institute Commercialization Gap Fund grant to N.N. and T.N.W.
References
- 1. Jiang D, Liang J, Noble PW, Jiang D, Liang J, Noble PW. Hyaluronan as an immune regulator in human diseases. Physiol Rev 2011; 91:221–64. [DOI] [PMC free article] [PubMed] [Google Scholar]
- 2. Termeer C, Sleeman JP, Simon JC. Hyaluronan – magic glue for the regulation of the immune response? Trends Immunol 2003; 24:112–4. [DOI] [PubMed] [Google Scholar]
- 3. Fraser JR, Laurent TC, Laurent UB. Hyaluronan: its nature, distribution, functions and turnover. J Intern Med 1997; 242:27–33. [DOI] [PubMed] [Google Scholar]
- 4. Laurent TC, Laurent UB, Fraser JR. The structure and function of hyaluronan: an overview. Immunol Cell Biol 1996; 74:A1–7. [DOI] [PubMed] [Google Scholar]
- 5. Mine S, Okada Y, Kawahara C, Tabata T, Tanaka Y. Serum hyaluronan concentration as a marker of angiopathy in patients with diabetes mellitus. Endocr J 2006; 53:761–6. [DOI] [PubMed] [Google Scholar]
- 6. Kang L, Lantier L, Kennedy A et al Hyaluronan accumulates with high‐fat feeding and contributes to insulin resistance. Diabetes 2013; 62:1888–96. [DOI] [PMC free article] [PubMed] [Google Scholar]
- 7. Back SA, Tuohy TMF, Chen H et al Hyaluronan accumulates in demyelinated lesions and inhibits oligodendrocyte progenitor maturation. Nat Med 2005; 11:966–72. [DOI] [PubMed] [Google Scholar]
- 8. Gao F, Koenitzer JR, Tobolewski JM et al Extracellular superoxide dismutase inhibits inflammation by preventing oxidative fragmentation of hyaluronan. J Biol Chem 2008; 283:6058–66. [DOI] [PMC free article] [PubMed] [Google Scholar]
- 9. Ayars AG, Altman LC, Potter‐Perigo S, Radford K, Wight TN, Nair P. Sputum hyaluronan and versican in severe eosinophilic asthma. Int Arch Allergy Immunol 2013; 161:65–73. [DOI] [PMC free article] [PubMed] [Google Scholar]
- 10. Liang J, Jiang D, Jung Y et al Role of hyaluronan and hyaluronan‐binding proteins in human asthma. J Allergy Clin Immunol 2011; 128:403–11.e3. [DOI] [PMC free article] [PubMed] [Google Scholar]
- 11. Bogdani M, Johnson PY, Potter‐Perigo S et al Hyaluronan and hyaluronan‐binding proteins accumulate in both human type 1 diabetic islets and lymphoid tissues and associate with inflammatory cells in insulitis. Diabetes 2014; 63:2727–43. [DOI] [PMC free article] [PubMed] [Google Scholar]
- 12. Bollyky PL, Bogdani M, Bollyky JB, Hull RL, Wight TN. The role of hyaluronan and the extracellular matrix in islet inflammation and immune regulation. Curr Diab Rep 2012; 12:471–80. [DOI] [PMC free article] [PubMed] [Google Scholar]
- 13. Nagy N, Kaber G, Johnson PY et al Inhibition of hyaluronan synthesis restores immune tolerance during autoimmune insulitis. J Clin Invest 2015; 125:3928–40. [DOI] [PMC free article] [PubMed] [Google Scholar]
- 14. Irving‐Rodgers HF, Ziolkowski AF, Parish CR et al Molecular composition of the peri‐islet basement membrane in NOD mice: a barrier against destructive insulitis. Diabetologia 2008; 51:1680–8. [DOI] [PMC free article] [PubMed] [Google Scholar]
- 15. Hull RL, Johnson PY, Braun KR, Day AJ, Wight TN. Hyaluronan and hyaluronan binding proteins are normal components of mouse pancreatic islets and are differentially expressed by islet endocrine cell types. J Histochem Cytochem 2012; 60:749–60. [DOI] [PMC free article] [PubMed] [Google Scholar]
- 16. Kuipers HF, Rieck M, Gurevich I et al Hyaluronan synthesis is necessary for autoreactive T‐cell trafficking, activation, and Th1 polarization. Proc Natl Acad Sci USA 2016; 113:1339–44. [DOI] [PMC free article] [PubMed] [Google Scholar]
- 17. Yoshioka Y, Kozawa E, Urakawa H et al Suppression of hyaluronan synthesis alleviates inflammatory responses in murine arthritis and in human rheumatoid synovial fibroblasts. Arthritis Rheum 2013; 65:1160–70. [DOI] [PubMed] [Google Scholar]
- 18. Yung S, Chan TM. The role of hyaluronan and CD44 in the pathogenesis of lupus nephritis. Autoimmune Dis 2012; 1: 1–9. [DOI] [PMC free article] [PubMed] [Google Scholar]
- 19. Jiang D, Liang J, Fan J et al Regulation of lung injury and repair by Toll‐like receptors and hyaluronan. Nat Med 2005; 11:1173–9. [DOI] [PubMed] [Google Scholar]
- 20. Scheibner KA, Lutz MA, Boodoo S, Fenton MJ, Powell JD, Horton MR. Hyaluronan fragments act as an endogenous danger signal by engaging TLR2. J Immunol 2006; 177:1272–81. [DOI] [PubMed] [Google Scholar]
- 21. Noble PW, McKee CM, Cowman M, Shin HS. Hyaluronan fragments activate an NF‐kappa B/I‐kappa B alpha autoregulatory loop in murine macrophages. J Exp Med 1996; 183:2373–8. [DOI] [PMC free article] [PubMed] [Google Scholar]
- 22. Termeer C, Benedix F, Sleeman J et al Oligosaccharides of Hyaluronan activate dendritic cells via toll‐like receptor 4. J Exp Med 2002; 195:99–111. [DOI] [PMC free article] [PubMed] [Google Scholar]
- 23. McKee CM, Penno MB, Cowman M et al Hyaluronan (HA) fragments induce chemokine gene expression in alveolar macrophages. The role of HA size and CD44. J Clin Invest 1996; 98:2403–13. [DOI] [PMC free article] [PubMed] [Google Scholar]
- 24. Taylor KR, Trowbridge JM, Rudisill JA, Termeer CC, Simon JC, Gallo RL. Hyaluronan fragments stimulate endothelial recognition of injury through TLR4. J Biol Chem 2004; 279:17079–84. [DOI] [PubMed] [Google Scholar]
- 25. Mahaffey CL, Mummert ME. Hyaluronan synthesis is required for IL‐2‐mediated T cell proliferation. J Immunol 2007; 179:8191–9. [DOI] [PubMed] [Google Scholar]
- 26. Itano N, Atsumi F, Sawai T et al Abnormal accumulation of hyaluronan matrix diminishes contact inhibition of cell growth and promotes cell migration. Proc Natl Acad Sci USA 2002; 99:3609–14. [DOI] [PMC free article] [PubMed] [Google Scholar]
- 27. Taylor KR, Yamasaki K, Radek KA et al Recognition of hyaluronan released in sterile injury involves a unique receptor complex dependent on Toll‐like receptor 4, CD44, and MD‐2. J Biol Chem 2007; 282:18265–75. [DOI] [PubMed] [Google Scholar]
- 28. Tesar BM, Jiang D, Liang J, Palmer SM, Noble PW, Goldstein DR. The role of hyaluronan degradation products as innate alloimmune agonists. Am J Transplant 2006; 6:2622–35. [DOI] [PubMed] [Google Scholar]
- 29. Bollyky PL, Falk BA, Long SA et al CD44 costimulation promotes FoxP3+ regulatory T cell persistence and function via production of IL‐2, IL‐10, and TGF‐beta. J Immunol 2009; 183:2232–41. [DOI] [PMC free article] [PubMed] [Google Scholar]
- 30. Bollyky PL, Lord JD, Masewicz SA et al Cutting edge: high molecular weight hyaluronan promotes the suppressive effects of CD4+CD25+ regulatory T cells. J Immunol 2007; 179:744–7. [DOI] [PubMed] [Google Scholar]
- 31. Bollyky PL, Wu RP, Falk BA et al ECM components guide IL‐10 producing regulatory T‐cell (TR1) induction from effector memory T‐cell precursors. Proc Natl Acad Sci USA 2011; 108:7938–43. [DOI] [PMC free article] [PubMed] [Google Scholar]
- 32. Bollyky PL, Falk BA, Wu RP, Buckner JH, Wight TN, Nepom GT. Intact extracellular matrix and the maintenance of immune tolerance: high molecular weight hyaluronan promotes persistence of induced CD4+CD25+ regulatory T cells. J Leukoc Biol 2009; 86:567–72. [DOI] [PMC free article] [PubMed] [Google Scholar]
- 33. Maeshima N, Poon GFT, Dosanjh M et al Hyaluronan binding identifies the most proliferative activated and memory T cells. Eur J Immunol 2011; 41:1108–19. [DOI] [PubMed] [Google Scholar]
- 34. Evanko SP, Potter‐Perigo S, Bollyky PL, Nepom GT, Wight TN. Hyaluronan and versican in the control of human T‐lymphocyte adhesion and migration. Matrix Biol 2012; 31:90–100. [DOI] [PMC free article] [PubMed] [Google Scholar]
- 35. Baaten BJG, Li CRR, Deiro MF, Lin MM, Linton PJ, Bradley LM. CD44 regulates survival and memory development in Th1 cells. Immunity 2010; 32:104–15. [DOI] [PMC free article] [PubMed] [Google Scholar]
- 36. Nagy N, Kuipers HF, Frymoyer AR et al 4‐methylumbelliferone treatment and hyaluronan inhibition as a therapeutic strategy in inflammation, autoimmunity, and cancer. Front Immunol 2015; 6:123. [DOI] [PMC free article] [PubMed] [Google Scholar]
- 37. Nagy N, Freudenberger T, Melchior‐Becker A et al Inhibition of hyaluronan synthesis accelerates murine atherosclerosis: novel insights into the role of hyaluronan synthesis. Circulation 2010; 122:2313–22. [DOI] [PubMed] [Google Scholar]
- 38. Bollyky PL, Evanko SP, Wu RP et al Th1 cytokines promote T‐cell binding to antigen‐presenting cells via enhanced hyaluronan production and accumulation at the immune synapse. Cell Mol Immunol 2010; 7:211–20. [DOI] [PMC free article] [PubMed] [Google Scholar]
- 39. Ruppert SM, Falk BA, Long SA, Bollyky PL. Regulatory T cells resist cyclosporine‐induced cell death via CD44‐mediated signaling pathways. Int J Cell Biol 2015; 2015:614297. [DOI] [PMC free article] [PubMed] [Google Scholar]
- 40. Mueller AM, Yoon BH, Sadiq SA. Inhibition of hyaluronan synthesis protects against central nervous system (CNS) autoimmunity and increases CXCL12 expression in the inflamed CNS. J Biol Chem 2014; 289:22888–99. [DOI] [PMC free article] [PubMed] [Google Scholar]
- 41. Kakizaki I, Kojima K, Takagaki K et al A novel mechanism for the inhibition of hyaluronan biosynthesis by 4‐methylumbelliferone. J Biol Chem 2004; 279:33281–9. [DOI] [PubMed] [Google Scholar]
- 42. Kultti A, Pasonen‐Seppänen S, Jauhiainen M et al 4‐Methylumbelliferone inhibits hyaluronan synthesis by depletion of cellular UDP‐glucuronic acid and downregulation of hyaluronan synthase 2 and 3. Exp Cell Res 2009; 315:1914–23. [DOI] [PubMed] [Google Scholar]
- 43. Takeda S, Aburada M. The choleretic mechanism of coumarin compounds and phenolic compounds. J Pharmacobiodyn 1981; 4:724–34. [DOI] [PubMed] [Google Scholar]
- 44. Suzuki H, Sawada Y, Sugiyama Y, Iga T, Hanano M. Pharmacokinetic study of 4‐methylumbelliferone in mice. J Pharmacobiodyn 1987; 10:195–200. [DOI] [PubMed] [Google Scholar]
- 45. Mapleson JL, Buchwald M. Effect of cycloheximide and dexamethasone phosphate on hyaluronic acid synthesis and secretion in cultured human skin fibroblasts. J Cell Physiol 1981; 109:215–22. [DOI] [PubMed] [Google Scholar]
- 46. Garrett ER, Venitz J, Eberst K, Cerda JJ. Pharmacokinetics and bioavailabilities of hymecromone in human volunteers. Biopharm Drug Dispos 1993; 14:13–39. [DOI] [PubMed] [Google Scholar]
- 47. Day AJ, de la Motte CA. Hyaluronan cross‐linking: a protective mechanism in inflammation? Trends Immunol 2005; 26:637–43. [DOI] [PubMed] [Google Scholar]
- 48. Day AJ, Prestwich GD. Hyaluronan‐binding proteins: tying up the giant. J Biol Chem 2002; 277:4585–8. [DOI] [PubMed] [Google Scholar]
- 49. Sanna V, Di Giacomo A, La Cava A et al Leptin surge precedes onset of autoimmune encephalomyelitis and correlates with development of pathogenic T cell responses. J Clin Invest 2003; 111:241–50. [DOI] [PMC free article] [PubMed] [Google Scholar]
- 50. Mulder GJ, Brouwer S, Weitering JG, Scholtens E, Pang KS. Glucuronidation and sulfation in the rat in vivo. The role of the liver and the intestine in the in vivo clearance of 4‐methylumbelliferone. Biochem Pharmacol 1985; 34:1325–9. [DOI] [PubMed] [Google Scholar]