

Abstract
Thrombospondin-1 (THBS-1) has been demonstrated to have a complicated role in human cancer and to exert stimulatory and inhibitory effects in different types of tumors. DNA methylation, as the most frequent mechanism for gene silencing, has been widely investigated in regards to the development of tumors. However, the expression levels and methylation status of THBS-1, and their roles in laryngeal squamous cell carcinoma (LSCC) remain to be elucidated. The present study detected downregulated THBS-1 mRNA and protein expression levels in LSCC by using reverse transcription-quantitative polymerase chain reaction (PCR) and western blotting, while decreased expression levels of THBS-1 mRNA and protein were significantly associated with lymph node metastasis and tumor-node-metastasis (TNM) stage. Furthermore, aberrant methylation of THBS-1 was frequently observed in LSCC by methylation-specific PCR, particularly in tumor tissues from lymph node metastasis or samples from cancer with advanced TNM stage. Furthermore, the current study demonstrated that downregulated expression of THBS-1 in LSCC was consistent with aberrant methylation of this gene. Treatment with the DNA methyltransferase inhibitor 5-aza-2′-deoxy-cytidine in Hep-2 cells induced demethylation of THBS-1, enhanced THBS-1 expression, and inhibited the proliferative and invasive ability of Hep-2 cells. Collectively, the results of the present study suggest that THBS-1 may exert an inhibitory effect in the development of LSCC. Aberrant methylation was an important reason for the downregulation of THBS-1 and was involved in the invasion and metastasis of LSCC. Demethylating agents may be effective candidates for the treatment of LSCC.
Keywords: laryngeal squamous cell cancer, thrombospondin 1, DNA methylation, 5-aza-2′-deoxy-cytidine
Introduction
Laryngeal squamous cell carcinoma (LSCC) is a common malignant tumor of the head and neck region, and it is the eighth leading cause of cancer-associated mortality worldwide (1). LSCC is likely to metastasize to regional lymph nodes, which impacts cure rates and survival. Numerous advanced methods have been developed for diagnosis and treatment, the mortality rate of LSCC has not improved (2). Thus, an improved understanding of the underlying mechanisms of LSCC development is key for the development of novel diagnostic and prognostic markers, and novel therapeutic targets.
Epigenetic modifications have been recognized as an important mechanism underlying carcinoma progression. DNA methylation is one of the best-understood mechanisms of epigenetic regulation of gene expression. Hypermethylation of CpG islands, which are located in the promoter regions of tumor-associated genes, is the predominant mechanism of gene inactivation in cancer (3). However, different types of tumor have a different pattern of hypermethylated genes (4). Identification of hypermethylated genes in LSCC may be important for finding molecular markers to aid diagnosis, treatment monitoring, and prognosis of LSCC.
Thrombospondin-1 (THBS-1) is a glycoprotein containing multiple domains, which is important in cell proliferation, adhesion, angiogenesis, migration, and tumor metastasis via interaction with numerous proteins and cell receptors (5). However, the involvement of THBS-1 in cancer progression remains controversial. Inhibition of tumor growth by THBS-1 is considered to be associated with its antiangiogenic activity, which has been well described (6). By contrast, a number of previous studies have demonstrated that THBS-1 promotes tumor cell invasion and metastasis in breast cancer (7), gastric carcinoma (8) and pancreatic carcinoma (9). Thus, the effects of THBS-1 appear to be specific for the type of tumor examined and the experimental model used. Promoter hypermethylation of the THBS-1 gene has been observed in certain primary human carcinomas, including colorectal cancer (10), melanoma (11) and gastric cardia adenocarcinoma (12). It has been suggested that hypermethylated THBS-1 may promote tumorigenesis via its effects on angiogenesis (10–12). To the best of our knowledge, the role and methylation status of THBS-1 in LSCC remains to be elucidated. The present study investigated the expression and role of THBS-1, and evaluated the association between expression and methylation status of THBS-1 and clinicopathological parameters of LSCC. In addition, the current study detected the ability of 5-aza-2′-deoxy-cytidine (5-aza-dC) to induce THBS-1 gene re-expression and its effect on proliferation and invasion of Hep-2 cells.
Materials and methods
Patients and tissue samples
The present study was conducted on 66 LSCC patients (24 patients with glottic lesions, 34 with supraglottic lesions and 8 with subglottic lesions), who were histologically and clinically diagnosed at Chongqing Cancer Institute and the First Affiliated Hospital of Chongqing Medical University (Chongqing, China) between 2012 and 2013. All patients received no radiotherapy, chemotherapy or biotherapy prior to operation. Among the 66 LSCC patients, 54 were male and 12 were female, age ranged from 34–76 years, with a mean age of 62.3 years. A total of 24 patients had positive lymph node metastasis and 42 patients had negative lymph node metastasis. Histological grade determined 37 patients were of high grade, 20 of middle grade, and 9 of low grade. According to the tumor-node-metastasis (TNM) classification by the Union for International Cancer Control (1997), 36 were in stage I-II and 30 were in stage III–IV. Fresh tumor tissues and adjacent non-tumorous tissues were obtained immediately following tumor resection. Each tissue was snap-frozen in liquid nitrogen and stored at −80°C.
The present study was approved by the ethics committee of Chongqing Cancer Institute and the First Affiliated Hospital of Chongqing Medical University. Informed consent was obtained from all patients. All specimens were handled and made anonymous according to the ethical and legal standards.
Cell culture and treatment with 5-aza-dC
The Hep-2 human laryngeal carcinoma cell line was obtained from the Cell Biology Institute of Shanghai, Chinese Academy of Science (Shanghai, China). The cells were grown in RPMI-1640 (GE Healthcare Life Sciences, Logan, UT, USA) with 10% fetal bovine serum (FBS; Gibco; Thermo Fisher Scientific, Inc., Waltham, MA, USA), penicillin (100 U/ml) and streptomycin (100 µg/ml) at 37°C in a 5% CO2 humidified atmosphere. Following culture in a 6-well plate for 24 h, the Hep-2 cells were treated for times ranging from 6–96 h with the demethylating reagent, 5-aza-dC (Sigma-Aldrich, St. Louis, MO, USA) at a final concentration of 0.1, 1, or 5 µM. Dimethyl sulfoxide (Sigma-Aldrich) served as a control for non-specific solvent effects on cells.
Reverse transcription-quantitative polymerase chain reaction (RT-qPCR)
Total RNA was extracted from human tissue samples and Hep-2 cells using TRIzol reagent (Invitrogen; Thermo Fisher Scientific, Inc.). Total RNA was reverse transcribed into cDNA using a PrimeScript™ RT reagent kit (Perfect Real Time) obtained from Takara Bio, Inc. (Otsu, Japan) according to the manufacturer's protocol. qPCR was conducted using the SYBR® Premix Ex Taq™ II (Tli RNaseH Plus) kit (Takara Bio, Inc.) and the Rotor-Gene Q Cycler (Qiagen GmbH, Hilden, Germany). The primers for were as follows: Forward, 5′-TGT TTG TGC AGG AAG ACA GG-3′ and reverse, 5′-TTG TCA AGG GTG AGG AGG AC-3′ for THBS-1; and forward, 5′-CTC TCT GCT CCT CCT GTT CGAC-3′ and reverse, 5′-TGA GCG ATG TGG CTC GGCT-3′ for GAPDH. The thermocycling conditions were as follows: 2 min at 95°C; followed by 40 cycles of 95°C for 15 sec, 58°C for 30 sec and 58°C for 30 sec. All samples were analyzed using GAPDH gene expression as an internal control. The relative mRNA level of THBS-1 gene expression was determined by the 2−ΔΔCq method (13).
Western blotting
Briefly, human tissue samples and Hep-2 cells were homogenized in radioimmunoprecipitation lysis buffer (Sigma-Aldrich; Merck Millipore, Darmstadt, Germany) to extract the protein. Total protein concentration was quantified using a Protein Assay kit (Bio-Rad Laboratories, Inc., Hercules, CA, USA). Total protein (50 µg) was separated by electrophoresis on 10% SDS-PAGE gel and transferred to polyvinylidene difluoride membranes. The membranes were then blocked with 5% non-fat dry milk in 1 × Tris buffered-saline-Tween-20 (TBST; Bio-Rad Laboratories, Inc.) for 1 h at 25°C, membranes were probed with primary monoclonal anti-THBS-1 antibody (cat. no. sc-59887; 1:1,000) and β-actin antibody (cat. no. sc-47778; 1:1,000; both from Santa Cruz Biotechnology, Inc, Dallas, TX, USA) overnight at 4°C. The membranes were then washed once with TBST and were incubated with horseradish peroxidase (HRP)-labeled anti-mouse secondary antibody (cat. no. BA1051, 1:5,000, Boster Biological Technology, Ltd., Wuhan, China) at 37°C for 1 h. β-actin served as an internal control. Membranes were incubated with Immobilon™ Western chemiluminescent HRP substrate (EMD Millipore, Billerica, MA, USA) after washing. Signals were detected by ChemiDoc XRS imaging system (Bio-Rad Laboratories, Inc.). Quantification of bands on western blots was performed using Quantity One software version 4.6.2 (Bio-Rad Laboratories, Inc.).
DNA extraction and methylation-specific PCR
Genomic DNA was extracted from human tissue samples or Hep-2 cells using MasterPure DNA Purification kit (Epicentre Biotechnologies; Illumina, Inc., San Diego, CA, USA) according to the manufacturer's protocols. Genomic DNA was modified using the EZ DNA Methylation™ Bisulfite kit following manufacturer's protocol (Zymo Research, Irvine, CA, USA). This modification resulted in a conversion of unmethylated cytosine to thymine, whereas methylated cytosine remained unchanged. The specific PCR was then used to distinguish between methylated and unmethylated DNA sequences. The bisulfite-treated DNA was amplified using EpiTaq™ HS kit (TaKaRa Bio Inc.). The primer sequences were as follows: Forward, 5′-TTG AGT ACG TTA AGG TTG CGT GGGC-3′ and reverse, 5′-AAC GCT AAA ACT ACC GAT ACG CCG AA-3′ (212 bp) for the methylated form; and forward, 5′-GGT TGA GTA TGT TAA GGT TGT GTG GGT-3′ and reverse, 5′-TAA AAA CAC TAA AAC TAC CAA TAC ACC AAA-3′ (230 bp) for the unmethylated form. The thermocycling conditions were as follows: 5 min at 94°C; followed by 35 cycles of 94°C for 30 sec, 60°C for 30 sec, and 72°C for 30 sec; with a final extension at 72°C for 10 min. PCR products were analyzed on 2% agarose gels with ethidium bromide and visualized under UV illumination. Genomic DNA, treated in vitro with Sss I methyltransferase served as a positive control for methylated DNA, and DNA from peripheral blood lymphocytes of healthy individuals served as a control for unmethylated DNA. A water blank served as a negative control.
Cell viability assay
Cell viability was determined using a Cell Counting Kit-8 (CCK-8; Beyotime Institute of Biotechnology, Haimen, China). Hep-2 cells (5×10³) were suspended in 100 µl RPMI-1640 medium containing 10% FBS were seeded in 96-well plates. After 24 h, the cells were treated with different concentrations (0.1, 1, or 5 µM) of 5-aza-dC for 24, 48, 72, and 96 h, respectively. CCK-8 solution (10 µl) was added to each well and the cultures were incubated at 37°C for 90 min. Absorbance at a wavelength of 450 nm was measured using an microplate reader. The results were plotted as the mean ± standard deviation from three separate experiments with four determinations per experiment for each experimental condition.
Cell invasion assay
Cell invasive ability was examined using a 24-well Transwell assay with 8 µm pore polycarbonate membrane inserts (Corning Incorporated, Corning, NY, USA). Hep-2 cells incubated with 5 µM 5-Aza-dC for 24, 48 and 72 h, respectively were detached from the tissue culture plates, washed with PBS, and planted at the density of 5×10⁴/upper well in 200 µl of serum-free RPMI-1640 medium. RPMI-1640 (500 µl) supplemented with 10% FBS was added to the lower chambers as a chemoattractant. Cells were incubated at 37°C in a humidified 5% CO2 atmosphere for 24 h. Cells that had successfully invaded through the inserts were fixed in 4% paraformaldehyde for 30 min and stained with crystal violet. The invaded cells were counted from five preselected microscopic fields (magnification, ×200). All experiments were performed in triplicate.
Statistical analysis
For statistical evaluation, the SPSS 17.0 software (SPSS Inc., Chicago, IL, USA) was used. Experiments were independently repeated three times. Differences between groups were assessed by Student's t-test, one-way analysis of variance followed by Bonferroni's multiple comparison test or χ2 test. P<0.05 was considered to indicate a statistically significant difference.
Results
THBS-1 expression was downregulated in LSCC
Protein and mRNA expression levels of THBS-1 were examined by western blotting and RT-qPCR, respectively, in 66 LSCC samples and corresponding adjacent non-tumorous tissue. The THBS-1 mRNA expression levels in LSCC tumor tissues were significantly lower than in corresponding adjacent non-tumorous tissues (t=6.349, P<0.01; Fig. 1A). To further verify this alteration, the protein expression levels of THBS-1 were evaluated. Compared with adjacent non-tumorous tissues, protein levels of THBS-1 were significantly decreased in LSCC tumor tissues (t=8.420, P<0.01; Fig. 1B and C).
Figure 1.

The mRNA and protein expression levels of THBS-1 in laryngeal squamous cell cancer tissues and corresponding adjacent normal tissues. (A) Relative mRNA levels of THBS-1 were detected by reverse transcription-quantitative polymerase chain reaction. (B) The semiquantitative analysis of the relative THBS-1 protein expression levels. (C) Representative image of western blotting analysis of THBS-1 protein. **P<0.01 vs. N group. N, corresponding adjacent normal tissue; T, laryngeal squamous cell cancer tissue.
Association between clinicopathological features and expression levels of THBS-1 in LSCC
The association between THBS-1 expression in LSCC and clinicopathological features is presented in Table I. Protein and mRNA expression levels of THBS-1 were significantly lower in patients with lymph node metastasis compared with those without (for mRNA levels: t=5.118, P<0.01; for protein levels: t=4.117, P<0.05). THBS-1 mRNA and protein expression in patients with stage III–IV LSCC were significantly decreased compared with those in patients with stage I–II LSCC (for mRNA levels: t=5.417, P<0.01; for protein levels: t=5.136, P<0.01). The expression of THBS-1 was not associated with age, gender, primary site of tumor or histological differentiation of LSCC patients (P>0.05).
Table I.
Associations between THBS-1 expression and clinicopathological features of LSCC patients.
| Clinicopathological characteristic | n | THBS-1 mRNA | P-value | THBS-1 protein | P-value |
|---|---|---|---|---|---|
| Age (years) | |||||
| <60 | 23 | 0.411±0.157 | 0.181a | 0.398±0.121 | 0.341a |
| ≥60 | 43 | 0.397±0.191 | 0.401±0.141 | ||
| Gender | |||||
| Male | 54 | 0.399±0.182 | 0.143a | 0.395±0.119 | 0.105a |
| Female | 12 | 0.409±0.166 | 0.404±0.143 | ||
| Classification | |||||
| Supraglottic LSCC | 34 | 0.399±0.171 | 0.179b | 0.389±0.124 | 0.227b |
| Glottic LSCC | 24 | 0.410±0.177 | 0.408±0.137 | ||
| Subglottic LSCC | 8 | 0.403±0.174 | 0.402±0.132 | ||
| Differentiation | |||||
| High | 37 | 0.409±0.184 | 0.156b | 0.386±0.131 | 0.209b |
| Moderate | 20 | 0.404±0.164 | 0.406±0.138 | ||
| Poor | 9 | 0.399±0.174 | 0.407±0.124 | ||
| Lymph node metastasis | |||||
| Negative | 42 | 0.695±0.178 | 0.008a | 0.573±0.135 | 0.012a |
| Positive | 24 | 0.113±0.174 | 0.226±0.129 | ||
| TNM stage | |||||
| I–II | 36 | 0.701±0.164 | 0.003a | 0.584±0.139 | 0.008a |
| III–IV | 30 | 0.107±0.184 | 0.215±0.125 | ||
Data are presented as n or mean ± standard deviation.
P-value obtained from t-test;
P-value obtained from one-way analysis of variance. THBS-1, thrombospondin-1; LSCC, laryngeal squamous cell cancer; TNM, tumor, node, metastasis.
Aberrantly methylated THBS-1 was present in LSCC
The methylation status of THBS-1 was analyzed in 66 LSCC samples and corresponding adjacent non-tumorous tissues (Fig. 2). Of the LSCC samples, 32 of 66 (48.50%) exhibited THBS-1 methylation, while only 4 of 66 (6.06%) of paired adjacent non-tumorous tissues were demonstrated to exhibit THBS-1 methylation. Methylation frequency of THBS-1 in tumor tissues was significantly higher than in paired adjacent non-tumorous tissues (χ2=29.90, P<0.001).
Figure 2.
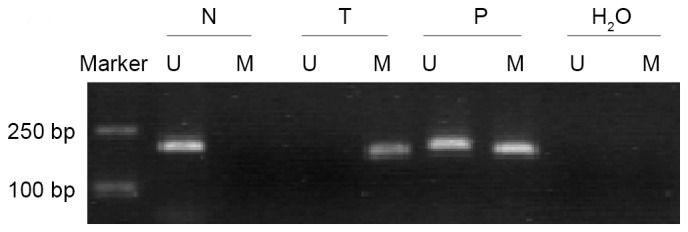
Methylation status of THBS-1 in laryngeal squamous cell cancer tissues and corresponding adjacent normal tissues. Lane U, unmethylated bands; lane M, methylated band. N, corresponding adjacent normal tissue; T, laryngeal squamous cell cancer tissue; P, positive control; H2O, blank control.
Downregulation of THBS-1 is associated with aberrant methylation in LSCC
The present study investigated the association between methylation status and expression levels of THBS-1 in LSCC. Of the 32 methylated LSCC samples, it was observed that mRNA and protein expression levels of THBS-1 were 0.164±0.067 and 0.098±0.440, respectively. In the remaining 34 unmethylated LSCC, mRNA and protein levels of THBS-1 were 0.618±0.081 and 0.584±0.079, respectively. The THBS-1 mRNA and protein levels in methylated samples were significantly downregulated compared to those in the unmethylated samples (mRNA: t=10.480, P<0.001; protein: t=9.990, P<0.001, Table II).
Table II.
Association between THBS-1 expression levels and DNA methylation status in laryngeal squamous cell cancer tissues.
| DNA methylation status | n | THBS-1 mRNA | P-value | THBS-1 protein | P-value |
|---|---|---|---|---|---|
| Methylated | 32 | 0.164±0.067 | P<0.001 | 0.098±0.440 | P<0.001 |
| Unmethylated | 34 | 0.618±0.081 | 0.584±0.079 |
Data are presented as n or mean ± standard deviation. P-value obtained from the t-test. THBS-1, thrombospondin-1.
Association between clinicopathological features and methylation status of THBS-1 in LSCC
The association between methylation frequency of THBS-1 and clinicopathological features of LSCC was examined (Table III). Methylation frequency of THBS-1 in patients with lymph node metastasis was significantly higher than that in patients without lymph node metastasis (χ2=7.542, P<0.01). When stratified for TNM stages, frequencies of THBS-1 methylation of patients with stage III or IV cancer were significantly higher than patients with stage I or II cancer (χ2=4.855, P<0.05). No other significant associations were observed between the methylation status of THBS-1 and the clinicopathological findings, including age, gender, primary site and histological differentiation (P>0.05).
Table III.
Associations between clinicopathological features and methylation status of THBS-1 in LSCC patients.
| Clinicopathological characteristic | Patients, n | THBS-1 methylation status, n (%)
|
P-value | |
|---|---|---|---|---|
| M | U | |||
| Age (years) | ||||
| <60 | 23 | 12 (52.17) | 11 (47.83) | 0.661 |
| ≥60 | 43 | 20 (46.51) | 23 (53.49) | |
| Gender | ||||
| Male | 54 | 26 (48.15) | 28 (51.85) | 0.908 |
| Female | 12 | 6 (50.00) | 6 (50.00) | |
| Classification | ||||
| Supraglottic LSCC | 34 | 15 (44.11) | 19 (55.88) | 0.634 |
| Glottic LSCC | 24 | 12 (50.00) | 12 (50.00) | |
| Subglottic LSCC | 8 | 5 (62.50) | 3 (37.5) | |
| Differentiation | ||||
| High | 37 | 19 (51.35) | 18 (48.65) | 0.870 |
| Moderate | 20 | 9 (45.00) | 11 (55.00) | |
| Poor | 9 | 4 (44.44) | 5 (55.56) | |
| Lymph node metastasis | ||||
| Negative | 42 | 15 (35.71) | 27 (64.29) | 0.006 |
| Positive | 24 | 17 (70.83) | 7 (29.17) | |
| TNM stage | ||||
| I–II | 36 | 13 (36.11) | 23 (63.89) | 0.028 |
| III–I | 30 | 19 (63.33) | 11 (36.67) | |
P-value obtained from the χ2 test. THBS-1, thrombospondin-1; LSCC, laryngel squamous cell cancer; M, methylated; U, unmethylated; TNM, tumor, node, metastasis.
Reactivation of THBS-1 expression following treatment with 5-aza-dC
To confirm that aberrant methylation was responsible for silencing THBS-1 expression, Hep-2 cells were treated with 1 µM of demethylating agent 5-aza-dC for 6, 24, 48, 72, and 96 h, respectively. The methylation status of THBS-1 and the effect of aberrant methylation of THBS-1 on THBS-1 mRNA and protein expression were evaluated (Fig. 3). In Hep-2 cells, complete methylation of THBS-1 was observed in control cells, however, following 5-Aza-dC treatment for 96 h, the methylation status of THBS-1 changed from methylated to a partially methylated state (Fig. 3A).
Figure 3.

Changes in methylation status and expression of THBS-1 induced by 5-aza-dC in Hep-2 cells. (A) Methylation-specific PCR indicating the presence of unmethylated bands of THBS-1 in Hep-2 cells treated with 1 µmol/l 5-aza-dC. The presence of only methylated bands indicated complete methylation while the presence of methylated and unmethylated bands indicated a partially methylated state. (B) Western blot analysis of THBS-1 protein expression levels in Hep-2 cells treated with 1 µmol/l 5-aza-dC at the indicated times. (C) Analysis of THBS-1 mRNA expression levels using reverse transcription-quantitative polymerase chain reaction in Hep-2 cells treated with 1 µmol/l 5-aza-dC at the indicated times. ***P<0.001 vs. other 5-Aza-dC treatment time points. THBS-1, thrombospondin 1; Ctrl, control group; M, methylated bands; U, unmethylated bands.
The current study also investigated whether the change in methylation status of THBS-1 was associated with change in expression of THBS-1 following 5-aza-dC treatment. It was observed that the expression level of THBS-1 mRNA was increased by 5-aza-dC in a time-dependent manner (0.867±0.129, 1.747±0.170, 2.703±0.207 and 4.110±0.250, at 24, 48, 72 and 96 h, respectively) compared with those in the control group and 6 h (P<0.001; Fig. 3C). Increased THBS-1 protein levels were identified following 5-aza-dC treatment using western blotting (P<0.05; Fig. 3B). These results suggest the aberrant methylation of THBS-1 suppresses THBS-1 mRNA and protein expression in Hep-2 human laryngeal carcinoma cell line.
Reactivation of THBS-1 expression with 5-aza-dC inhibits the viability and invasion of Hep-2 cell
To further examine whether the reactivation of THBS-1 expression can regulate LSCC proliferation and invasion, the present study analyzed the viability and invasive capability of Hep-2 cells using the CCK-8 and invasion assay. As presented in Fig. 4A and Table IV, a concentration- and time- dependent growth inhibition of cell proliferation was observed in the Hep-2 cells (all P<0.05). The invasion assay demonstrated that the number of invading Hep-2 cells was 124.67±6.51, 97.67±8.50, 75.67±8.33, and 46.67±4.04, in the control, 5-aza-dC 24, 48 and 72 h groups, respectively. The number of invading Hep-2 cells was significantly reduced following 5-aza-dC treatment when compared with the control group (P<0.01 for 24 h 5-aza-dC treatment; P<0.001 for 48 and 7 h 5-aza-dC treatment; Fig. 4B and C).
Figure 4.

Effect of 5-aza-dC on the viability and invasion of Hep-2 cells in vitro. (A) Cell viability was measured with Cell Counting Kit-8 following the treatment of Hep-2 cells with 5-aza-dC at different concentrations (0, 0.1, 1 and 5 µmol/l) for 24, 48, 72 and 96 h. (B) The number of cells that had invaded at the 24 h time point. The values represent the mean ± standard deviation. (C) Invasive ability of Hep-2 cells was determined using the Transwell assay following treatment with 5-aza-dC. Representative images of treated and untreated cells are presented (magnification, ×200). **P<0.01, ***P<0.001 vs. the control group 5-Aza-dC, 5-aza-2′-deoxy-cytidine; OD, optical density; Ctrl, control.
Table IV.
Inhibitory rate (%) for different concentrations of 5-aza-dC at different time points in Hep-2 cells.
| 5-Aza-dC concentration | 24 h | 48 h | 72 h | 96 h |
|---|---|---|---|---|
| 0 µmol/l (control) | – | – | – | – |
| 0.1 µmol/l | 0.69±0.51a,b | 2.22±0.73a,b | 2.37±0.35a,b | 6.28±1.43a,b |
| 1 µmol/l | 7.20±0.94a,b | 7.90±1.62a,b | 22.91±2.59a,b | 28.07±0.23a,b |
| 5 µmol/l | 16.0±2.07a,b | 16.5±1.82a,b | 28.75±2.61a,b | 39.1±1.83a,b |
P<0.05 vs. other 5-aza-dC concentrations at the same time point.
P<0.05 vs. other time points at the same concentration of 5-aza-dC. Results represent mean ± standard deviation from three experiments. 5-Aza-dC, 5-aza-2′-deoxy-cytidine.
Discussion
Thrombospondins are a family of homologous proteins involved in the regulation of cellular phenotype and extracellular structure during tissue genesis and remodeling (14). The first to be identified was THBS-1, it has been demonstrated to modulate progression and metastasis of tumors (15). However, the role of THBS-1 in tumor progression and metastasis remains controversial and presents stimulatory and inhibitory effects (6–9). The present study demonstrated for the first time, to the best of our knowledge, that the levels of THBS-1 mRNA and protein expression were significantly decreased in LSCC tissues compared with adjacent non-tumorous tissues, and were negatively correlated with lymph node metastasis and advanced clinical stage. These observations are consistent with the results from previous studies on non-small cell lung cancer (16), cutaneous squamous cell carcinoma (17), and melanoma (11), and suggested that THBS-1 acts as a tumor suppressor in LSCC, which can inhibit the development and metastasis of LSCC.
DNA methylation on the gene promoter region, which often results in the suppression of transcription, is considered to be an underlying mechanism of tumor suppressor gene inactivation (18–19). Aberrant THBS-1 methylation has been reported in other types of cancer (10–12). To elucidate whether decreased expression of THBS-1 in LSCC is a result of DNA methylation, the methylation status of THBS-1 in LSCC was investigated and the association between methylation status and expression levels of THBS-1 in LSCC was determined. The results demonstrated that the THBS-1 gene was identified to exhibit a more frequent methylation rate in LSCC compared with adjacent non-tumorous tissues, which may indicate that aberrant THBS-1 methylation is important in the development of LSCC. Furthermore, the THBS-1 expression levels in methylated LSCC tissues were significantly lower than those in the unmethylated LSCC tissues. These data suggested a potential association between THBS-1 methylation and loss of THBS-1 expression. To further confirm that aberrant DNA methylation results in inhibition of THBS-1 expression, the effect of the demethylation by 5-aza-dC on THBS-1 gene methylation and THBS-1 re-expression was examined in the Hep-2 cell line. The results indicated that the unmethylated status of THBS-1 increased with increasing THBS-1 mRNA and protein expression levels. Thus, methylation of THBS-1 gene directly induced THBS-1 inactivation.
A number of previous studies have considered THBS-1 methylation may be associated with clinicopathological features of tumors (12,20–22). However, to the best of our knowledge, there has been no study evaluating the association between the methylation status of THBS-1 and clinicopathological characteristics of LSCC. The present study demonstrated that THBS-1 hypermethylation was associated with lymph node metastasis and TNM stage of LSCC, however, not associated with age, gender, primary site and histological differentiation. These significant associations suggested a functional role for THBS-1 gene methylation in invasion and metastasis of LSCC, consistent with results from gastric cardia adenocarcinoma (12), gastric carcinoma (20), penile squamous cell carcinoma (21) and meningiomas (22). To provide further evidence on the association between THBS-1 methylation and progression of LSCC, the effect of the demethylation reagent 5-aza-dC on the proliferation and invasion ability of Hep-2 cells was investigated. The results from the current study suggested that the suppression of proliferation and invasive ability due to 5-aza-dC may result from DNA demethylation and reactivation of THBS-1. These findings were consistent with previous results that indicated increased expression of THBS-1 decreased angiogenesis, tumor growth, and metastasis in melanoma (11) and human neuroblastoma (23). Although the influence of other possible methylation-silenced tumor suppressor genes cannot be eliminated, the findings of the present study suggest that hypermethylation status of THBS-1 may result in decreased THBS-1 and accelerated LSCC progression and invasion.
5-Aza-dC is a strong inducer of DNA demethylation that acts by binding methyltransferase enzymes, resulting in the reactivation of the corresponding genes silenced by DNA methylation (24). Previously, 5-aza-dC has been demonstrated to synergize with progesterone therapy to inhibit endometrial cancer cell growth and invasion (25). In Hep-2 cells, 5-aza-dC significantly inhibited tumor cell proliferation and invasion. Although the focus of the present study was THBS-1, these results provide an additional rationale for investigating 5-aza-dC in the treatment of LSCC.
There are also a number of limitations in the present study. Due to contaminations in the available stocks of Hep-2 cells, it is likely that the cells used in the current study are HeLa contaminants. However, this may suggest that the demethylation of THBS-1 in human cervical cancer cell results in increased THBS-1 expression to inhibit tumor growth and invasion. Thus, it can be hypothesized that the methylation of THBS-1 is involved in tumor invasion and metastasis in cervical cancer patients, which could be further demonstrated in future studies.
In conclusion, the present study is the first to determine that THBS-1 is a tumor suppressor gene in LSCC and that DNA methylation of THBS-1 is an epigenetic event that silences this gene. Aberrant hypermethylation and reduced expression of THBS-1 promote the invasion of LSCC, which may be a useful biomarker of tumor progression. The current study also suggested an improved understanding of DNA methylation may provide a potential therapeutic target for LSCC. Further research is required to elucidate the tumor-suppressive mechanism of THBS-1 in LSCC.
Acknowledgments
The present study was supported by the National Natural Science Foundation of China (grant no. 81402606).
References
- 1.Choong N, Vokes E. Expanding role of the medical oncologist in the management of head and neck cancer. CA Cancer J Clin. 2008;58:32–53. doi: 10.3322/CA.2007.0004. [DOI] [PubMed] [Google Scholar]
- 2.Belcher R, Hayes K, Fedewa S, Chen AY. Current treatment of head and neck squamous cell cancer. J Surg Oncol. 2014;110:551–574. doi: 10.1002/jso.23724. [DOI] [PubMed] [Google Scholar]
- 3.Shivapurkar N, Gazdar AF. DNA methylation based biomarkers in non-invasive cancer screening. Curr Mol Med. 2010;10:123–132. doi: 10.2174/156652410790963303. [DOI] [PMC free article] [PubMed] [Google Scholar]
- 4.Heyn H, Esteller M. DNA methylation profiling in the clinic: Applications and challenges. Nat Rev Genet. 2012;13:679–692. doi: 10.1038/nrg3270. [DOI] [PubMed] [Google Scholar]
- 5.Silverstein RL, Febbraio M. CD36-TSP-HRGP interactions in the regulation of angiogenesis. Curr Pharm Des. 2007;13:3559–3567. doi: 10.2174/138161207782794185. [DOI] [PubMed] [Google Scholar]
- 6.Kazerounian S, Yee KO, Lawler J. Thrombospondins in cancer. Cell Mol Life Sci. 2008;65:700–712. doi: 10.1007/s00018-007-7486-z. [DOI] [PMC free article] [PubMed] [Google Scholar]
- 7.Yee KO, Connolly CM, Duquette M, Kazerounian S, Washington R, Lawler J. The effect of thrombospondin-1 on breast cancer metastasis. Breast Cancer Res Treat. 2009;114:85–96. doi: 10.1007/s10549-008-9992-6. [DOI] [PMC free article] [PubMed] [Google Scholar]
- 8.Lin XD, Chen SQ, Qi YL, Zhu JW, Tang Y, Lin JY. Overexpression of thrombospondin-1 in stromal myofibroblasts is associated with tumor growth and nodal metastasis in gastric carcinoma. J Surg Oncol. 2012;106:94–100. doi: 10.1002/jso.23037. [DOI] [PubMed] [Google Scholar]
- 9.Kasper HU, Ebert M, Malfertheiner P, Roessner A, Kirkpatrick CJ, Wolf HK. Expression of thrombospondin-1 in pancreatic carcinoma: Correlation with microvessel density. Virchows Arch. 2001;438:116–120. doi: 10.1007/s004280000302. [DOI] [PubMed] [Google Scholar]
- 10.Rojas A, Meherem S, Kim YH, Washington MK, Willis JE, Markowitz SD, Grady WM. The aberrant methylation of TSP1 suppresses TGF-beta1 activation in colorectal cancer. Int J Cancer. 2008;123:14–21. doi: 10.1002/ijc.23608. [DOI] [PMC free article] [PubMed] [Google Scholar]
- 11.Lindner DJ, Wu Y, Haney R, Jacobs BS, Fruehauf JP, Tuthill R, Borden EC. Thrombospondin-1 expression in melanoma is blocked by methylation and targeted reversal by 5-Aza-deoxycytidine suppresses angiogenesis. Matrix Biol. 2013;32:123–132. doi: 10.1016/j.matbio.2012.11.010. [DOI] [PMC free article] [PubMed] [Google Scholar]
- 12.Guo W, Dong Z, He M, Guo Y, Guo J, Chen Z, Yang Z, Kuang G. Aberrant methylation of thrombospondin-1 and its association with reduced expression in gastric cardia adenocarcinoma. J Biomed and Biotechnol. 2010;2010:721485. doi: 10.1155/2010/721485. [DOI] [PMC free article] [PubMed] [Google Scholar]
- 13.Livak KJ, Schmittgen TD. Analysis of relative gene expression data using real-time quantitative PCR and the 2(-Delta Delta C(T)) method. Methods. 2001;25:402–408. doi: 10.1006/meth.2001.1262. [DOI] [PubMed] [Google Scholar]
- 14.Chen H, Herndon ME, Lawler J. The cell biology of thrombos-pondin-1. Matrix Biol. 2000;19:597–614. doi: 10.1016/S0945-053X(00)00107-4. [DOI] [PubMed] [Google Scholar]
- 15.Baenziger NL, Brodie GN, Majerus PW. A thrombin-sensitive protein of human platelet membranes. Proc Natl Acad Sci USA. 1971;68:240–243. doi: 10.1073/pnas.68.1.240. [DOI] [PMC free article] [PubMed] [Google Scholar]
- 16.Fleitas T, Martínez-Sales V, Vila V, Reganon E, Mesado D, Martín M, Gómez-Codina J, Montalar J, Reynés G. VEGF and TSP1 levels correlate with prognosis in advanced non-small cell lung cancer. Clin Transl Oncol. 2013;15:897–902. doi: 10.1007/s12094-013-1020-6. [DOI] [PubMed] [Google Scholar]
- 17.Streit M, Velasco P, Brown LF, Skobe M, Richard L, Riccardi L, Lawler J, Detmar M. Overexpression of thrombospondin-1 decrease angiogenesis and inhibits the growth of human cutaneous squamous cell carcinomas. Am J Pathol. 1999;155:441–452. doi: 10.1016/S0002-9440(10)65140-1. [DOI] [PMC free article] [PubMed] [Google Scholar]
- 18.Zhang C, Li H, Wang Y, Liu W, Zhang Q, Zhang T, Zhang X, Han B, Zhou G. Epigenetic inactivation of the tumor suppressor gene RIZI in hepatocellular carcinoma involves both DNA methylation and histone modifications. J Hepatol. 2010;53:889–895. doi: 10.1016/j.jhep.2010.05.012. [DOI] [PubMed] [Google Scholar]
- 19.Cherrier T1, Suzanne S, Redel L, Calao M, Marban C, Samah B, Mukerjee R, Schwartz C, Gras G, Sawaya BE, et al. p21 (WAF1) gene promoter is epigenetically slienced by CTIP2 and SUV39H1. Oncogene. 2009;28:3380–3389. doi: 10.1038/onc.2009.193. [DOI] [PMC free article] [PubMed] [Google Scholar]
- 20.Oue N, Matsumura S, Nakayama H, Kitadai Y, Taniyama K, Matsusaki K, Yasui W. Reduced expression of the TSP1 gene and its association with promoter hypermethylation in gastric carcinoma. Oncology. 2003;64:423–429. doi: 10.1159/000070302. [DOI] [PubMed] [Google Scholar]
- 21.Guerrero D, Guarch R, Ojer A, Casas JM, Ropero S, Mancha A, Pesce C, Lloveras B, Garcia-Bragado F, Puras A. Hypermethylation of the thrombospondin-1 gene is associated with poor prognosis in penile squamous cell carcinoma. BJU Int. 2008;102:747–755. doi: 10.1111/j.1464-410X.2008.07603.x. [DOI] [PubMed] [Google Scholar]
- 22.Gong J, Zhu SG, Wu CY, Li XG, Liu YG, Ren XH, Zhang Y. Aberrant methylation of NF2, TIMP-3 and THBS1 genes and their diagnostic values in meningiomas. Zhonghua Yi Xue Za Zhi. 2012;92:2889–2892. In Chinese. [PubMed] [Google Scholar]
- 23.Yang QW, Liu S, Tian Y, Salwen HR, Chlenski A, Weinstein J, Cohn SL. Methylation-associated silencing of the thrombospondin-1 gene in human neuroblastoma. Cancer Res. 2003;63:6299–6310. [PubMed] [Google Scholar]
- 24.Meng CF, Zhu XJ, Peng G, Dai DQ. Role of histone modifications and DNA methylation in the regulation of O6-methylguanine-DNA methyltransferase gene expression in human stomach cancer cells. Cancer Invest. 2010;28:331–339. doi: 10.1080/07357900903179633. [DOI] [PubMed] [Google Scholar]
- 25.Hu Q, Yu L, Chen R, Wang YL, Ji L, Zhang Y, Xie Y, Liao QP. 5-aza-2′-deoxycytidine improves the sensitivity of endometrial cancer cells to progesterone therapy. Int J Gynecol Cancer. 2012;22:951–959. doi: 10.1097/IGC.0b013e3182540160. [DOI] [PubMed] [Google Scholar]