

Abstract
The ballistocardiogram (BCG), a signal describing the reaction forces of the body to cardiac ejection of blood, has recently gained interest in the research community as a potential tool for monitoring the mechanical aspects of cardiovascular health for patients at home and during normal activities of daily living. An important limitation in the field of BCG research is that while the BCG signal measures the forces of the body, the information desired (and understood) by clinicians and caregivers, regarding mechanical health of the cardiovascular system, is typically expressed as blood pressure or flow. This paper aims to explore, using system identification tools, the mathematical relationship between the BCG signal and the better-understood impedance cardiography (ICG) and arterial blood pressure (ABP) waveforms, with a series of human subject studies designed to asynchronously modulate cardiac output and blood pressure and with different magnitudes. With this approach, we demonstrate for 19 healthy subjects that the BCG waveform more closely maps to the ICG (flow) waveform as compared with the finger-cuff-based ABP (pressure) waveform, and that the BCG can provide a more accurate estimate of stroke volume ( ,
,  ) as compared with pulse pressure changes (
 ). We also examined, as a feasibility study, for one subject, the ability to calibrate the BCG measurement tool with an ICG measurement on the first day, and then track changes in stroke volume on subsequent days. Accordingly, we conclude that the BCG is a signal more closely related to blood flow than pressures, and that a key health parameter for titrating care—stroke volume—can potentially be accurately measured with BCG signals at home using unobtrusive and inexpensive hardware, such as a modified weighing scale, as compared with the state-of-the-art ICG and ABP devices, which are expensive and obtrusive for use at home.
Keywords: Ballistocardiogram, hemodynamics, cardiovascular health, home monitoring
GA Legend KM
I. Introduction
Cardiovascular disease is the leading cause of death in the U.S., claiming more than 2,000 lives every day, and heart-related healthcare expenditures total more than $320 billion annually [1]. Moreover, both incidence and cost related to CVD are projected to increase further in the coming decades, leading to an imbalance between the number of healthcare providers and patients with CVD [2]. One way to address this pressing problem would be to enable in-depth monitoring of cardiovascular health at home with inexpensive and connected technologies; this could ultimately allow care to be automatically optimized to the needs of the patient with proactive, feedback-controlled therapies, and could thereby reduce the burden on the healthcare system by reducing the need for costly reactive measures such as emergency room visits. For monitoring CVD at home in particular, many technologies are available for sensing and assessing the electrophysiology of the heart [3], [4]; however, few monitoring methods provide information about the equally important mechanical aspects of cardiac function related to left ventricular function and hemodynamics [5].
Ballistocardiography (BCG), which is a measure of the reactionary forces of the body in response to the ejection of blood and movement of blood throughout the arterial tree, has recently re-emerged as a promising methodology for assessing the mechanical health of the heart [5]. Recent research has shown that the BCG signals can be measured accurately using modified chairs and beds [6]–[9], weighing scales [10], [11], miniature accelerometers [5], [12] and force plates [13]. The BCG derived signal features have been shown to correlate well with the pre-ejection period–the isovolumetric contraction period of the cardiac cycle [14], [15]–a surrogate measure of myocardial contractility [10], [16]. Other empirical studies have also shown BCG features to be related to cardiac output changes [17]. However, since the BCG is a measure of body forces, the understanding of the precise origin of the BCG signal, and in particular how the signal mathematically relates to arterial blood pressure and aortic blood flow, is limited. This limitation represents a fundamental scientific gap that must be addressed for the BCG to be adopted in clinical use.
Ideally, one would directly measure the arterial blood pressure (ABP) or blood flow (i.e., cardiac output, CO) in the home rather than measure the BCG in the first place, then attempt to relate the BCG to these parameters. However, state-of-the-art tools for measuring the ABP and CO continuously are obtrusive, expensive and require a medical professional to administer the measurement; accordingly, they are not feasible for use at home. The ABP is measured using volume-clamping finger-cuffs [18], requiring expensive equipment and bulky, cumbersome hardware. The CO, which is the product of stroke volume (SV) and heart rate (HR), can be estimated from impedance cardiogram (ICG) signals [19], [20], also requiring expensive equipment, and eight electrodes to be placed precisely (typically by a medical professional or researcher) on the neck and thorax. Nevertheless, significant research efforts over the past several decades have led to a strong understanding of the physical origin of both finger-cuff based continuous ABP and thoracic ICG waveforms. If the BCG waveform – which can be measured by unobtrusive, inexpensive, and simple hardware readily deployable in home settings – could be anchored to either of these better-understood measurement modalities, then at-home accurate measurement of ABP or CO could be feasible for myriad CVD monitoring needs.
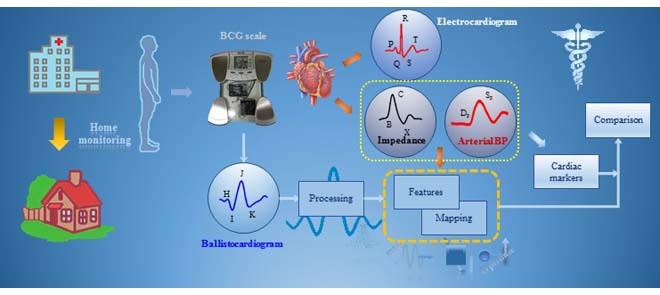
The objective of this study is to investigate if the BCG signal is more in accord with the pressure of the blood or its flow, as shown in Fig. 1. Note that while pulse pressure (PP), defined as the difference between systolic (SP) and diastolic (DP) blood pressure, is closely related to CO, the dependence changes significantly throughout the day (or even on a second-by-second basis, for example during exercise or with fluctuations in ambient temperature) with changes in total peripheral resistance (TPR) due to modified autonomic state or vasomotor tone. To better understand the origin of the BCG, we extract features from the weighing-scale BCG heartbeats and assess correlations of these features with corresponding features from the ABP and ICG heartbeats. Next, we compare the BCG waveform to the ABP and ICG waveforms, with the blood pressure and CO of the subjects being modulated asynchronously. Finally, based on our findings, we provide a preliminary methodology for using ICG calibration to estimate serial changes in CO from patients at home. This work, if successful, could provide a tool, for example, for monitoring heart failure (HF) patients at home following discharge from the hospital, with the goal of potentially predicting exacerbations and thus reducing unnecessary re-hospitalizations.
FIGURE 1.

Physical phenomena associated with the action of heart. The forced ejection of blood into the aorta (represented by  in the illustration) is characterized by blood pressure (as derived from arterial blood pressure, ABP, waveforms), blood flow (as derived from impedance cardiogram, ICG, waveforms) and whole body movement (as derived from ballistocardiogram, BCG, waveforms). Analyzing the relationship between BCG and ABP/ICG waveforms can provide insight into the origin of the BCG and thereby improve the ability to derive cardiovascular health parameters from this signal.
II. Methods
A. Protocol
This study was conducted under a protocol reviewed and approved by the Georgia Institute of Technology Institutional Review Board (IRB). All subjects provided written consent before experimentation. Nineteen healthy subjects were recruited for the study (demographics: 5 females and 14 males, 24.4±4.8 years old, 175±8.8 cm tall and weighing 71 ± 12.5 kg). The protocol aimed to create changes in the stroke volume and blood pressure through perturbations as shown in Fig. 2. The protocol consisted of five phases involving two perturbations separated by recovery time. Each subject was asked to stand on the BCG weighing scale in resting state for 60 seconds. Then a Valsalva maneuver was performed for 15 seconds during which the subjects were asked to bear down. This was followed by a recovery period of 60 seconds. Finally, each subject performed a handgrip challenge for 30 seconds in the form of an isometric contraction against a fixed resistance that was also followed by 30 seconds of recovery. The purpose of these perturbations was to cause a change in the parameters related to cardiac function and hemodynamics, and to modulate the degree to which each parameter changed (stroke volume as compared to pulse pressure) differently to examine whether the BCG captured more of the variability in stroke volume or pulse pressure. All the measurements were taken while the subject stood in an upright posture and the ICG, ECG and ABP measurements were collected simultaneously with the BCG from each subject. The ABP measurements were taken non-invasively and continuously from a volume-clamping finger-cuff device that provides continuous blood pressure waveforms as compared to arm-cuff device, which only gives estimates of systolic and diastolic blood pressure values.
FIGURE 2.

(a) Experimental setup and processing steps for the BCG, ICG and ABP. (b) Protocol showing different phases of data collection for each subject along with time intervals and also the mean and standard deviation of the change in stroke volume and systolic blood pressure during perturbations compared to values in resting state for all subjects. The values are shown for post-Valsalva recovery, handgrip and post-handgrip recovery phases.
B. Hardware Design
The ECG and ICG signals were measured using the BN-EL50 and BN-NICO wireless measurement modules (BIOPAC Systems, Inc., Goleta, CA) and then transmitted wirelessly to the data acquisition systems (MP150WSW, BIOPAC Systems, Inc., Goleta, CA). The BCG was measured with a modified weighing scale using the strain gauge bridge and an analog amplifier [21]. The arterial blood pressure was measured non-invasively and on a continuous beat-by-beat basis with the A2SYS Nexfin Monitor (Edwards Lifesciences, Irvine, CA) that uses the volume-clamping technique on one finger [18]. The ECG, ICG, BCG and the ABP signals were all sampled at 1 kHz.
C. Data Processing
The BCG, ICG and ECG signals were filtered with finite impulse response (FIR) Kaiser window band-pass filters (cut-off frequencies: 0.8-15 Hz for the BCG, 0.8-35 Hz for the ICG and 2.5-40 Hz for the ECG) while the ABP signals were low-pass filtered (FIR, Kaiser window, cut-off: 20Hz). The ABP signals were low-pass filtered to preserve the DC value for accurate estimation of systolic and diastolic blood pressure. After filtering, the R-peaks in the ECG signal, denoted by Ri ( represented the peak index), were detected using a simple peak detection algorithm and results were manually verified to make sure all peaks were detected correctly. Specifically, a constant threshold of 50% of the maximum amplitude of the band-pass filtered ECG was computed for each subject; local maxima greater in amplitude than this threshold were then located automatically and annotated as R-waves; R-waves found to be closer than 300 ms to each other were discarded as false positives. The minimum R-R interval was calculated in each phase of the data collection protocol for each subject. Let the minimum R-R interval in each phase be denoted by winp (
 represents the phase, i.e.,
  [rest, Valsalva, recovery, handgrip, recovery]). With the ECG R-peaks as reference, the BCG, ICG and ABP signals were segmented into individual heartbeats or frames [22]. The data from the 15-second Valsalva period were not analyzed as these included noise caused by subject-induced movement during the Valsalva maneuver. The length of each extracted heartbeat or frame was Ri – 300ms to
  , i.e., each frame contained 300ms before the Ri peak and winp samples after Ri as shown in Fig. 2(a). We shall refer to the first 300ms in the extracted heartbeats as pre-R samples. All the beats extracted in each of the phases were ensemble averaged [23] to reduce noise and features were extracted from the ensemble-averaged traces. Hence for each subject, four ensemble-averaged traces corresponding to rest, post-Valsalva recovery period, handgrip and post-handgrip recovery period were obtained from the BCG, ICG and ABP signals.
D. Extraction of Features
To understand the BCG-to-ICG and BCG-to-ABP relationship, a number of features were extracted from the BCG heartbeats and correlated (Pearson’s correlation) with features obtained from the ICG and ABP. The annotated BCG, ICG and ABP heartbeats are shown in Fig. 3. Three features were extracted from the BCG heartbeats: (1) the I-J amplitude normalized by root mean square energy in the heartbeat, i.e., I-J/ , where
  represented the root mean square energy in the BCG heartbeat / frame and is given by
  (
( is the total number of samples in a BCG heartbeat
  , (2) the R-J interval, i.e., the time interval between the ECG R-peak and the J-peak on the BCG heartbeat, and (3) the (M-K
  -J amplitude)/
 , where M corresponded to the point of maximum slope. The motivation behind multiplying the BCG amplitude and time feature was to design a feature that captures the energy of the main BCG complex. The idea was to quantify the mechanical energy in each heartbeat, which can potentially increase with increased stroke volume.
FIGURE 3.

The annotated BCG, ICG and ABP waveforms. The features extracted from these are shown in grey.
Three features were extracted from the ICG heartbeats which included: (1) the maximum peak value i.e., the  value which represents the maximal speed of blood ejection, (2) the pre-ejection period (PEP) or the R-B interval, i.e., the time difference between the ECG R-peak and the B-point on the ICG, and (3) the time difference between the X- and the B-point, i.e., the left ventricle ejection time (LVET). These features characterized the blood flow in the vessels and were required for estimation of stroke volume from the ICG.
The features from the ABP heartbeats included: (1) the maximum peak value of the beat representing systolic blood pressure  , (2) the foot value
  before the maximum peak, denoting the diastolic blood pressure, and (3) the difference between
  and
and  called the pulse pressure PP [24].
E. Mapping the BCG Heartbeats to ICG and ABP Using System Identification
In order to further analyze the relationship between the BCG and ICG and also between the BCG and ABP, the BCG heartbeats were separately mapped to the corresponding ICG and ABP heartbeats using subject-specific FIR system identification methods: i.e., an impulse response was estimated for an FIR filter that converted the BCG heartbeats to the ICG heartbeats and another impulse response for the BCG to ABP conversion.
In general, the output  of a linear filter of order
  operating on an input
  is obtained by convolving the impulse response
  of the filter with the input (
 and
and  . In least squares terminology, the output is given by the equation
  , where
  is the convolution matrix whose entries are made up of elements of
  . If the input vector is zero-padded to account for unavailable data during the convolution operation, then this method is called the Auto-correlation method [25]. If the desired output signal is
  , then the optimum solution
  can be obtained by minimizing the expression
 |
where  is the regularization constant to avoid over-fitting. The least squares solution is now given as
 |
In this study, the heartbeats from the BCG, ICG and ABP data in the 60-second resting phase for each subject were used to train the systems using  -fold cross-validation [26] and the performance of the trained systems was checked on the remaining phases as shown in Fig. 4. The objective was to find the optimum filter length, number of samples before the Ri peak in each frame and the value of the regularization constant
  that provided the least error in mapping the BCG heartbeat (one frame) to the ICG heartbeat or the BCG heartbeat to the ABP heartbeat. This was achieved by sweeping through filter lengths from 1 to 500 samples, 0 to 300 pre-R samples and values of
  (
( to
to  using
using  cross-validation.
FIGURE 4.

FIR system identification: the filters were trained on the heartbeats during rest and tested at perturbations.
In subject-specific BCG to ICG mapping, for each combination of the above mentioned three parameters, the BCG and ICG heartbeats in the resting phase of a subject’s recording were each randomly partitioned into 2-folds respectively. One fold from each modality was used in training while the other in validation phase. The ensemble-averaged traces were calculated for each of the 2-folds of the BCG and the ICG. In the training phase, one ensemble-averaged BCG trace, corresponding to one of the two BCG-folds, was selected as the input  and one ICG ensemble-averaged trace corresponding to one of the two ICG folds was selected as output
  . The impulse response
  of the system was then estimated according to equation (2). The estimated
  was then used to convert the ensemble-averaged BCG trace, from the remaining fold, to an ICG trace and validation error was derived by calculating the Euclidean distance between the resulting waveform and the desired output, i.e., the ensemble-averaged ICG trace from the remaining ICG fold. The above process was repeated 5 times, hence giving the name
  -fold cross-validation and mean cross-validation error was computed. The combination of filter length, pre-R samples and value of
  that resulted in the lowest validation error were chosen as the three required parameters for that subject. A similar process was carried out for mapping the BCG to ABP waveforms.
Once subject-specific FIR filters were generated, they were used to convert the ensemble-averaged traces in the post-Valsalva recovery, handgrip and post-handgrip recovery phases into the corresponding ICG and ABP waveforms. For the ICG, the points of interest that include the B-,  and the X-point as shown in Fig. 3(a), were detected on the true ICG traces and also on the waveforms obtained from the FIR filters. The stroke volume SV was then calculated using the Sramek’s equation [27]
 |
where  represents the subject’s height and
  denotes the base impedance. The
  value was estimated as the foot of the ensemble averaged heartbeats of the raw impedance signal obtained from the ICG [20]. The value of
  was estimated in the resting phase for each subject and the same value was used during the perturbation phases. Let the stroke volume during the first 60-seconds of rest be represented by SV
 and during the other phases be denoted by SVp. The percentage change in stroke volume during phase
  was then calculated using the equation
  – SV
– SV /SV
/SV . A linear regression/correlation analysis (Pearson’s) was done between the values
  obtained from the ICG waveforms and
  values obtained from the trained filters from all subjects. The outliers were detected using the minimum-covariance distance (MCD) estimator [28] and were removed before correlation analysis. Similarly, the points corresponding to the systolic and diastolic blood pressures were detected in the true ABP waveforms and the ABP waveforms estimated from the FIR filters trained for mapping the BCG to ABP. The pulse pressure, PP, was calculated as the difference between the systolic and diastolic blood pressure values. The percentage change in pulse pressure for phases other than resting state was calculated as
  – PP
– PP /PP
/PP and correlation analysis was done for
  data points obtained from the true and converted ABP waveforms for all subjects. The outliers were detected using the MCD approach [28] and removed from the analysis.
F. Proof-of-Concept Single-Subject Multi-Day Hemodynamic Assessment
In addition to the main protocol, data were collected from one subject (24 years, 58kg, 162cm height) for five consecutive days. The objective was to assess the feasibility of training a filter on the first day and then assessing its performance on the remaining days for estimation of stroke volume from the BCG. The subject was asked to stand still on the BCG weighing scale for 2 minutes on each of the 5 days. The signals collected consisted of the ICG, ECG and ABP in addition to the BCG on each day. An impulse response to map the BCG heartbeat to the ICG heartbeat was obtained from the first day using the method described earlier. The data on each of the remaining 4 days was ensemble averaged and used as input for the trained filter from the first day.
III. Results
A. Correlation Results From Waveform Features
The features estimated from the BCG heartbeats of 19 subjects in all the data collection phases showed good correlation with the corresponding features from the ICG heartbeats while none of the BCG-derived features correlated well with the ABP-derived features. The BCG I-J amplitude normalized by the root mean square energy showed a correlation value of  (
( ) with the ICG maximum peak
  and also a value of
  (
( ) with the LVET from the ICG. The ICG maximum peak
  also showed a good correlation (
 ,
,  ) with (M-K
  -J amplitude)/
 . The R-J intervals obtained from the BCG heartbeats displayed a correlation of 0.75 (
 ) with the pre-ejection period from the ICG. This is in agreement with a previous study [10]. The BCG derived features based on amplitude and timing intervals showed poor correlation with systolic and diastolic blood pressure values and also with pulse pressure and hence are not explicitly reported here. The correlation values for all such comparisons were less than 0.05, i.e.,
  .
.
B. BCG Mapping Results
The subject-specific FIR filters for mapping the BCG waveforms to the ICG, obtained from the resting phase heartbeats, were tested on the ensemble-averaged BCG traces from the post-Valsalva recovery period, handgrip and post-handgrip recovery phases for each subject. Hence, three data points were obtained for each subject. The correlation results for percentage change in stroke volume are summarized in Fig. 5(a), which shows a correlation value of 0.73 ( ) for all subjects. Similarly, the BCG ensemble-averaged waveforms in the perturbation phases, except during Valsalva, were also converted to corresponding ABP waveforms using the subject specific FIR filter trained to convert the BCG into the ABP. The percentage change in the pulse pressure estimated from the converted waveforms shows a correlation value of 0.26 with the corresponding values from true ABP waveforms in these phases.
FIGURE 5.

(a) Correlation results for stroke volume values obtained from the BCG mapped waveforms and the ICG waveforms. The relationship is statistically significant ( ) (b) Correlation results for change in pulse pressure from the BCG mapped and original ABP waveforms. N represents the total number of data points while n denotes the number of data points considered in the analysis after outlier rejection.
C. Single-Subject Results
The results for single subject multi-day trial are shown in Fig. 6. The ICG waveforms obtained from the FIR system were used to calculate the stroke volume on the test days. The results were compared with the corresponding stroke volume values from the measured ICG. The system performed well on the testing days as the errors in stroke volume from the ICG measurements and the stroke volume from the system estimated waveforms are very small on 3 of the 4 test days. There is a difference of 7 ml in FIR based estimated and ICG based stroke volume on the third day. It was observed that the BCG data on the third day had low signal-to-noise ratio due to the presence of motion artifacts.
FIGURE 6.

Single subject stroke volume estimation from the FIR system trained on Day 1 and tested on the data on the remaining days. ErrorSV (ml) represents the error between the estimated stroke volume from the system and the stroke volume obtained from the ICG.
IV. Discussion
Based on the results derived in the previous sections, we conclude that leveraging the common features of BCG and ICG waveforms may provide a methodology by which stroke volume estimates can be extracted from BCG waveforms. Specifically, the mapping technique employed in this work shows that BCG waveforms accurately capture corresponding changes in ICG waveforms and, consequently, changes in hemodynamic parameters (i.e., stroke volume).
In contrast, the features from the blood pressure waveforms do not show any significant relationship with the BCG-derived features and the BCG waveforms do not capture the change in blood pressure parameters. Recent research [29], [30], has shown that the BCG waveforms can, on the other hand, be used to provide a proximal timing reference for measurement of pulse transit time (PTT) to assist in ubiquitous monitoring for blood pressure. PTT, the amount of time required for a pressure wave to travel between two points on the arterial tree, has been shown to have a strong inverse relationship with blood pressure. To the best of our knowledge, this is the first time the BCG-to-ABP relationship has been explored on the basis of features derived from the two measurement modalities.
The results suggest that the BCG phenomenon is more related with blood flow as compared to the arterial pressure curve. The methods presented in this paper, such as those related to extraction of features from the ICG and ABP waveforms, are based on the existing literature regarding these two measurement modalities [20], [29]. The features from the BCG waveforms, which are based on time intervals and amplitudes of different points on the BCG wave, are extracted to capture changes in the flow of blood.
The data were collected from healthy subjects from both genders and no gender related differences were observed in the results. The methods outlined in this work can be used with other BCG measuring sensors, such as accelerometers, and in settings other than the home for continuous assessment of hemodynamic parameters. However, for correct estimation of these parameters from the BCG, motion artifacts must not be present in the signal, or algorithms for mitigating their effects should be designed.
An important limitation of this study was that data was collected from relatively young and healthy subjects. Hence, future work should include a more diverse group of participants and also subjects with cardiovascular disease. Moreover, data from one healthy subject was used in the feasibility study involving multi-day trial for stroke volume estimation from the BCG using the methods outlined in this paper. Further work with additional subjects is needed to validate these findings.
The results from the single subject multi-day trial also showed an error of 7ml in the BCG- and ICG-estimated stroke volumes on one of the test days. After further investigation into that day’s results, it was found that presence of motion artifacts in the measured signals, caused by even the slightest inadvertent subject motion, introduced errors in the mapping technique and thus rendered incorrect results. In fact, removal of motion related artifacts from the measured signals is very important to provide high signal-to-noise ratio in the measured signals and thus lead to correct estimation of parameters. Hence, future work needs to focus on design of algorithms that can adaptively detect, remove and compensate for the motion and posture-based noise in the data and lead to accurate estimation of clinically relevant cardiovascular parameters in home settings.
Future work should also focus on augmenting our findings with non-invasive reference standard measurements by incorporating invasive methods for accurate assessment of true hemodynamic measurements. For example, the BCG can be measured at the same time as catheter-based recordings of pressures and flows.
The methods presented in this manuscript represent early translational work with the aim of providing a solution to monitoring HF patients at home and potentially predicting exacerbations using the BCG-derived cardiac output estimates. Predicting an HF exacerbation fundamentally requires the accurate measurement of cardiac output, and/or the components that it is derived from. Accordingly, the ability to accurately derive cardiac output changes from BCG recordings is a central element towards BCG-based scales being translated into use for monitoring HF patients at home.
V. Conclusion
In this paper, we have systematically compared the BCG measurements obtained from a modified electronic weighing scale with the hemodynamic measurements, based on flow and pressure of blood, from the ICG and ABP sensors. The results derived in this study provide insight into the physiological origin of the BCG and can lead to design and implementation of algorithms and methods for using the BCG measurements for cardiac output evaluation as well as cardiac contractility in unsupervised environments outside of the clinic.
Biographies

Abdul Qadir Javaid (S’13) received the B.S. and M.S. degrees from the University of Engineering and Technology, Lahore, Pakistan, and Newcastle University, U.K., in 2007 and 2008, respectively. He was with the Electrical Engineering Department, National University of Computer and Emerging Sciences, Lahore, from 2010 to 2011. He joined the Georgia Institute of Technology, Atlanta, GA, USA, in 2011, and has been with the Smart Antenna Research Laboratory under Dr. M. A. Weitnauer’s supervision since Fall 2012. He joined the Inan Research Laboratory, Gerogia Institute of Technology, in 2014, and has been involved under the guidance of Dr. O. T. Inan in various projects for cardiovascular monitoring. His current research interests include biomedical devices, signal processing algorithms for bio-signals, and machine learning.

Hazar Ashouri received the B.E. degree in electrical and computer engineering from the American University of Beirut, in 2013. She is currently pursuing the M.S. degree in electrical and computer engineering with the Georgia Institute of Technology, and the Ph.D. degree. She is a Graduate Research Assistant with the Inan’s Research Laboratory under the supervision of Dr. O. Inan. Her current research includes cardio-mechanical signals and non-invasive cardiovascular monitoring.

Srini Tridandapani (S’86–M’95–SM’12) received the B.E. degree from Anna University, Madras, India, the M.S.E.E. and Ph.D. degrees from the University of Washington, Seattle, all in electrical engineering, the M.D. degree from the University of Michigan, Ann Arbor, MI, followed by residency training in radiology at Michigan, and the M.S.C.R. (clinical research) and M.B.A. degrees from Emory University. After post-doctoral training in computer science with the University of California at Davis, CA, he was an Assistant Professor of Electrical and Computer Engineering with Iowa State University, Ames, IA. He received clinical fellowships in cardiothoracic imaging and abdominal imaging with Emory University, Atlanta, GA.
A board-certified radiologist, he is currently a Faculty Member with the Department of Radiology and Imaging Sciences, Emory University, and an Adjunct Professor with the School of Electrical and Computer Engineering, Georgia Institute of Technology. His current research involves the development of novel gating strategies for optimizing cardiac computed tomography and innovative tools to increase patient safety in medical imaging.

Omer T. Inan (S’06–M’09–SM’15) received the B.S., M.S., and Ph.D. degrees from Stanford University, Stanford, CA, in 2004, 2005, and 2009, respectively, all in electrical engineering.
He joined ALZA Corporation (a Johnson and Johnson Company) in 2006, where he designed micropower circuits for iontophoretic drug delivery. In 2007, he joined Countryman Associates, Inc., Menlo Park, CA, where he was a Chief Engineer, involved in designing and developing high-end professional audio circuits and systems. From 2009 to 2013, he was also a Visiting Scholar with the Department of Electrical Engineering, Stanford University. Since 2013, he has been an Assistant Professor of Electrical and Computer Engineering with the Georgia Institute of Technology. He is also an Adjunct Assistant Professor with the Wallace H. Coulter Department of Biomedical Engineering. His research focuses on non-invasive physiologic monitoring for human health and performance, and applying novel sensing systems to chronic disease management, acute musculoskeletal injury recovery, and pediatric care.
Dr. Inan is an Associate Editor of the IEEE JOURNAL OF BIOMEDICAL AND HEALTH INFORMATICS, the IEEE Engineering in Medicine and Biology Conference, and the IEEE Biomedical and Health Informatics Conference, an Invited Member of the IEEE Technical Committee on Translational Engineering for Healthcare Innovation, and a Technical Program Committee Member or Track Chair for several other major international biomedical engineering conferences. He has authored over 65 technical articles in peer-reviewed international journals and conferences, and has four issued and four pending patents. He received the Gerald J. Lieberman Fellowship (Stanford University) from 2008 to 2009 for outstanding scholarship, and the Lockheed Dean’s Excellence in Teaching Award (Georgia Tech) in 2016. He is a Three-Time National Collegiate Athletic Association All-American in the discus throw, and was a co-captain of the Stanford University Track and Field Team.
Funding Statement
This work was supported in part by the National Institute on Aging of the National Institutes of Health under Grant R56AG048458 and the National Institute of Biomedical Imaging and Bioengineering under 1U01EB018818-01.
References
- [1].Mozaffarian D., “Heart disease and stroke statistics—2015 update: A report from the American Heart Association,” Circulation, vol. 131, no. , pp. e29–e32, 2015. [DOI] [PubMed] [Google Scholar]
- [2].Cooper R. A., Getzen T. E., McKee H. J., and Laud P., “Economic and demographic trends signal an impending physician shortage,” Health Affairs, vol. 21, no. 1, pp. 140–154, 2002. [DOI] [PubMed] [Google Scholar]
- [3].Fensli R., Gunnarson E., and Hejlesen O., “A wireless ECG system for continuous event recording and communication to a clinical alarm station,” in Proc. 26th Annu. Int. Conf. IEEE Eng. Med. Biol. Soc. (IEMBS), vol. 1 Sep. 2004, pp. 2208–2211. [DOI] [PubMed] [Google Scholar]
- [4].Lucani D., Cataldo G., Cruz J., Villegas G., and Wong S., “A portable ECG monitoring device with Bluetooth and Holter capabilities for telemedicine applications,” in Proc. 28th Annu. Int. Conf. IEEE Eng. Med. Biol. Soc. (EMBS), Aug./Sep. 2006, pp. 5244–5247. [DOI] [PubMed] [Google Scholar]
- [5].Inan O. T., et al. , “Ballistocardiography and seismocardiography: A review of recent advances,” IEEE J. Biomed. Health Informat., vol. 19, no. 4, pp. 1414–1427, Jul. 2015. [DOI] [PubMed] [Google Scholar]
- [6].Baek H. J., Chung G. S., Kim K. K., and Park K. S., “A smart health monitoring chair for nonintrusive measurement of biological signals,” IEEE Trans. Inf. Technol. Biomed., vol. 16, no. 1, pp. 150–158, Jan. 2012. [DOI] [PubMed] [Google Scholar]
- [7].Bruser C., Stadlthanner K., de Waele S., and Leonhardt S., “Adaptive beat-to-beat heart rate estimation in ballistocardiograms,” IEEE Trans. Inf. Technol. Biomed., vol. 15, no. 5, pp. 778–786, Sep. 2011. [DOI] [PubMed] [Google Scholar]
- [8].Dziuda L., Skibniewski F. W., Krej M., and Lewandowski J., “Monitoring respiration and cardiac activity using fiber Bragg grating-based sensor,” IEEE Trans. Biomed. Eng., vol. 59, no. 7, pp. 1934–1942, Jul. 2012. [DOI] [PubMed] [Google Scholar]
- [9].Shin J. H., Chee Y. J., Jeong D. U., and Park K. S., “Nonconstrained sleep monitoring system and algorithms using air-mattress with balancing tube method,” IEEE Trans. Inf. Technol. Biomed., vol. 14, no. 1, pp. 147–156, Jan. 2010. [DOI] [PubMed] [Google Scholar]
- [10].Etemadi M., Inan O. T., Giovangrandi L., and Kovacs G. T. A., “Rapid assessment of cardiac contractility on a home bathroom scale,” IEEE Trans. Inf. Technol. Biomed., vol. 15, no. 6, pp. 864–869, Nov. 2011. [DOI] [PubMed] [Google Scholar]
- [11].González-Landaeta R., Casas O., and Pallàs-Areny R., “Heart rate detection from an electronic weighing scale,” Physiol. Meas., vol. 29, no. 8, pp. 979–988, 2008. [DOI] [PubMed] [Google Scholar]
- [12].Wiens A., Etemadi M., Klein L., Roy S., and Inan O. T., “Wearable ballistocardiography: Preliminary methods for mapping surface vibration measurements to whole body forces,” in Proc. 36th Annu. Int. Conf. IEEE Eng. Med. Biol. Soc. (EMBC), Aug. 2014, pp. 5172–5175. [DOI] [PMC free article] [PubMed] [Google Scholar]
- [13].Tavakolian K., Ngai B., Blaber A. P., and Kaminska B., “Infrasonic cardiac signals: Complementary windows to cardiovascular dynamics,” in Proc. Annu. Int. Conf. IEEE Eng. Med. Biol. Soc. (EMBC), Aug./Sep. 2011, pp. 4275–4278. [DOI] [PubMed] [Google Scholar]
- [14].Lewis R. P., Rittogers S. E., Froester W. F., and Boudoulas H., “A critical review of the systolic time intervals,” Circulation, vol. 56, no. 2, pp. 146–158, 1977. [DOI] [PubMed] [Google Scholar]
- [15].Opie L. H., Ed., Heart Physiology: From Cell to Circulation. Baltimore, MD, USA: Williams & Wilkins, 2004. [Google Scholar]
- [16].Lindqvist A., Pihlajamäki K., Jalonen J., Laaksonen V., and Alihanka J., “Static-charge-sensitive bed ballistocardiography in cardiovascular monitoring,” Clin. Physiol., vol. 16, no. 1, pp. 23–30, 1996. [DOI] [PubMed] [Google Scholar]
- [17].Kurumaddali B., Marimuthu G., Venkatesh S. M., Suresh R., Syam B. S., and Suresh V., “Cardiac output measurement using ballistocardiogram,” in The 15th International Conference on Biomedical Engineering. Springer, Jan. 2014, pp. 861–864. [Google Scholar]
- [18].Bos W. J. W., van Goudoever J., van Montfrans G. A., van den Meiracker A. H., and Wesseling K. H., “Reconstruction of brachial artery pressure from noninvasive finger pressure measurements,” Circulation, vol. 94, no. 8, pp. 1870–1875, 1996. [DOI] [PubMed] [Google Scholar]
- [19].Gallo D., Anayiotos A., and Morbiducci U., “The evolution of computational hemodynamics as a clinical tool in decision making, patient specific treatment and clinical management,” Ann. Biomed. Eng., vol. 43, no. 1, pp. 1–2, 2015. [DOI] [PubMed] [Google Scholar]
- [20].Sherwood A., Allen M. T., Fahrenberg J., Kelsey R. M., Lovallo W. R., and van Doornen L. J. P., “Methodological guidelines for impedance cardiography,” Psychophysiology, vol. 27, no. 1, pp. 1–23, 1990. [DOI] [PubMed] [Google Scholar]
- [21].Inan O. T., Etemadi M., Wiard R. M., Kovacs G. T. A., and Giovangrandi L., “Novel methods for estimating the ballistocardiogram signal using a simultaneously acquired electrocardiogram,” in Proc. Annu. Int. Conf. IEEE Eng. Med. Biol. Soc. (EMBC), Sep. 2009, pp. 5334–5347. [DOI] [PubMed] [Google Scholar]
- [22].Javaid A. Q., Wiens A. D., Fesmire N. F., Weitnauer M. A., and Inan O. T., “Quantifying and reducing posture-dependent distortion in ballistocardiogram measurements,” IEEE J. Biomed. Health Informat., vol. 19, no. 5, pp. 1549–1556, Sep. 2015. [DOI] [PMC free article] [PubMed] [Google Scholar]
- [23].Sörnmo L. and Laguna P., Bioelectrical Signal Processing in Cardiac and Neurological Applications. San Diego, CA, USA: Academic, 2005. [Google Scholar]
- [24].Safar M. E., “Systolic blood pressure, pulse pressure and arterial stiffness as cardiovascular risk factors,” Current Opinion Nephrol. Hypertension, vol. 10, no. 2, pp. 257–261, 2001. [DOI] [PubMed] [Google Scholar]
- [25].Haykin S. O., Adaptive Filter Theory. Gurgaon, India: Pearson Education, 2008. [Google Scholar]
- [26].Arlot S. and Celisse A., “A survey of cross-validation procedures for model selection,” Statist. Surv., vol. 4, pp. 40–79, 2010. [Google Scholar]
- [27].Cybulski G., Ambulatory Impedance Cardiography: The Systems and their Applications (Lecture Notes in Electrical Engineering), vol. 76 Heidelberg, Germany: Springer-Verlag, 2011, pp. 978–980. [Google Scholar]
- [28].Rousseeuw P. J. and Van Driessen K., “A fast algorithm for the minimum covariance determinant estimator,” Technometrics, vol. 41, no. 3, pp. 212–223, 1999. [Google Scholar]
- [29].Kim C. S., Carek A. M., Mukkamala R., Inan O. T., and Hahn J. O., “Ballistocardiogram as proximal timing reference for pulse transit time measurement: Potential for cuffless blood pressure monitoring,” IEEE Trans. Biomed. Eng., vol. 62, no. 11, pp. 2657–2664, Nov. 2015. [DOI] [PMC free article] [PubMed] [Google Scholar]
- [30].Mukkamala R., et al. , “Toward ubiquitous blood pressure monitoring via pulse transit time: Theory and practice,” IEEE Trans. Biomed. Eng., vol. 62, no. 8, pp. 1879–1901, Aug. 2015. [DOI] [PMC free article] [PubMed] [Google Scholar]