

Abstract
OBJECTIVES
An international group proposed the existence of “cognitive frailty”, a condition defined by simultaneous presence of physical frailty and cognitive impairment in the absence of dementia. The objective was to compare the neuropsychological profiles in subgroups of elders differentiated across their physical frailty (Fried phenotype) and cognitive status (Clinical Dementia Rating score) to characterize the “cognitive frailty” entity.
METHOD
We studied baseline characteristics of 1,617 subjects enrolled in Multidomain Alzheimer Disease Preventive Trial (MAPT). Included subjects were aged 70 years or older and presented at least 1 of the 3 following clinical criteria: (1) Memory complaint spontaneously reported to a general practitioner, (2) limitation in one instrumental activity of daily living, (3) slow gait speed. Subjects with dementia were not included in the trial.
RESULTS
“Cognitive frailty individuals” significantly differed from “individuals with cognitive impairment and without physical frailty”, scoring worse at executive, and attention tests. They presented subcortico-frontal cognitive pattern different of Alzheimer Disease. Cognitive performance of subjects with 3 criteria or more of the frailty phenotype are cognitively more impaired than subjects with only one.
DISCUSION
The characterization of “cognitive frailty” must be done in frail subjects to set up specific preventive clinical trials for this population.
Keywords: Alzheimer Disease, elderly, MAPT trial, cognitive frailty, physical frailty
Introduction
The frailty syndrome has recently attracted attention of the scientific community and public health authorities in numerous countries as risk factor for several age-related negative outcomes in older persons (1). In parallel, dementia and cognitive disorders also represent major healthcare and social priorities. The most commonly used definition of frailty was developed by Fried et al. in the Cardiovascular Health Study and in the Women’s Health and Aging Studies (2). Frailty was operationally defined as a clinical condition meeting 3 out of 5 criteria closely related to the physical domain: weak muscle strength, slow gait speed, unintentional weight loss, exhaustion, and sedentary behavior (3). Up to date, frailty and cognitive impairment have mostly been studied in parallel with very few attempts of simultaneously considering them. However, some recent work has started considering cognition as part of the definition of frailty, especially from an epidemiological viewpoint. Several biological and clinical conditions may underlie the age-related physical and cognitive declines: 1) depression (4), 2) cardiovascular risk factors (5), 3) genetic mutations (e.g. APO-E4) (6), 4) behavioral factors (e.g. low education, unhealthy dietary patterns, low physical and mental activity, smoking, high alcohol consumption), 5) oxidative damage and functional changes in the hippocampus and prefrontal cortex (7), 6) accumulation of common brain pathological findings (e.g. Alzheimer’s disease pathology, microinfarcts, nigral neuronal loss) (8-11), and 7) Low grade chronic inflammation. The absence of consideration of cognitive impairment in frailty syndrome could contribute to important heterogeneity of this entity (12).
An International Consensus Group organized by the International Academy on Nutrition and Aging (IANA) and the International Association of Gerontology and Geriatrics (IAGG), proposed the identification of the “cognitive frailty” condition (13). “Cognitive frailty” was hypothetically described as a clinical condition characterized by the simultaneous presence of both physical frailty and cognitive impairment. In particular, the key factors defining such a condition included: 1) presence of physical frailty and cognitive impairment, and 2) exclusion of concurrent Alzheimer’s disease (AD) dementia or other dementias. To identify “cognitive frailty”, the panel of experts suggested that all frail subjects should perform a comprehensive cognitive assessment exploring memory performance as well as other cognitive functions, in particular executive functions (with Montreal Cognitive assessment test (MoCa) (14), Mini Mental state Examination (MMSE) (15), Alzheimer’s Disease Assessment Scale-cognitive subscale (ADAS-Cog) (16), and speed processing tests). However, currently, cognitive pattern of “cognitive frailty” is not clearly characterized and the panel of experts of IANA and IAGG described a hypothetical condition without data available to support it. The cognitive profile identification of “cognitive frailty individuals” could be interesting because a potential for reversibility could also characterize this entity. Our hypothesis is that “cognitive frailty” would be a specific cognitive entity different of that met in AD, and which would be the witness of a more general impairment of the individual.
The main objective of our study was to determine the specific neuropsychological profile of “cognitive frailty individuals”, based on a sample of older adults of the Multidomain Alzheimer Preventive Trial (MAPT), aged 70 years and over, living in the community without any clinical sign of dementia (17,18). In addition, we aimed to assess the association of physical frailty severity with cognitive performance of “cognitive frailty individuals” and “frail older individuals”.
Methods
MAPT study
The MAPT study was a 4-arm randomized controlled trial aimed at assessing the effects of isolated supplementation with omega-3 fatty acid, an isolated multidomain intervention (consisting of nutritional counseling, physical exercise, cognitive stimulation), or a combination of the 2 interventions, versus placebo, on cognitive functions modifications in older persons aged 70 years and older. A total of 1,680 subjects were enrolled in 13 memory clinics and followed up for 3 years. After the baseline assessment, participants also underwent cognitive, functional, and biological assessments after 6, 12, 24 and 36 months. The protocol is registered on a public-access clinical trial database (www.clinicaltrials.gov, Number: NCT01513252). Written, informed consent was obtained from all participants.
Subjects
Included subjects were aged 70 years or older and presented at least 1 of the 3 following clinical criteria: (1) Memory complaint spontaneously reported to a general practitioner, (2) limitation in one instrumental activity of daily living (IADL, i.e., inability in the use the telephone, shopping, preparation of meals, housekeeping, laundry, transportation, medication use, or management of money, (3) slow gait speed (i.e., ≤0.8 m/s). Subjects with dementia, limitation in basic activities of daily living (bathing, dressing, toileting, transferring, continence, eating) and suffering from severe depression were not included in the trial.
Clinical data
Clinical Visits were scheduled every 6 months to assess physical condition, diseases and corresponding treatments, adherence to multi-domain intervention. Cognitive and functional assessments were conducted at baseline, six months, and annually at 1, 2 and 3 years by independent research staff blinded to intervention.
Cognitive assessment
The battery of neuropsychological tests included the free and cued selective reminding test (FCRST, focused on verbal episodic memory/recall) (19), the Controlled Oral Word Association Test and Category Naming Test (COWAT and CNT, for verbal fluency) (20), the Digit Symbol Substitution Subtest of the Wechsler Adult Intelligence Scale-Revised (for attention and executive function) (21), the Trail-Making Test (TMT, measuring switching) (22), the Mini Mental State Examination (MMSE) (15), and the Clinical Dementia Rating Scale (CDR) (23). Two visual-analogue scales were administered, to assess memory function and the consequences of memory impairment in everyday life. Depressive symptoms was assessed with the Geriatric Depression Scale-15 items (GDS) (24).
Physical and frailty assessment
Frailty was evaluated using the classification system proposed by Fried et al., based on assessments of grip strength, timed walking, unintentional weight loss, fatigue, and physical activity (3). In addition, functional assessment included the Alzheimer Disease Cooperative Study-Activities of Daily Living Prevention Instrument (ADCS-ADL) (25) and the Short Physical Performance Battery (SPPB) (26).
Classification of groups
Participants were classified into four groups according to the presence of cognitive impairment and/or frailty syndrome (Box 1). The four groups were mainly defined as follows:
Group 1: “Robust older persons” with no evidence of physical frailty (i.e., no frailty criteria) and absence of cognitive impairment (i.e., CDR=0),
Group 2: “Frail older individuals” with at least one Fried criteria and without cognitive impairment (i.e., CDR=0),
Group 3: “Individuals with cognitive impairment and without physical frailty” with no Fried criteria and with cognitive impairment (i.e., CDR=0.5).
Group 4: “Cognitive frailty individuals” with at least one Fried criterion and with cognitive impairment (i.e., CDR=0.5),
Box 1. Definitions used to establish the 4 sub-groups of this study.
Mild Cognitive Impairment (MCI)
Variable definition but which includes: 1) a subjective disorder affecting memory and/or other cognitive areas and 2) objective impairment of memory and/ or other cognitive area 3) with no significant impact on usual activities. Thus, patients with MCI do not meet the generally accepted diagnostic criteria for dementia or Alzheimer’s Disease (AD).
→ In this study, we consider that “individuals with cognitive impairment and without physical frailty” have a clinical dementia rating (CDR) score of 0.5.
Physical frailty
physical frailty is defined as «a medical syndrome with multiple causes and contributors that is characterized by diminished strength, endurance, and reduced physiologic function that increases an individual’s vulnerability for developing increased dependency and/or death”. Frailty was defined as a clinical syndrome in which three or more of the following criteria were present: 1) unintentional weight, 2) self-reported exhaustion, 3) weakness (grip strength), 4) slow walking speed, and 5) low physical activity.
→ In this study, “frail older individuals” are defined by presence of at least one Fried criteria (and so includes pre-frailty and frailty individuals).
Cognitive frailty
definition includes: 1) presence of physical frailty and cognitive impairment; and 2) exclusion of concurrent AD dementia or other dementias.
→ In this study, we consider subjects with cognitive impairment (i.e., CDR=0.5) and physical frailty or pre-frailty (at least one Fried criteria) are “cognitive frailty individuals”. By definition, there is no AD dementia in this study (exclusion criteria of MAPT study).
Analysis
We compared clinical characteristics, in particular neuropsychological profile, of subjects according to their frailty and cognitive status. We compared in a first time 4 groups of subjects: group 1, group 2, group 3, and group 4 (group 4 is the reference group for this analysis). In a second time, to evaluate the impact of physical frailty severity, we compared cognitive performance according to the number of physical frailty criteria (1, 2, and 3 or more) among subjects with CDR score of 0 and 0.5 (group with only 1 Fried criteria is the reference group for this analysis).
We used χ2 or Fisher’s exact (for expected values <5) tests for categorical variables, one way analyses of variance for quantitative variables with normal distributions (Student tests), and non-parametric tests (Kruskal-Wallis test) for quantitative variables without normal distributions. We compared characteristics of “frailty cognitive individuals” (group 4) with group 1, 2, and 3; using univariate polytomic regressions for categorical variables and univariate linear regressions or Kruskal-Wallis tests for continuous variables. In the absence of a normal distribution, variables were transformed and tested on square root or logarithmic value in order to obtain normal distributions. A multivariate analysis was also conducted to test the effect of potential confounding factors: 1) age, gender, socio-cultural level, BMI, and GDS for the first analysis (cognitive profile of “cognitive frailty” group), and 2) age, gender, socio-cultural level, and GDS for the second analysis (impact of number of physical frailty criteria on cognitive performance).
P values were based on two-sided tests. To account for the multiplicity of tests with an overall risk of 5%, each comparison compared to the reference group is considered significant if the «p» is <0.05/number of comparison, either 0.017 for 3 comparisons (first analysis), and 0.025 for 2 comparisons (second analysis). Analyses were performed using SAS software version 9.4 (SAS institute, Cary, NC, USA).
Results
Population
Figure 1 shows the flow chart of this study. Table 1 shows baseline characteristics for the 1,617 MAPT participants studied in this work. “Cognitive frailty individuals” with at least 1 Fried criterion and with cognitive impairment (i.e., CDR=0.5), represented 356 subjects, 22% of our study population.
Figure 1.
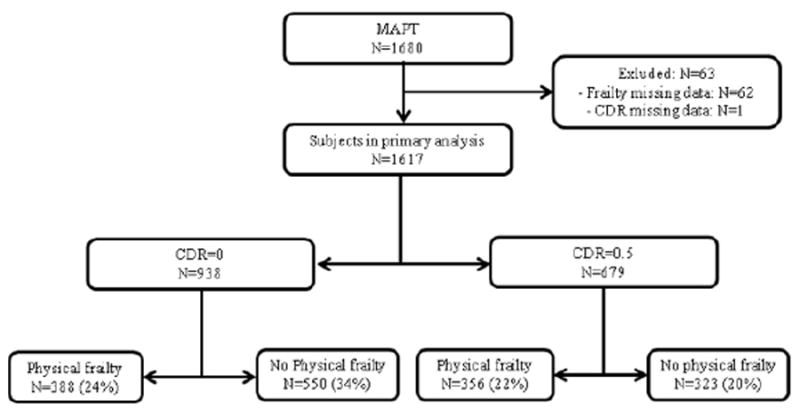
Flow chart of the study
Table 1.
Baseline characteristics of MAPT study subjects (n=1617)
| Variables | MAPT population N=1617 |
|---|---|
| Male gender, N (%) | 571 (35.31) |
| Age in years, mean (SD) | 75.37 (4.46) |
| Education years, N (%) | |
| No diploma | 360 (22.74) |
| Primary school certificate | 531 (33.54) |
| Secondary education, without high-school diploma | 232 (14.66) |
| High-school diploma (Baccalaureat) or higher | 460 (29.06) |
| Body Mass Index, mean (SD) | 26.09 (4.07) |
| Multidomain intervention, N (%) | 809 (50.03) |
| APOE ε4 positive, N (%) | 287 (22.84) |
| Memory complaint, N (%) | 1601 (99.01) |
| MMSE score, /30, mean (SD) | 28.07 (1.60) |
| CDR-SB, mean (SD) | 0.31 (0.46) |
| FCSRT scores, mean (SD) | |
| Immediate recall/16 | 15.45 (1.02) |
| Free recall /48 | 27.41 (6.80) |
| Total recall / 48 | 45.24 (3.89) |
| Delayed free recall /16 | 10.61 (2.93) |
| Delayed total recall/16 | 15.40 (1.32) |
| Number of intrusions | |
| Immediate recall | 0.06 (0.32) |
| Total recall | 1.10 (2.15) |
| Delayed recall | 0.31 (0.79) |
| Index of cueing, % (SD) | 88.90 (12.29) |
| TMT A seconds, mean (SD) | 46.64 (17.23) |
| TMT B seconds, mean (SD) | 123.24 (64.21) |
| WAIS-R coding, mean (SD) | 37.65 (10.16) |
| COWAT 2 minutes score, mean (SD) | 19.72 (6.50) |
| CNT 2 minutes score, mean (SD) | 25.79 (7.41) |
| Visual Analogue Scale 1, /100, mean (SD) | 49.88 (17.02) |
| Visual Analogue Scale 2, /100, mean (SD) | 39.93 (23.14) |
| GDS score/15, mean (SD) | 3.27 (2.64) |
| Fried’s criteria, N (%) | |
| Involuntary weight loss | 77 (4.76) |
| Exhaustion | 264 (16.34) |
| Weakness (handgrip strength) | 377 (23.49) |
| Slow gait speed | 65 (4.03) |
| Low physical activity | 236 (14.66) |
| SPPB score, /12, N (%) | |
| ≥10 | 1251 (77.65) |
| < 10 | 360 (22.35) |
| 4-m Gait speed, m/s, mean (SD), | 1.09 (0.28) |
| ADCS-ADL PI, /45, mean (SD) | 39.70 (4.82) |
MMSE, Mini Mental Scale Examination; CDR, Clinical Dementia Rating Score; SPPB, Short Physical Performance Battery; ADCS-ADL, Alzheimer’s Disease Cooperative Study-Activities of Daily Living; TMT, Trail Making Test; COWAT, Controlled Oral Word Association Test; CNT, Categorial naming testing ; FCRST, Free and Cued Selective Reminding Test; GDS, Geriatric Depression rating; Visual Analogue Scale 1, Visual Analogue Scale, memory functioning; Visual Analogue Scale 2, Visual Analogue Scale, consequences in everyday life. Index of cuing (%) = (free recall-total recall) / (free recall-48).
“Cognitive frailty individuals” significantly differed from “individuals with cognitive impairment and without physical frailty” for age, GDS and Body Mass Index (Body Mass Index), from “frail older individuals” for gender, GDS and age, and from “robust older persons” for age, gender, education years, GDS and BMI (table 2).
Table 2.
Cognitive profile of “cognitive frailty individuals” in MAPT study
| MAPT study N=1617 | Available data | No cognitive impairment (CDR=0) | Cognitive impairment (CDR=0.5) | ||||||
|---|---|---|---|---|---|---|---|---|---|
| “Robust older persons” N=550 | P* | “Frail older individuals” N=388 | P* | “Individuals with cognitive impairment and without physical frailty” N=323 | P* | “Cognitive frailty individuals” N=356 | |||
| Male gender, N (%) | 1617 | 174 (31.64) | 0.000 | 105 (27.06) | 0.000 | 135 (41.80) | 0.545 | 157 (44.10) | |
| Age in years, mean (SD) | 1617 | 74.19 (3.97) | <0.0001 | 75.98 (4.60) | 0.0009 | 74.81 (4.08) | <0.0001 | 77.02 (4.73) | |
| Education years, N (%) | 1583 | ||||||||
| No diploma | 91 (16.95) | - | 90 (23.68) | - | 88 (27.67) | - | 91 (26.15) | ||
| Primary school certificate | 178 (33.15) | 0.022 | 131 (34.47) | 0.471 | 107 (33.65) | 0.848 | 115 (33.05) | ||
| Secondary education, without high-school diploma | 89 (16.57) | 0.001 | 50 (13.16) | 0.319 | 54 (16.98) | 0.164 | 39 (11.21) | ||
| High-school diploma or higher | 179 (33.33) | 0.004 | 109 (28.68) | 0.738 | 69 (21.70) | 0.089 | 103 (29.60) | ||
| Body Mass Index, mean (SD) | 1613 | 25.61 (3.95) | 0.0009 | 26.92 (4.56) | 0.1797 | 25.47 (3.34) | 0.0008 | 26.52 (4.11) | |
| Multidomain intervention, N (%) | 1617 | 290 (52.73) | 0.333 | 184 (47.42) | 0.583 | 159 (49.23) | 0.956 | 176 (49.44) | |
| APOE ε4 positive, N (%) | 1251 | 89 (19.73) | 0.096 | 70 (23.73) | 0.708 | 63 (25.61) | 0.895 | 65 (25.10) | |
| Memory complaint, N (%) | 1617 | 546 (99.27) | 0.537 | 381 (98.20) | 0.447 | 322 (99.69) | 0.247 | 352 (98.88) | |
| MMSE, score /30, mean (SD) | 1617 | 28.48 (1.42) | <0.0001* | 28.34 (1.49) | <0.0001* | 27.72 (1.69) | 0.0353 | 27.47 (1.63) | |
| CDR-SB score, mean (SD) | 1617 | 0.01 (0.08) | <0.0001 | 0.02 (0.10) | <0.0001 | 0.64 (0.34) | 0.0002* | 0.77 (0.53) | |
| FCSRT scores, mean (SD) | |||||||||
| Immediate recall, /16 | 1617 | 15.65 (0.70) | <0.0001* | 15.60 (0.75) | <0.0001* | 15.25 (1.15) | 0.7484 | 15.18 (1.42) | |
| Free recall /48 | 1616 | 29.77 (5.54) | <0.0001* | 28.82 (5.94) | <0.0001* | 25.51 (6.94) | 0.0013 | 23.94 (7.38) | |
| Total recall, / 48 | 1616 | 46.37 (2.18) | <0.0001* | 45.99 (2.51) | <0.0001* | 43.99 (5.12) | 0.2092 | 43.78 (4.99) | |
| Delayed free recall /16 | 1616 | 11.62 (2.40) | <0.0001* | 11.20 (2.35) | <0.0001* | 9.75 (3.07) | 0.0079 | 9.19 (3.32) | |
| Delayed total recall /16 | 1616 | 15.72 (0.62) | <0.0001* | 15.69 (0.69) | <0.0001* | 15.07 (1.75) | 0.0320 | 14.89 (1.85) | |
| Number of intrusions | |||||||||
| Immediate recall | 1615 | 0.05 (0.23) | 0.2500 | 0.03 (0.18) | 0.1259 | 0.08 (0.39) | 0.8805 | 0.08 (0.44) | |
| Total recall | 1612 | 0.66 (1.07) | <0.0001* | 0.81 (1.46) | <0.0001* | 1.73 (3.14) | 0.6833 | 1.55 (2.66) | |
| Delayed recall | 1613 | 0.17 (0.45) | <0.0001* | 0.20 (0.55) | <0.0001* | 0.46 (1.08) | 0.5510 | 0.49 (1.04) | |
| Index of cueing, % (SD) | 1616 | 92.18 (9.03)* | <0.0001 | 90.97 (9.59)* | <0.0001 | 85.07 (15.05) | 0.6498 | 85.04 (14.37) | |
| TMT A seconds, mean (SD) | 1614 | 43.06 (14.71) | <0.0001* | 46.16 (15.89) | <0.0001* | 46.68 (15.26) | <0.0001* | 52.68 (21.79) | |
| TMT B seconds, mean (SD) | 1581 | 107.48 (48.77) | <0.0001* | 121.01 (53.96) | <0.0001* | 126.19 (60.20) | 0.0001 | 148.18 (87.84) | |
| WAIS-R coding, mean (SD) | 1611 | 40.27 (9.75) | <0.0001* | 38.29 (10.26) | <0.0001* | 37.17 (8.94) | <0.0001* | 33.29 (10.30) | |
| COWAT 2 minutes score, mean (SD) | 1615 | 20.95 (6.40) | <0.0001* | 19.71 (6.55) | 0.0045 | 19.11 (5.92) | 0.1323 | 18.36 (6.79) | |
| CNT 2 minutes score, mean (SD) | 1614 | 27.31 (6.98) | <0.0001* | 26.10 (7.37) | <0.0001* | 25.21 (7.35) | 0.0044 | 23.61 (7.62) | |
| Visual Analogue Scale 1, /100, mean (SD) | 1616 | 47.64 (16.18) | <0.0001* | 47.83 (16.18) | <0.0001* | 51.10 (16.93) | 0.0097 | 54.44 (18.30) | |
| Visual Analogue Scale 2, /100, mean (SD) | 1617 | 36.38 (23.08) | <0.0001* | 38.80 (20.93) | <0.0001* | 39.64 (22.90) | <0.0001* | 46.89 (24.33) | |
| GDS score/15, mean (SD) | 1608 | 2.64 (2.21) | <0.0001 | 3.53 (2.80) | 0.0001 | 2.93 (2.29) | <0.0001 | 4.27 (3.02) | |
| Fried’s criteria, N (%) | |||||||||
| Involuntary weight loss | 1617 | 0 (0) | - | 35 (9.02) | 0.216 | 0 (0) | - | 42 (11.80) | |
| Exhaustion | 1616 | 0 (0) | - | 127 (32.82) | 0.107 | 0 (0) | - | 137 (38.48) | |
| Weakness (handgrip strength) | 1605 | 0 (0) | - | 214 (56.02) | 0.011 | 0 (0) | - | 163 (46.57) | |
| Slow gait speed | 1613 | 0 (0) | - | 25 (6.51) | 0.025 | 0 (0) | - | 40 (11.24) | |
| Low physical activity | 1610 | 0 (0) | - | 110 (28.72) | 0.046 | 0 (0) | - | 126 (35.59) | |
| SPPB score/12, N (%) | 1611 | ||||||||
| < 10 | 73 (13.30) | 126 (32.64) | 45 (13.93) | 116 (32.86) | |||||
| ≥ 10 | 476 (86.70) | 0.000* | 260 (67.36) | 0.950 | 278 (86.07) | 0.000* | 237 (67.14) | ||
| 4-m Gait speed m/s, mean (SD), | 1614 | 1.18 (0.30) | <0.0001* | 1.04 (0.25) | 0.0022 | 1.12 (0.24) | <0.0001 | 0.98 (0.25) | |
| ADCS-ADL PI, /45; mean (SD) | 1604 | 40.91 (3.89) | <0.0001* | 40.18 (4.48) | <0.0001* | 39.50 (4.66) | <0.0001* | ||
MMSE, Mini Mental Scale Examination; CDR, Clinical Dementia Rating Score; SPPB, Short Physical Performance Battery; ADCS-ADL, Alzheimer’s Disease Cooperative Study-Activities of Daily Living; TMT, Trail Making Test; COWAT, Controlled Oral Word Association Test; CNT, Categorial naming testing ; FCRST, Free and Cued Selective Reminding Test; GDS, Geriatric Depression rating; Visual AnaloAnalogue Scale 2, Visuague Scale 1, Visual Analogue Scale, memory functioning; Visual l Analogue Scale, consequences in everyday life; Index of cuing (%) = (free recall-total recall) / (free recall-48);
indicates that subjects from the “cognitive frailty individuals” significantly differ from either the “normal older individuals” or “frail older individuals” or “individuals with cognitive impairment and without physical frailty” (p<0.017) in multivariate analysis (ajustement for age, gender, socio-cultural level, BMI, and GDS).
Cognitive profile of “cognitive frailty” group
“Cognitive frailty individuals” significantly differed with lower performance from “frail older individuals” and “robust older persons” for all cognitive tests (MMSE, CDR-SB, FCRST, TMT-A and –B, WAIS-R coding, CNT, and COWAT), visual analogue scales and some physical frailty tests (handgrip strength and slow gait speed) (table 2) in bivariate and multivariate analysis.
“Cognitive frailty individuals” significantly differed with lower performance from “individuals with cognitive impairment without physical frailty” for CDR-SB, free recall and delayed free recall of FCRST, TMT-A and TMT-B, WAIS-R coding, CNT, and visual analogue scales (table 2). Multivariate analysis indicated that “cognitive frailty individuals” and “individuals with cognitive impairment without physical frailty” had similar profiles on FCRST, TMT-B, visual analogue scale 1, and CNT although “cognitive frailty individuals” demonstrated significantly more impairment in visual analogue scale 1, CDR-SB, TMT-A, and WAIS-R coding.
Impact of physical frailty severity on cognitive performance
Subjects without cognitive impairment (i.e., CDR=0)
In multivariate analysis, subjects with only 1 Fried criterion significantly differed with better performance from subjects with 3 Fried criteria and more for delayed free recall of FCRST, CDR-SB, and visual analogue scale 1 (table 3).
Table 3.
Impact of physical frailty severity on cognitive performance in “frail older individuals”
| Variables | No cognitive impairment (CDR=0) | |||||
|---|---|---|---|---|---|---|
| Available data | Fried=1 N=277 | Fried=2 N=78 | P* | Fried≥3 N=20 | P* | |
| Male gender, N (%) | 375 | 78 (28.16) | 19 (24.36) | 0.506 | 4 (20.00) | 0.434 |
| Age in years, mean (SD) | 375 | 75.81 (4.50) | 76.81 (5.04) | 0.1129 | 76.25 (0.6573) | 0.6573 |
| Education years, N (%) | 367 | |||||
| No diploma | 61 (22.34) | 15 (20.00) | - | 9 (47.37) | - | |
| Primary school certificate | 94 (34.43) | 26 (34.67) | 0.746 | 7 (36.84) | 0.197 | |
| Secondary education, without high-school diploma | 38 (13.92) | 10 (13.33) | 0.882 | 2 (10.53) | 0.202 | |
| High-school diploma or higher | 80 (29.36) | 24 (32.00) | 0.591 | 1 (5.26) | 0.021 | |
| Body Mass Index, mean (SD) | 375 | 26.80 (4.54) | 26.95 (4.43) | 0.7984 | 27.55 (4.86) | 0.4739 |
| GDS score/15, mean (SD) | 371 | 3.22 (2.63) | 4.29 (3.10) | 0.0047 | 5 (2.92) | 0.0077 |
| MMSE score /30, mean (SD) | 375 | 28.35 (1.44) | 28.29 (1.65) | 0.7610 | 28.05 (1.82) | 0.3855 |
| CDR-SB score, mean (SD) | 375 | 0.01 (0.08) | 0.01 (0.06) | 0.4261 | 0.13 (0.22) | <0.0001* |
| FCSRT scores, mean (SD) | 375 | |||||
| Immediate recall/16 | 15.62 (0.70) | 15.54 (0.86) | 0.8180 | 15.65 (0.81) | 0.5011 | |
| Free recall /48 | 29.23 (6.02) | 27.58 (6.18) | 0.0318 | 27.95 (4.45) | 0.3560 | |
| Total recall / 48 | 46.09 (2.50) | 45.69 (2.83) | 0.2478 | 45.80 (1.64) | 0.0854 | |
| Delayed free recall /16 | 11.43 (2.30) | 10.76 (2.50) | 0.0249 | 9.80 (2.31) | 0.0028* | |
| Delayed total recall/16 | 15.74 (0.66) | 15.58 (0.78) | 0.0411 | 15.45 (0.83) | 0.0181 | |
| Index of cueing, % (SD) | 91.36 (9.49) | 90.05 (10.63) | 0.3912 | 89.54 (7.51) | 0.1262 | |
| TMT A seconds, mean (SD) | 374 | 45.74 (15.52) | 47.64 (17.04) | 0.3729 | 46.58 (16.10) | 0.8300 |
| TMT B seconds, mean (SD) | 371 | 117.53 (47.44) | 125.90 (63.27) | 0.4130 | 158.89 (86.48) | 0.0047 |
| WAIS-R coding, mean (SD) | 374 | 38.71 (10.29) | 38.01 (10.48) | 0.5942 | 33.95 (8.55) | 0.0455 |
| COWAT 2 minutes score, mean (SD) | 375 | 19.88 (6.58) | 19.68 (6.60) | 0.8088 | 17.75 (6.92) | 0.1636 |
| CNT 2 minutes score, mean (SD) | 374 | 26.38 (7.36) | 26.46 (7.69) | 0.9346 | 22.50 (5.82) | 0.0232 |
| Visual Analogue Scale 1, /100, mean (SD) | 374 | 46.55 (15.65) | 49.87 (17.50) | 0.1095 | 56.15 (17.33) | 0.0106* |
| Visual Analogue Scale 2, /100, mean (SD) | 375 | 37.04 (20.39) | 42.19 (21.40) | 0.0541 | 47.85 (23.78) | 0.0253 |
MMSE, Mini Mental Scale Examination; CDR-SB, Clinical Dementia Rating Score-Sum of Boxes; TMT, Trail Making Test; COWAT, Controlled Oral Word Association Test; CNT, Categorial naming testing ; FCRST, Free and Cued Selective Reminding Test; Visual Analogue Scale 1, Visual Analogue Scale, memory functioning; Visual Analogue Scale 2, Visual Analogue Scale, consequences in everyday life; Index of cuing (%) = (free recall-total recall) / (free recall-48);
indicates that subjects from the “Fried=1” group significantly differ from either the ‘Fried=2” or “Fried ≥ 3” groups (p<0.025) in multivariate analysis (ajustement for age, gender, socio-cultural level, and GDS).
Subjects with cognitive impairment (i.e., CDR=0.5)
In multivariate analysis, subjects with only 1 Fried criteria significantly differed with better performances from subjects with 3 Fried criteria and more for WAIS-R coding, and CDR-SB (table 4).
Table 4.
Impact of physical frailty severity on cognitive performance in “cognitive frailty individuals”
| Variables | Cognitive impairment (CDR=0.5) | |||||
|---|---|---|---|---|---|---|
| Available data | Fried=1 N=236 | Fried=2 N=82 | P* | Fried≥3 | P* N=30 | |
| Male gender, N (%) | 348 | 106 (44.92) | 34 (41.26) | 0.558 | 14 (46.67) | 0.856 |
| Age in years, mean (SD) | 348 | 76.56 (4.58) | 78.12 (5.09) | 0.0098 | 77.67 (4.32) | 0.2251 |
| Education years, N (%) | 340 | |||||
| No diploma | 57 (24.46) | 21 (26.58) | 9 (32.14) | |||
| Primary school certificate | 73 (31.33) | 32 (40.51) | 0.600 | 9 (32.14) | 0.623 | |
| Secondary education, without high-school diploma | 28 (12.02) | 4 (5.06) | 0.110 | 5 (17.86) | 0.838 | |
| High-school diploma or higher | 75 (32.19) | 22 (27.85) | 0.557 | 5 (17.86) | 0.140 | |
| Body Mass Index, mean (SD) | 347 | 26.44 (4.12) | 26.81 (4.40) | 0.4851 | 26.83 (3.52) | 0.6288 |
| GDS score/15, mean (SD) | 347 | 3.83 (2.82) | 5.09 (3.16) | 0.009 | 4.93 (2.89) | 0.519 |
| MMSE score /30, mean (SD) | 348 | 27.50 (1.55) | 27.46 (1.77) | 0.8454 | 27.13 (1.83) | 0.2418 |
| CDR-SB score, mean (SD) | 348 | 0.72 (0.43) | 0.80 (0.54) | 0.0009 | 1.03 (0.96) | 0.0519* |
| FCSRT scores, mean (SD) | 348 | |||||
| Immediate recall/16 | 15.14 (1.47) | 15.22 (1.48) | 0.5190 | 15.37 (0.81) | 0.9821 | |
| Free recall /48 | 24.08 (7.51) | 23.84 (7.60) | 0.7990 | 23.10 (6.46) | 0.4957 | |
| Total recall / 48 | 43.91 (5.20) | 43.48 (4.78) | 0.1579 | 43.37 (4.37) | 0.1769 | |
| Delayed free recall /16 | 9.34 (3.35) | 8.91 (3.53) | 0.3224 | 8.60 (2.67) | 0.2546 | |
| Delayed total recall/16 | 14.94 (1.85) | 14.74 (2.05) | 0.5548 | 14.77 (1.48) | 0.2082 | |
| Index of cueing, % (SD) | 85.78 (14.47) | 83.49 (14.60) | 0.1216 | 82.70 14.02) | 0.1387 | |
| TMT A seconds, mean (SD) | 346 | 50.97 (20.59) | 56.01 (22.63) | 0.0358 | 54.97 (29.07) | 0.4504 |
| TMT B seconds, mean (SD) | 334 | 139.92(80.31) | 164.73 (100.09) | 0.0195 | 148.00 (71.73) | 0.5077 |
| WAIS-R coding, mean (SD) | 344 | 34.57 (10.08) | 31.32 (10.53) | 0.0133 | 28.76 (9.44) | 0.0038* |
| COWAT 2 minutes score, mean (SD) | 347 | 18.45 (7.05) | 18.37 (5.83) | 0.9264 | 17.83 (7.54) | 0.6433 |
| CNT 2 minutes score, mean (SD) | 347 | 23.72 (7.40) | 23.51 (8.33) | 0.8338 | 23.60 (8.05) | 0.9363 |
| Visual Analogue Scale 1, /100, mean (SD) | 348 | 54.51 (18.39) | 55.29 (17.97) | 0.7388 | 49.80 (18.87) | 0.1860 |
| Visual Analogue Scale 2, /100, mean (SD) | 348 | 46.01 (24.75) | 48.45 (24.11) | 0.4377 | 45.77 (23.89) | 0.9595 |
MMSE, Mini Mental Scale Examination; CDR-SB, Clinical Dementia Rating Score-Sum of Boxes; TMT, Trail Making Test; COWAT, Controlled Oral Word Association Test; CNT, Categorial naming testing ; FCRST, Free and Cued Selective Reminding Test; Visual Analogue Scale 1, Visual Analogue Scale, memory functioning; Visual Analogue Scale 2, Visual Analogue Scale, consequences in everyday life; Index of cuing (%) = (free recall-total recall) / (free recall-48),
indicates that subjects from the “Fried=1” group significantly differ from either the ‘Fried=2” or “Fried ≥3” groups (p<0.025) in multivariate analysis (ajustement for age, gender, socio-cultural level, and GDS).
Discussion
In the bivariate analysis, “cognitive frailty individuals” significantly differed with lower performance from “individuals with cognitive impairment and without physical frailty” for CDR-SB, free recall and delayed free recall of FCRST, TMT-A and TMT-B, WAIS-R coding, CNT, and visual analogue scales. Multivariate analysis demonstrated significantly more impairment in visual analogue scale 1, CDR-SB, and WAIS-R coding.
“Cognitive frailty” has been conceived as a clinical condition characterized by the simultaneous presence of both physical frailty and cognitive impairment (after exclusion of dementia). To our knowledge, no previous study has attempted to determinate the cognitive profile of “cognitive frailty individuals” in comparison of subjects with cognitive impairment and without physical frailty. MAPT study provided an opportunity to describe the cognitive functions of a large sample of subjects with cognitive and physical performances well characterized. To achieve this objective, “cognitive frailty individuals” were included from MAPT study on the basis of the following: 1) CDR of 0.5 to objective the cognitive impairment. In MAPT study, all included participants at baseline had basic activities of daily living preserved (inclusion criteria) and no dementia. So, we have considered subjects with CDR score of 0.5 as MCI subjects. 2) At least one Fried Criterion of physical frailty and not 3 or more, because we wanted to cover the entire spectrum of physical frailty and pre-frailty population seen in memory clinic and geriatric centers in this analysis.
Cognitive profile of “cognitive frailty individuals” was an amnesic MCI multidomain. In fact, in bivariate analysis, memory, attention, and executive performances of “cognitive frailty individuals” were lower than in “individuals with cognitive impairment and without physical frailty” (as we may consider as MCI without physical frailty individuals). The multivariate analysis indicated that “cognitive frailty individuals” demonstrated significantly only more impairment for executive functions than in “individuals with cognitive impairment and without physical frailty”. Altered executive functions were mainly processing speed (TMT-A and WAIS-R coding), selective attention (WAIS-R coding) and mental flexibility (semantic fluency). The dissociation in semantic and phonenic fluency could be support the degradation in semantic knowledge in the “cognitive frailty individuals”. WAIS-R coding assessed the scanning and tracking aspect of attention. This test has also been found to measure aspects of visual selective attention and processing speed. Research using previous versions of the WAIS in non-clinical samples has suggested that the age-related decline in WAIS-R coding scores is related to motor ability (27). Performances in our study sample with physical frailty, probably due to lower executive and attention performances but also due to lower motor abilities. The main characteristic of the FCSRT was to assess verbal episodic memory with semantic cueing that permitted one to control for encoding and to facilitate retrieval in order to isolate the storage capacities. The cued recall technique, used in the FCSRT, was aimed at enhancing the recall performance by presentation of semantic cues that help for encoding and for retrieval processes. In this study, free recall and delayed free recall performances were lower in “cognitive frailty individuals” than in “individuals with cognitive impairment and without physical frailty”. Total recall, delayed total recall and index of cuing were not significantly different between these 2 groups. This memory pattern differed from amnesic syndrome of the medial temporal (or hippocampal) which is characterized by a low free recall performance with a decreased total recall because of insufficient effect of cueing (28). The ability to benefit from cues mainly reflected impairment in strategies to retrieve stored information, as “subcortico-frontal dementia”. The motor features contributing to physical frailty derive from motor control systems which reside in the brain including basal ganglia, brainstem, frontal and subcortico-frontal areas. Thus, it is likely that physical frailty and cognition may show some degree of inter-relationship due to the effect on both from processes occurring in the brain (29). For example, the presence of cerebrovascular disease (8) and nigral neuronal loss (9) in older adults is associated with higher levels of frailty and lower levels of physical and cognitive functions, and could be responsible of “subcortico-frontal dementia”. Depressive symptoms are also related to cognitive outcomes (30,31), in particular to executive functions. Kelaiditi et al maintained that “cognitive frailty” is characterized by reduced cognitive reserve. “Cognitive frailty” could be viewed as simply the inverse of cognitive reserve (32).
We also estimated the association of physical frailty severity (number of frailty criteria) on cognitive performance. Subjects with 2 criteria, and 3 criteria or more, had more impaired cognitive scores (in particular for executive functions) than subjects with only one. Thus, more physical frailty would be severe and more cognitive performances would be impaired. The association between cognition performance and physical frailty severity seemed to be more important in normal cognitive functioning group (“frail older individuals” with at least 1 Fried criteria and CDR=0) than in “cognitive frailty individuals”. This cross-sectional study was not be able to assess the causal direction, whether physical frailty impacts cognitive performance or whether low cognitive performance impacts physical frailty. However, physical frailty probably could impact directly administration of cognitive testing, and cognitive scores more impaired in severe physical frailty could be in relation with both motor and cognitive performance. One other hypothesis is that we are more likely to see effects of physical frailty on cognition in normal cognitive functioning group because “frail older individuals” have not yet cognitive impairment, and in ”cognitive frailty individuals”, probably some subjects have already prodromal AD (or MCI due to AD) which could decrease cognitive effect of physical frailty severity.
The main key points of this study are: 1) it’s the first study which estimated the cognitive profile of subjects with “cognitive frailty”, 2) the large sample study, and 3) the neuropsychological battery realized in MAPT study permitting the well characterization of executive and memory functions. The absence of specific cognitive functions assessment (language, perception, praxia) did not allow to rule on the integrity supposed by these functions in “cognitive frailty individuals”.
“Cognitive frailty individuals” had executive and attention performance worse than “individuals with cognitive impairment and without physical frailty”. They presented a subcortico-frontal cognitive pattern, different of AD which a cortical neurodegenerative dementia. So, after exclusion of dementia and cognitive impairment diagnosis, it seems to be really important to use adequate cognitive screening tools to diagnosis “cognitive frailty individuals” in parallel of usual physical frailty, or cognitive markers because they would be an interesting target for specific prevention intervention. To identify “cognitive frailty”, we could suggest that frail subjects should perform as screening tests Frontal Assessment Battery (33), the 5 words test (34); and FCRST, TMT-A, TMT-B, WAIS-R coding and verbal fluencies as diagnosis tests. We could also propose Mattis Dementia Rating Scale (35).
This large population (“cognitive frailty” sample represented 22% of the population of MAPT study) could be targeted for non-specific multi-domain trials. The advantages of targeted “cognitive frailty individuals” for multi-domain prevention trials include the importance of intervening and potentially slowing or reversing the frailty syndrome, the large numbers of persons affected, and the ability to target these individuals through primary care physicians. Disadvantages to target this population include the broad heterogeneity and presence of multiple morbidities within this population and the likelihood of poor compliance. The selection of the study sample may not be fully representative of the general population. In addition, the neurobiology of frailty has yet to be defined. Endpoints of a study in this population could include both physical and cognitive functions, in particular attention and executive tests.
“Cognitive frailty” could represent a cognitive entity with specific neuropsychological patterns (executive and selective attention). The results of this cross-sectional study could justify a clinical follow-up to assess the cognitive evolution of “cognitive frailty individuals”. In ”cognitive frailty individuals”, probably some subjects have already prodromal AD. A longitudinal study could permit to determinate cognitive decline of “cognitive frailty individuals” and extract subjects who convert to AD in the longitudinal follow-up to better characterize cognitive pattern and trajectory of this entity. Pathophysiological mechanisms of “cognitive frailty” are currently unknown. Ancillary neuroimaging studies of MAPT could provide an opportunity to better understand the relation between “cognitive frailty” and cerebral atrophy, white matter hyperintensities, and amyloid deposits.
Acknowledgments
Funding: This study was supported by grants from the French Ministry of Health (PHRC 2008), and the Institut de Recherche Pierre Fabre (manufacturer of the omega-3 supplement). The promotion of this study was supported by the University Hospital Center of Toulouse. Biological sample collection was supported by Exhonit Therapeutics. AV45-MAPT study was supported by Avid Radiopharmaceuticals Inc and LABEX IRON Innovative Radiopharmaceuticals in Oncology and Neurology. Marco Pahor was supported by the University of Florida’s Claude D. Pepper Older Americans Independence Center (NIH/NIA P30AG028740).
Principal investigator: Bruno Vellas (Toulouse); Coordination: Sophie Gillette-Guyonnet ; Project leader: Isabelle Carrié ; CRA: Lauréane Brigitte ; Investigators: Catherine Faisant, Françoise Lala, Julien Delrieu; Psychologists: Emeline Combrouze, Carole Badufle, Audrey Zueras ; Methodology, statistical analysis and data management: Sandrine Andrieu, Christelle Cantet, Virginie Gardette, Christophe Morin; Multidomain group: Gabor Abellan Van Kan, Charlotte Dupuy, Yves Rolland (physical and nutritional components), Céline Caillaud, Pierre-Jean Ousset (cognitive component), Françoise Lala (preventive consultation) (Toulouse). The cognitive component was designed in collaboration with Sherry Willis from the University of Seattle, and Sylvie Belleville, Brigitte Gilbert and Francine Fontaine from the University of Montreal. Co-Investigators in associated centre: Jean-François Dartigues, Isabelle Marcet, Fleur Delva, Alexandra Foubert, Sandrine Cerda (Bordeaux); Marie-Noëlle-Cuffi, Corinne Costes (Castres); Olivier Rouaud, Patrick Manckoundia, Valérie Quipourt, Sophie Marilier, Evelyne Franon (Dijon); Lawrence Bories, Marie-Laure Pader, Marie-France Basset, Bruno Lapoujade, Valérie Faure, Michael Li Yung Tong, Christine Malick-Loiseau, Evelyne Cazaban-Campistron (Foix); Françoise Desclaux, Colette Blatge (Lavaur); Thierry Dantoine, Cécile Laubarie-Mouret, Isabelle Saulnier, Jean-Pierre Clément, Marie-Agnès Picat, Laurence Bernard-Bourzeix, Stéphanie Willebois, Iléana Désormais, Noëlle Cardinaud (Limoges); Marc Bonnefoy, Pierre Livet, Pascale Rebaudet, Claire Gédéon, Catherine Burdet, Flavien Terracol (Lyon), Alain Pesce, Stéphanie Roth, Sylvie Chaillou, Sandrine Louchart (Monaco); Kristelle Sudres, Nicolas Lebrun, Nadège Barro-Belaygues (Montauban); Jacques Touchon, Karim Bennys, Audrey Gabelle, Aurélia Romano, Lynda Touati, Cécilia Marelli, Cécile Pays (Montpellier); Philippe Robert, Franck Le Duff, Claire Gervais, Sébastien Gonfrier (Nice); Yves Gasnier and Serge Bordes, Danièle Begorre, Christian Carpuat, Khaled Khales, Jean-François Lefebvre, Samira Misbah El Idrissi, Pierre Skolil, Jean-Pierre Salles (Tarbes). MRI group: Carole Dufouil (Bordeaux), Stéphane Lehéricy, Marie Chupin, Jean-François Mangin, Ali Bouhayia (Paris); Michèle Allard (Bordeaux); Frédéric Ricolfi (Dijon); Dominique Dubois (Foix); Marie Paule Bonceour Martel (Limoges); François Cotton (Lyon); Alain Bonafé (Montpellier); Stéphane Chanalet (Nice); Françoise Hugon (Tarbes); Fabrice Bonneville, Christophe Cognard, François Chollet (Toulouse). PET scans group: Pierre Payoux, Thierry Voisin, Julien Delrieu, Sophie Peiffer, Anne Hitzel, (Toulouse); Michèle Allard (Bordeaux); Michel Zanca (Montpellier); Jacques Monteil (Limoges); Jacques Darcourt (Nice). Medico-economics group: Laurent Molinier, Hélène Derumeaux, Nadège Costa (Toulouse). Biological sample collection: Christian Vincent, Bertrand Perret, Claire Vinel (Toulouse).
Footnotes
Authors contribution: J.D. was involved in the writing of the manuscript. J.D., M.P., S.A., B.F., T.V., PJ.O., S.G., I.C., M.C., and B.V. were involved in the review of the subsequent drafts. J.D., S.A., I.C., S.G., and B.V. were involved in the conception and organization of the research project. C.C. was involved in the execution of the statistical analysis.
Conflicts of interest: MAPT study was partially funded by the Institut de Recherche Pierre Fabre, Exhonit Therapeutics and Avid Radiopharmaceuticals Inc.
References
- 1.Morley JE. Frailty: diagnosis and management. J Nutr Health Aging. 2011 Aug;15(8):667–70. doi: 10.1007/s12603-011-0338-4. [DOI] [PubMed] [Google Scholar]
- 2.Ensrud KE, Blackwell TL, Redline S, Ancoli-Israel S, Paudel ML, Cawthon PM, et al. Sleep disturbances and frailty status in older community-dwelling men. J Am Geriatr Soc. 2009 Nov;57(11):2085–93. doi: 10.1111/j.1532-5415.2009.02490.x. [DOI] [PMC free article] [PubMed] [Google Scholar]
- 3.Fried LP, Tangen CM, Walston J, Newman AB, Hirsch C, Gottdiener J, et al. Frailty in older adults: evidence for a phenotype. J Gerontol A Biol Sci Med Sci. 2001 Mar;56(3):M146–56. doi: 10.1093/gerona/56.3.m146. [DOI] [PubMed] [Google Scholar]
- 4.Panza F, Frisardi V, Capurso C, D’Introno A, Colacicco AM, Imbimbo BP, et al. Late-life depression, mild cognitive impairment, and dementia: possible continuum? Am J Geriatr Psychiatry Off J Am Assoc Geriatr Psychiatry. 2010 Feb;18(2):98–116. doi: 10.1097/JGP.0b013e3181b0fa13. [DOI] [PubMed] [Google Scholar]
- 5.Phan HM, Alpert JS, Fain M. Frailty, inflammation, and cardiovascular disease: evidence of a connection. Am J Geriatr Cardiol. 2008 Apr;17(2):101–7. [PubMed] [Google Scholar]
- 6.Snejdrlova M, Kalvach Z, Topinkova E, Vrablik M, Prochazkova R, Kvasilova M, et al. APOE polymorphism as a potential determinant of functional fitness in the elderly regardless of nutritional status. Neuro Endocrinol Lett. 2011;32(Suppl 2):51–4. [PubMed] [Google Scholar]
- 7.Ho Y-Y, Matteini AM, Beamer B, Fried L, Xue Q, Arking DE, et al. Exploring biologically relevant pathways in frailty. J Gerontol A Biol Sci Med Sci. 2011 Sep;66(9):975–9. doi: 10.1093/gerona/glr061. [DOI] [PMC free article] [PubMed] [Google Scholar]
- 8.Buchman AS, Yu L, Boyle PA, Levine SR, Nag S, Schneider JA, et al. Microvascular brain pathology and late-life motor impairment. Neurology. 2013 Feb 19;80(8):712–8. doi: 10.1212/WNL.0b013e3182825116. [DOI] [PMC free article] [PubMed] [Google Scholar]
- 9.Buchman AS, Yu L, Wilson RS, Schneider JA, Bennett DA. Association of brain pathology with the progression of frailty in older adults. Neurology. 2013 May 28;80(22):2055–61. doi: 10.1212/WNL.0b013e318294b462. [DOI] [PMC free article] [PubMed] [Google Scholar]
- 10.Buchman AS, Schneider JA, Leurgans S, Bennett DA. Physical frailty in older persons is associated with Alzheimer disease pathology. Neurology. 2008 Aug 12;71(7):499–504. doi: 10.1212/01.wnl.0000324864.81179.6a. [DOI] [PMC free article] [PubMed] [Google Scholar]
- 11.Buchman AS, Yu L, Wilson RS, Boyle PA, Schneider JA, Bennett DA. Brain Pathology Contributes to Simultaneous Change in Physical Frailty and Cognition in Old Age. J Gerontol A Biol Sci Med Sci. 2014 Aug 18; doi: 10.1093/gerona/glu117. [DOI] [PMC free article] [PubMed] [Google Scholar]
- 12.Bergman H, Ferrucci L, Guralnik J, Hogan DB, Hummel S, Karunananthan S, et al. Frailty: an emerging research and clinical paradigm--issues and controversies. J Gerontol A Biol Sci Med Sci. 2007 Jul;62(7):731–7. doi: 10.1093/gerona/62.7.731. [DOI] [PMC free article] [PubMed] [Google Scholar]
- 13.Kelaiditi E, Cesari M, Canevelli M, van Kan GA, Ousset P-J, Gillette-Guyonnet S, et al. Cognitive frailty: rational and definition from an (I.A.N.A./I.A.G.G.) international consensus group. J Nutr Health Aging. 2013 Sep;17(9):726–34. doi: 10.1007/s12603-013-0367-2. [DOI] [PubMed] [Google Scholar]
- 14.Nasreddine ZS, Phillips NA, Bédirian V, Charbonneau S, Whitehead V, Collin I, et al. The Montreal Cognitive Assessment, MoCA: a brief screening tool for mild cognitive impairment. J Am Geriatr Soc. 2005 Apr;53(4):695–9. doi: 10.1111/j.1532-5415.2005.53221.x. [DOI] [PubMed] [Google Scholar]
- 15.Folstein MF, Folstein SE, McHugh PR. “Mini-mental state”. A practical method for grading the cognitive state of patients for the clinician. J Psychiatr Res. 1975 Nov;12(3):189–98. doi: 10.1016/0022-3956(75)90026-6. [DOI] [PubMed] [Google Scholar]
- 16.Rosen WG, Mohs RC, Davis KL. A new rating scale for Alzheimer’s disease. Am J Psychiatry. 1984 Nov;141(11):1356–64. doi: 10.1176/ajp.141.11.1356. [DOI] [PubMed] [Google Scholar]
- 17.Gillette-Guyonnet S, Andrieu S, Dantoine T, Dartigues J-F, Touchon J, Vellas B, et al. Commentary on “A roadmap for the prevention of dementia II. Leon Thal Symposium 2008.” The Multidomain Alzheimer Preventive Trial (MAPT): a new approach to the prevention of Alzheimer’s disease. Alzheimers Dement J Alzheimers Assoc. 2009 Mar;5(2):114–21. doi: 10.1016/j.jalz.2009.01.008. [DOI] [PubMed] [Google Scholar]
- 18.Vellas B, Carrie I, Gillette-Guyonnet S, Touchon J, Dantoine T, Dartigues J françois, et al. MAPT Study: A Multidomain Approach for Preventing Alzheimer’s Disease: Design and Baseline Data. The Journal of Prevention of Alzheimer’s Disease. 2014;1(1):13–22. [PMC free article] [PubMed] [Google Scholar]
- 19.Grober E, Buschke H, Crystal H, Bang S, Dresner R. Screening for dementia by memory testing. Neurology. 1988 Jun;38(6):900–3. doi: 10.1212/wnl.38.6.900. [DOI] [PubMed] [Google Scholar]
- 20.Cardebat D, Doyon B, Puel M, Goulet P, Joanette Y. Formal and semantic lexical evocation in normal subjects. Performance and dynamics of production as a function of sex, age and educational level. Acta Neurol Belg. 1990;90(4):207–17. [PubMed] [Google Scholar]
- 21.Wechsler D. Wechsler adult intelligence scale-revised. 1981 [Google Scholar]
- 22.Reitan R. Validity of the Trail Making Test as an indicator of brain damage. Percept Mot Skills. 1958:271–6. [Google Scholar]
- 23.Hughes CP, Berg L, Danziger WL, Coben LA, Martin RL. A new clinical scale for the staging of dementia. Br J Psychiatry J Ment Sci. 1982 Jun;140:566–72. doi: 10.1192/bjp.140.6.566. [DOI] [PubMed] [Google Scholar]
- 24.Yesavage JA, Brink TL, Rose TL, Lum O, Huang V, Adey M, et al. Development and validation of a geriatric depression screening scale: a preliminary report. J Psychiatr Res. 1982 1983;17(1):37–49. doi: 10.1016/0022-3956(82)90033-4. [DOI] [PubMed] [Google Scholar]
- 25.Galasko D, Bennett DA, Sano M, Marson D, Kaye J, Edland SD, et al. ADCS Prevention Instrument Project: assessment of instrumental activities of daily living for community-dwelling elderly individuals in dementia prevention clinical trials. Alzheimer Dis Assoc Disord. 2006 Dec;20(4 Suppl 3):S152–69. doi: 10.1097/01.wad.0000213873.25053.2b. [DOI] [PubMed] [Google Scholar]
- 26.Guralnik JM, Ferrucci L, Pieper CF, Leveille SG, Markides KS, Ostir GV, et al. Lower extremity function and subsequent disability: consistency across studies, predictive models, and value of gait speed alone compared with the short physical performance battery. J Gerontol A Biol Sci Med Sci. 2000 Apr;55(4):M221–31. doi: 10.1093/gerona/55.4.m221. [DOI] [PubMed] [Google Scholar]
- 27.Kreiner DS, Ryan JJ. Memory and motor skill components of the WAIS-III Digit Symbol-Coding subtest. Clin Neuropsychol. 2001 Feb;15(1):109–13. doi: 10.1076/clin.15.1.109.1906. [DOI] [PubMed] [Google Scholar]
- 28.Sarazin M, Berr C, De Rotrou J, Fabrigoule C, Pasquier F, Legrain S, et al. Amnestic syndrome of the medial temporal type identifies prodromal AD: a longitudinal study. Neurology. 2007 Nov;69(6)(19):1859–67. doi: 10.1212/01.wnl.0000279336.36610.f7. [DOI] [PubMed] [Google Scholar]
- 29.Buchman AS, Bennett DA. Cognitive frailty. J Nutr Health Aging. 2013 Sep;17(9):738–9. doi: 10.1007/s12603-013-0397-9. [DOI] [PMC free article] [PubMed] [Google Scholar]
- 30.Barnes DE, Alexopoulos GS, Lopez OL, Williamson JD, Yaffe K. Depressive symptoms, vascular disease, and mild cognitive impairment: findings from the Cardiovascular Health Study. Arch Gen Psychiatry. 2006 Mar;63(3):273–9. doi: 10.1001/archpsyc.63.3.273. [DOI] [PubMed] [Google Scholar]
- 31.Saczynski JS, Beiser A, Seshadri S, Auerbach S, Wolf PA, Au R. Depressive symptoms and risk of dementia: the Framingham Heart Study. Neurology. 2010 Jul;75(6)(1):35–41. doi: 10.1212/WNL.0b013e3181e62138. [DOI] [PMC free article] [PubMed] [Google Scholar]
- 32.Woods AJ, Cohen RA, Pahor M. Cognitive frailty: frontiers and challenges. J Nutr Health Aging. 2013 Sep;17(9):741–3. doi: 10.1007/s12603-013-0398-8. [DOI] [PMC free article] [PubMed] [Google Scholar]
- 33.Dubois B, Slachevsky A, Litvan I, Pillon B. The FAB: a Frontal Assessment Battery at bedside. Neurology. 2000 Dec 12;55(11):1621–6. doi: 10.1212/wnl.55.11.1621. [DOI] [PubMed] [Google Scholar]
- 34.Dubois B, Touchon J, Portet F, Ousset PJ, Vellas B, Michel B. “The 5 words”: a simple and sensitive test for the diagnosis of Alzheimer’s disease. Presse Médicale Paris Fr 1983. 2002 Nov 9;31(36):1696–9. [PubMed] [Google Scholar]
- 35.Paulsen JS, Butters N, Sadek JR, Johnson SA, Salmon DP, Swerdlow NR, et al. Distinct cognitive profiles of cortical and subcortical dementia in advanced illness. Neurology. 1995 May;45(5):951–6. doi: 10.1212/wnl.45.5.951. [DOI] [PubMed] [Google Scholar]