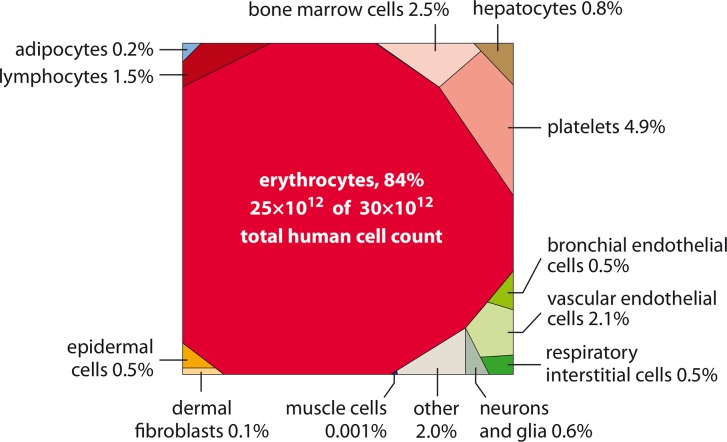
Fig 2. The distribution of the number of human cells by cell type.
Representation as a Voronoi tree map where polygon area is proportional to the number of cells. Visualization performed using the online tool at http://bionic-vis.biologie.uni-greifswald.de/.

