Summary
In acute myeloid leukemia (AML), the cell of origin, nature and biological consequences of initiating lesions and order of subsequent mutations remain poorly understood, as AML is typically diagnosed without observation of a pre-leukemic phase. Here, highly purified hematopoietic stem cells (HSC), progenitor and mature cell fractions from the blood of AML patients were found to contain recurrent DNMT3a mutations (DNMT3amut) at high allele frequency, but without coincident NPM1 mutations (NPM1c) present in AML blasts. DNMT3amut-bearing HSC exhibited multilineage repopulation advantage over non-mutated HSC in xenografts, establishing their identity as pre-leukemic-HSC (preL-HSC). preL-HSC were found in remission samples indicating that they survive chemotherapy. Thus DNMT3amut arises early in AML evolution, likely in HSC, leading to a clonally expanded pool of preL-HSC from which AML evolves. Our findings provide a paradigm for the detection and treatment of pre-leukemic clones before the acquisition of additional genetic lesions engenders greater therapeutic resistance.
Introduction
There is overwhelming evidence that virtually all cancers are clonal and represent the progeny of a single cell1–3. However, the evolutionary trajectory that leads from the first somatic mutation to the eventual development of cancer is not well mapped. The simplest models predict that each newly acquired somatic mutation confers selective advantage to drive successive waves of clonal expansion, with the fittest clone becoming dominant. However the modern era of cancer genomics has exposed a more complex clonal architecture in many tumor types4, where multiple genetically distinct subclones co-exist with the dominant clone5,6. Comparison of diagnostic and recurrent/metastatic samples obtained from the same patient has established that the latter frequently do not evolve from the dominant clone, but instead can be traced either to a minor subclone present at diagnosis, or to a putative, undetected ancestral clone7–15. Thus, a clear understanding of the genomic landscape of tumors is required in order to devise targeting strategies that eliminate not only the dominant clone but also the subclonal reservoirs from which recurrence can arise.
Although the clonal composition of cancer lineages within individual tumors is coming into focus, the very first steps in cancer development remain poorly defined. Early and possibly initiating mutations have been identified from analysis of pre-neoplastic lesions in breast16, lung17, skin18, and colon cancer19, as well as from studies of AML cases that evolved from a prior myelodysplastic syndrome (MDS)20. However, key questions remain unanswered. In particular, can clinically relevant clones be traced back to a non-tumorigenic cell? Do pre-cancerous ancestral clones persist after tumor development? If so, are they present in the diagnostic sample, and do they survive treatment and persist in remission samples?
Human leukemia is a disease model particularly suited to addressing these fundamental questions, due to the depth of our understanding of normal hematopoiesis and the availability of functional assays and analytic tools that allow examination of phenotypically defined populations at the single cell level21. In AML, a subset of cases evolve from a preceding clinically overt phase such as MDS or chronic myeloid leukemia (CML), characterized by clonal expansion of one or more blood lineages22,23. The founder mutations present in pre-leukemic cells are retained in the AML blasts, implicating them as putative initiating events and establishing clonal expansion as the first step in leukemogenesis. Interestingly, somatic mutations in some leukemia-associated genes such as TET2 have also been linked to multilineage clonal hematopoiesis in aging healthy individuals24. Insight into the phenotype of the normal cell from which clonal expansion can initiate was first provided by the pioneering studies of Fialkow in CML, which demonstrated that BCR-ABL1 arises in a multipotential HSC25. However, for the majority of AML cases that arise de novo without any prior clinical perturbations, insight into the cellular context and functional consequences of the earliest genetic lesions requires identification and examination of ancestral cells within the diagnostic sample. Recent studies have found that only a subset of mutations contained in AML blasts were present in HSC-enriched cell fractions isolated from AML patient samples, and that these cells were capable of non-leukemic differentiation26,27. Here we establish that these ancestral preL-HSC present at diagnosis are able to regenerate the entire hematopoietic hierarchy while possessing competitive repopulation advantage over non-leukemic HSC leading to clonal expansion. These preL-HSC are found in a high proportion of AML patients that carry mutations in DNMT3a and IDH2, and unlike AML blasts, they survive induction chemotherapy and persist in the bone marrow at remission, providing a potential reservoir for leukemic progression.
Results
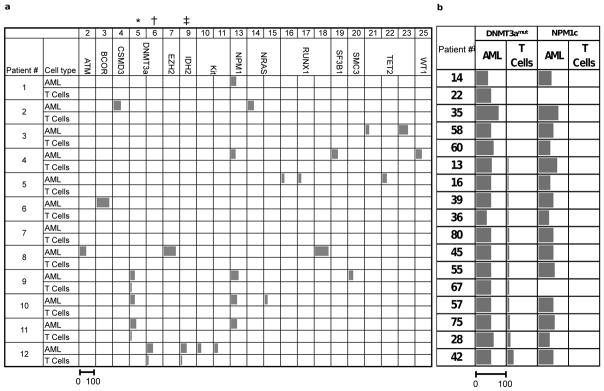
During studies to examine intra-tumoral genetic heterogeneity in AML, deep targeted sequencing (Tar-seq, read depth ~250×) of 103 commonly mutated leukemia genes (Fig. 1a, Supplementary Table 1) was carried out on peripheral blood (PB) samples from 12 patients at diagnosis (blasts >80%) (Supplementary Table 2, 3). Normal T-cells were expanded in vitro to provide non-leukemic tissue for genetic comparison. Consistent with mutant allele frequencies reported in recent studies28 DNMT3amut was found in 4 of 12 samples (mutant allele frequency ~50%) (Fig. 1a). Unexpectedly, in 3 of these 4 patients, DNMT3amut was detected in T-cells at a low allele frequency (1–20%). Other genetic alterations including NPM1c were found only in PB but not T-cell samples, ruling out AML cell contamination of cultured T-cells. To estimate the proportion of AML cases with DNMT3amut-bearing T-cells, 71 additional samples, taken at diagnosis from patients with normal cytogenetics, were screened by Sanger sequencing for DNMT3amut along with other common AML mutations (Supplementary Table 4). Consistent with published data29–31, 17 of 71 AML samples (24%) carried mutations in DNMT3a, and 15 of these 17 (88%) also carried NPM1c. For these 17 patients, the allele frequency of DNMT3amut and NPM1c in CD33+ blasts, as well as corresponding freshly isolated T-cell controls, was measured by droplet digital PCR (ddPCR) at a sensitivity of 1 mutated allele in 1000 reference alleles. Whereas both DNMT3amut and NPM1c were always present in blasts at similar allele frequency, DNMT3amut with no evidence of NPM1c was detected in T-cells from 12 of these 17 patients (70.5%) (Fig. 1b). In addition, FLT3-ITD was detected in blasts but not the T-cells of 2 patients bearing this mutation (Extended Data Fig. 1). These data reveal the sequential order of mutation acquisition in these patients, with DNMT3amut arising earlier in leukemogenesis than NPM1c and FLT3-ITD, a conclusion predicted from recent studies on bulk AML blasts showing that NPM1c and FLT3-ITD occur late and are the only genes recurrently mutated in DNMT3amut AML15,28,32. Moreover, our findings establish that DNMT3amut occurs in an ancestral cell that gives rise to both T-cells and the dominant AML clone present at diagnosis.
Figure 1. Recurrent somatic DNMT3a mutations are common in T-cells from AML patients.
a, Summary of the allele frequency (%) of missense and frameshift somatic single nucleotide variants (sSNV) in AML-related genes assessed by deep targeted sequencing (read depth 250×) in AML blasts and T cells from the peripheral blood of 12 AML patients. The sSNV numbers indicated at the top of the table correspond to the numbers in Supplementary Table 3. Somatic mutations in DNMT3a (*, R882H; †, R137C) were found in both T-cells and AML blasts in Patients #9, 11 and 12. Patient #12 also had a low frequency IDH2 mutation (‡, R140L) in T cells. b, Frequency (%) of DNMT3amut and NPM1c in freshly isolated CD33+ blasts (AML) and matched T-cell controls from 17 patients with normal karyotype AML, as determined by droplet digital PCR. For a and b, the length of the bars is proportional to the mutant allele frequency (the scale bar under the first column applies to all columns).
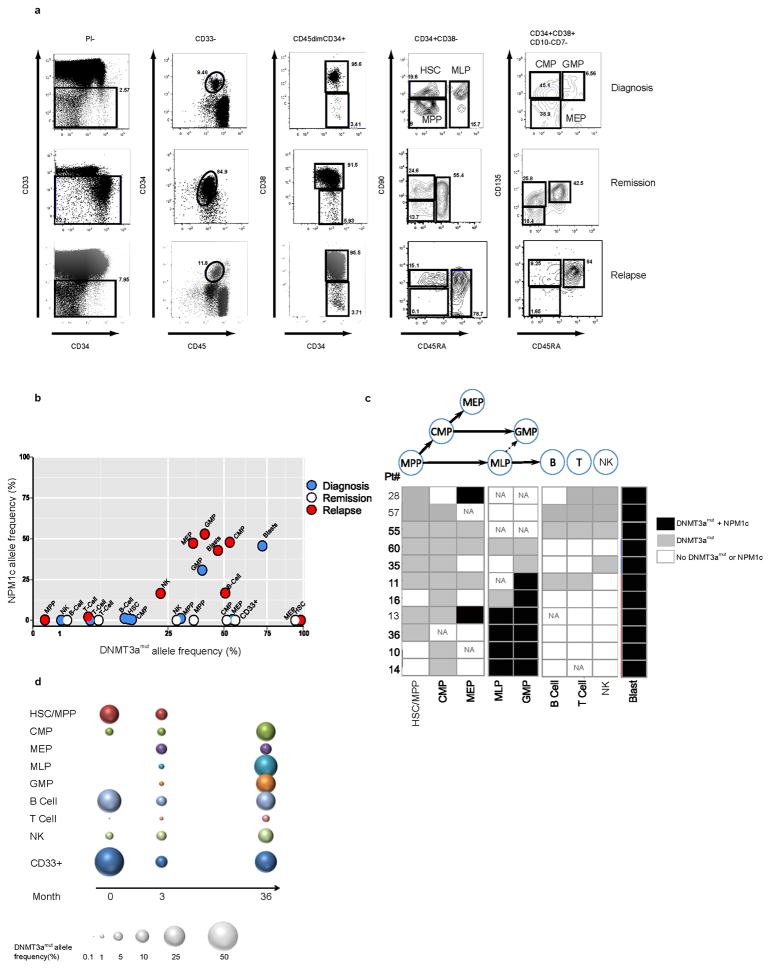
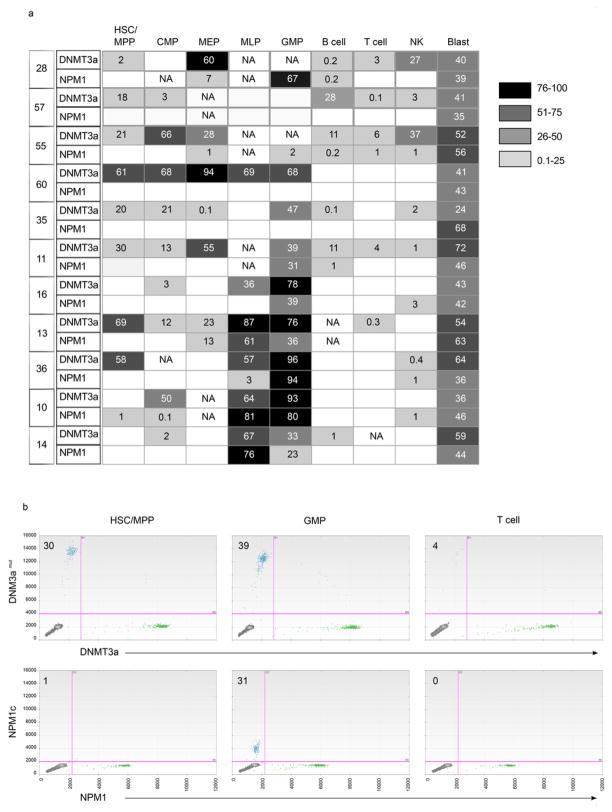
To gain insight into the properties of the ancestral cell within which DNMT3amut first arises, we examined additional non-leukemic hematopoietic cell populations from 11 DNMT3amut/NPM1c AML patients. A high resolution 12-parameter sorting strategy33–35 was employed to isolate non-leukemic hematopoietic stem and progenitor populations, including hematopoietic stem cells/multipotent progenitors (HSC/MPP), multilymphoid progenitors (MLP), common myeloid progenitors (CMP), granulocyte monocyte progenitors (GMP), and megakaryocyte erythroid progenitors (MEP), as well as mature B, T and natural killer (NK) cells within the CD33− cell fraction. Together with CD45dimCD33+ AML blasts, these highly purified, phenotypically defined normal cell populations were assessed by ddPCR for DNMT3amut and NPM1c (Fig. 2, Extended Data Fig. 2, 3). DNMT3amut was found together with NPM1c in CD33+ blasts from all patients. By contrast, we found DNMT3amut at variable allele frequency without NPM1c across the spectrum of mature and progenitor cell populations. Results for a representative patient (#11) are shown in Fig. 2a–b. In this patient, DNMT3amut was present in HSC/MPP at an allele frequency of 12–30% without detectable NPM1c. Although the clonal contribution that an individual normal HSC makes in humans is unknown, studies in higher primates estimated that single HSC provide approximately 0.5% clonal contribution during steady-state hematopoiesis36. Thus, the high DNMT3amut allele frequency in HSC/MPP points to their clonal expansion as compared to non-mutated HSC. In Patient #11, DNMT3amut was also present in all downstream progenitors at variable frequencies. The mean allele frequency among HSC/MPP, MLP and CMP was 24.6% across all patients analyzed (Extended Data Fig. 2). Importantly, even for patients in whom DNMT3amut was not detected in mature cells, DNMT3amut without NPM1c was found in stem/progenitor populations (Fig. 2c), providing further strong evidence that DNMT3amut precedes NPM1c during leukemogenesis. Interestingly, in 3 patients (#10, 14, 16), DNMT3amut was detected in CMP but not HSC/MPP, an outcome consistent with the existence of DNMT3amut-bearing HSC below our detection limit that generated a clonally expanded CMP population, or possibly the existence of a preceding lesion in HSC/MPP with later acquisition of DNMT3amut in CMP. Resolution of this question will require whole genome sequencing of sorted blast and phenotypically normal populations from patient samples. Our analysis also showed that in 6 of 11 patients, both DNMT3amut and NPM1c were found together in MLP and/or GMP populations, pointing to the likely progenitor cell types where overt AML driven by NPM1c arises. Collectively, our findings provide key insights into the leukemogenic process in human AML and confirm historical predictions from early clonality studies of the existence of a pre-leukemic state3,37.
Figure 2. DNMT3a mutation precedes NPM1 mutation in human AML and is present in stem/progenitor cells at diagnosis and remission.
a, Flow cytometric analysis showing the gating strategy used to isolate phenotypically normal stem and progenitor cell populations from AML patient samples. Plots show analysis of samples from Patient #11: diagnosis (day 0, peripheral blood mononuclear cells), remission (day 62, CD34+ enriched bone marrow) and relapse (day 379, peripheral blood mononuclear cells). b, Allele frequency of DNMT3a and NPM1 mutations in stem/progenitor, mature lymphoid and blast (CD45dim CD33+) cell populations, as indicated, isolated from diagnosis (blue), remission (white) and relapse (red) samples of Patient #11 as determined by droplet digital PCR (ddPCR). At remission, CD33+ myeloid cells were also analyzed. c, Summary of the occurrence of DNMT3amut and NPM1c in isolated stem/progenitor, mature and blast cell populations from 11 AML patient peripheral blood samples as determined by ddPCR. White, DNMT3amut or NPM1c not detected; gray, DNMT3amut alone; black, DNMT3amut + NPM1c. NA, no population detected; HSC, hematopoietic stem cell; MPP, multipotent progenitor; MLP, multilymphoid progenitor; CMP, common myeloid progenitor; GMP, granulocyte monocyte progenitor; MEP, megakaryocyte erythroid progenitor; NK, natural killer cells. d, Graphic representation of DNMT3amut allele frequency in sorted cell populations isolated from diagnosis (0 months), early (3) and late (36) remission samples of Patient #57.
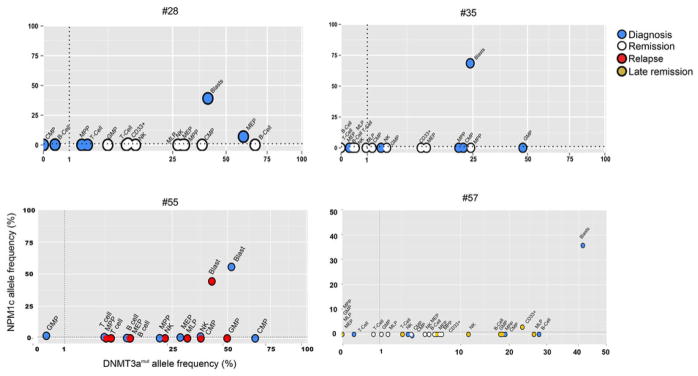
To examine how DNMT3amut affects population dynamics during leukemic progression, we undertook temporal analysis of mature and progenitor cells from 5 patients (#11, 28, 35, 55, 57) sampled at diagnosis, remission (3 months) or relapse (Fig. 2b, d, Extended Data Fig. 3, 4). Compared to diagnosis, the allele frequency of DNMT3amut alone was similar or higher at remission (Patients #11, 28, 35, 57) and relapse (Patient #11, 55). Although CD33+ leukemic blasts at diagnosis always carried both mutations, CD33+ myeloid cells at remission bore only DNMT3amut, suggesting that they are not AML blasts but the progeny of DNMT3amut-bearing progenitors with preserved myeloid differentiation capacity. In the relapse sample of Patient #11, both mutations were present in the majority of cells, with the exception of HSC/MPP in which a proportion carried only DNMT3amut. Patient #57 was a long-surviving patient that allowed a comparison of early and late (36 months) remission samples and showed a striking increase in DNMT3amut allele frequency in most cell populations over time (Fig. 2d). In addition, a small proportion of CD33+ myeloid cells in the late remission PB sample contained both DNMT3amut and the NPM1c mutation found at diagnosis, suggesting either regrowth of the diagnostic leukemic clone or emergence of a new clone following an independent NPM1c mutation event within the preleukemic pool. Collectively, our data indicate that the ancestral cell that bears DNMT3amut without NPM1c is an HSC/MPP capable of multilineage differentiation. Moreover, these ancestral HSC/MPP survive chemotherapy, expand during remission, and might serve as a reservoir for clonal evolution leading to recurrent disease.
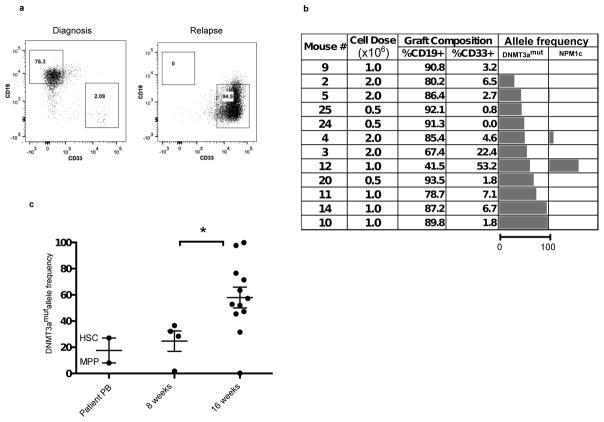
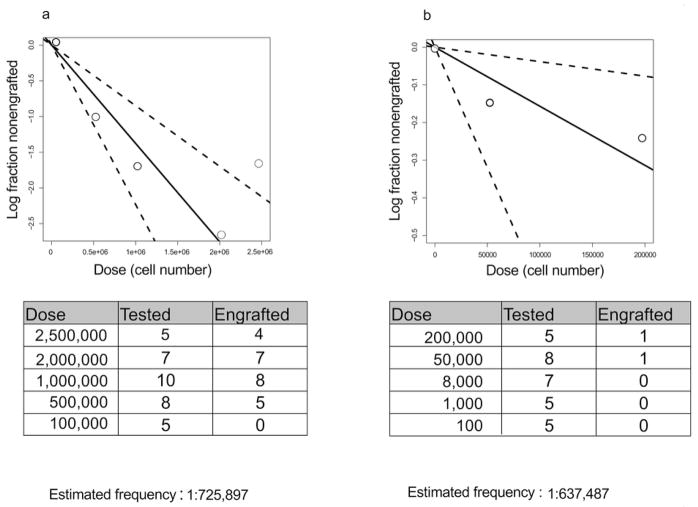
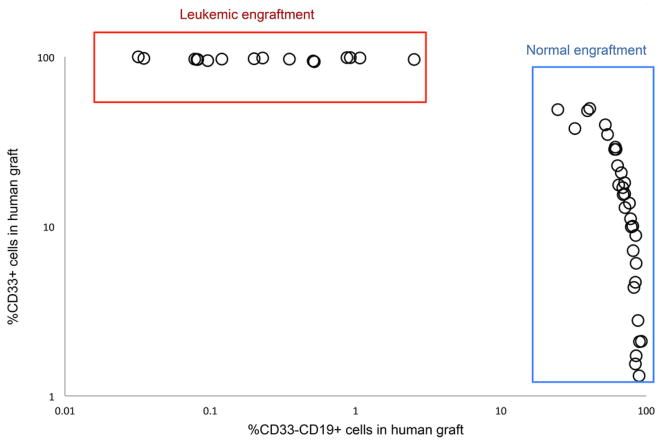
To establish conclusively whether phenotypically defined DNMT3amut-bearing HSC/MPPs are functional HSC and whether competitive repopulation advantage underlies their in vivo clonal expansion, we undertook xenograft repopulation assays. Mononuclear cells from the PB of 2 patients at diagnosis (#11, 55) with DNMT3amut allele frequency in HSC/MPP of 30% and 20% respectively were transplanted into cohorts of immune-deficient mice using a limiting dilution approach and analyzed after 8 and 16 weeks (Fig. 3, Extended Data Fig. 5). In this xenograft model, leukemic engraftment is characteristically seen as a dominant myeloid (CD45dimCD33+) graft, whereas non-leukemic grafts are multilineage and contain both lymphoid (predominantly CD19+ B cells) and myeloid (CD33+) cells (Extended Data Fig. 6). For Patient #11, multilineage engraftment was seen in 24 of 35 mice, giving a calculated frequency of 1 repopulating HSC in 7.3×10⁵ cells (Extended Data Fig. 5a). Only a single graft contained more than 50% CD33+ myeloid cells, suggesting co-engraftment by a leukemia stem cell (LSC) that was present at low frequency38. We analyzed by ddPCR 12 of the multilineage xenografts following 16 weeks of repopulation. Ten of these contained a high proportion of cells bearing DNMT3amut without NPM1c (mean allele frequency 57%), whereas both DNMT3amut and NPM1c were present in the single mouse with significant myeloid engraftment (Fig. 3b). Kinetic analysis demonstrated increasing DNMT3amut allele frequency in multilineage grafts over time (Fig 3c). Similar results were found for Patient #55 (Extended Data Fig. 5 and data not shown). In contrast, cells from the relapse sample of both patients generated leukemic grafts and no multilineage grafts (Fig. 3a and data not shown), consistent with a higher LSC frequency at relapse compared to diagnosis38. Together, these data provide evidence that DNMT3amut occurs in HSC/MPP capable of generating a long-term multilineage lympho-myeloid graft, confirming their designation as pre-leukemic HSC26 (preL-HSC). DNMT3amut also endows preL-HSC with a competitive repopulation advantage over non-mutated HSC explaining the clonal expansion of preL-HSC in patients at the time of diagnosis and during remission.
Figure 3. Pre-leukemic HSC bearing DNMT3amut generate multilineage engraftment and have a competitive advantage in xenograft repopulation assays.
a, Representative flow cytometric analysis of engrafted human cells harvested from NSG mouse bone marrow (BM) 16 weeks after intrafemoral (i.f.) transplantation of peripheral blood mononuclear cells (PB MNC) from diagnosis and relapse samples of Patient #11. b, Analysis of human graft composition in NSG mouse BM 16 weeks after i.f. transplantation of PB MNC from the diagnosis sample of Patient #11 across a range of cells doses. The percentage of human (CD45+) B (CD19+) and myeloid (CD33+) cells was determined by flow cytometry. Mutant allele frequency (%) in the human graft was determined by droplet digital PCR (ddPCR) analysis of sorted human cells. The length of the bars is proportional to the mutant allele frequency (the scale bar under the first column applies to all columns). c, Summary of DNMT3amut allele frequency in the human graft from mice analyzed by ddPCR 8 and 16 weeks after transplantation of PB MNC from Patient #11, compared to isolated hematopoietic stem cell/multipotent progenitors (HSC/MPP) from the patient’s PB at diagnosis. *, P<0.05. Bars indicate mean and standard deviation.
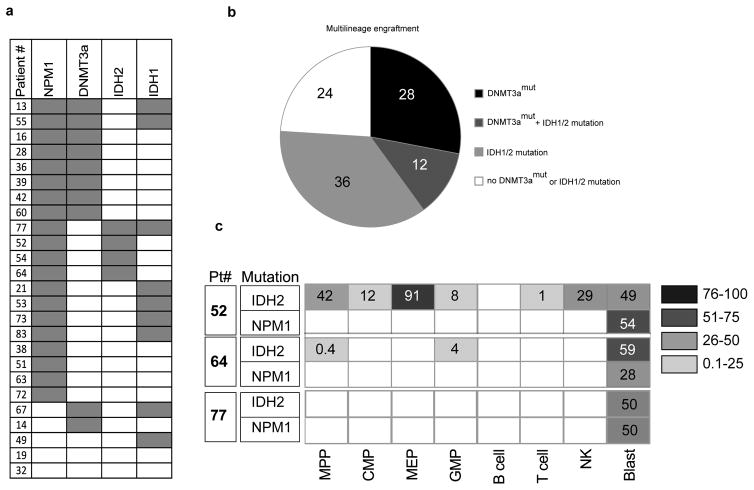
Our xenograft results indicate that when preL-HSC exists at higher frequency than LSC, non-leukemic multilineage grafts, rather than leukemic grafts, are frequently generated. Examination of our historical xenograft data from 264 diagnostic AML samples revealed that 37% did not generate any graft, 40% generated leukemia, and 23% gave rise to non-leukemic multilineage grafts (Extended Data Fig. 6). Sanger sequencing data was available for 25 samples that generated multilineage grafts (Supplementary Table 4) revealing that 10 of 25 (40%) came from patients bearing DNMT3amut; IDH1/2 mutations were present in 12 patients, including 3 who had both DNMT3a and IDH1/2 mutations (Fig. 4a, 4b). It was not possible to determine conclusively whether these xenografts were generated by preL-HSC, as they were not available for mutation testing. To examine whether pre-leukemic cells also exist in patients with IDH1/2 mutations, we analyzed samples from 3 patients with IDH1 and 3 patients with IDH2 mutation by high resolution cell sorting and ddPCR. In 4 patients, no pattern of preceding mutation was detected in non-leukemic cell populations. However, in 2 patients we found IDH2 mutation without NPM1c in a number of progenitor and mature populations (Fig. 4c), suggesting that IDH2 mutation might also occur as a pre-leukemic event.
Figure 4. Identification of preL-HSC with IDH2 mutation.
a, Summary of the occurrence of mutations in NPM1, DNMT3a, and IDH1/2 determined by Sanger sequencing, in AML patient peripheral blood samples (n=25) that generated a non-leukemic multilineage graft after transplantation into immune-deficient mice. b, Representation of the proportion (%) of AML patient samples with DNMT3a and/or IHD1/2 mutations among samples that generated a non-leukemic multilineage graft in xenotransplanted mice. c, IDH2 and NPM1 mutant allele frequency (%) in stem/progenitor, mature lymphoid and blast (CD45dimCD33+) cell populations isolated from the peripheral blood of Patients #52, 64 and 77 at diagnosis, as determined by droplet digital PCR (ddPCR). Blank boxes indicate no mutation detected.
Our data predict that DNMT3a mutation may occur in healthy adults and pre-date AML diagnosis by months or even years. Through searches of exome sequence databases derived from PB (https://esp.gs.washington.edu/drupal/) we found that the frequency of the DNMT3a R882H variant (rs147001633) was 0.066% (3 in 4545). Although this was considered to be a germline variant in this healthy adult cohort, our findings raise the possibility that the mutations detected in these studies may have originated from an HSC/MPP containing an acquired somatic DNMT3a mutation that underwent clonal expansion.
Discussion
Our study provides a number of key insights into the leukemogenic process in human AML. Our findings establish the sequential order of mutation acquisition for the patients reported here: DNMT3amut occurs before NPM1c and FLT3-ITD. Additionally, we provide strong evidence for the presence, at diagnosis, of preL-HSCs that are ancestral to the dominant AML clone. Based on our data, preL-HSC are prevalent among patients with DNMT3amut, which account for 25% of adult AML cases; additionally, our multilineage engraftment data suggest that preL-HSC may also exist in a proportion of AML patients with IDH2 mutations. Pre-leukemic progenitors of varying phenotypes have been reported in other types of hematologic malignancies25,39–41, although functional studies were limited. Our work supports prior studies identifying phenotypic primitive cells that bear only a subset of mutations found in AML blasts26,27,42. The more precise analysis of highly resolved HSC and progenitor populations that we have undertaken provides novel insight into the identity and proportional contribution of the stem/progenitor populations that acquire pre-leukemic lesions. Furthermore, our work demonstrates that DNMT3amut confers a functional repopulation advantage to preL-HSC over wild type HSC in xenograft assays, which likely underlies the clonal expansion of preL-HSC observed in patients at the time of diagnosis. Our study is consistent with mouse studies showing that HSC lacking DNMT3a have a competitive growth advantage43,44, and with a recent report predicting that the human DNMT3amut results in loss of function45.
Collectively, our results support a model wherein the cell of origin for DNMT3amut AML is an HSC and the initiating DNMT3a mutation results in the generation of an expanded pool of HSC and downstream progenitors, within which additional mutations such as NPM1c are acquired, driving progression to AML. In the samples studied here, our findings point to GMP and/or MLP as the likely populations in which NPM1c was acquired. Our experimental design provides a framework for the future identification of other early events in leukemogenesis, using generation of multilineage xenografts as a surrogate assay to identify AML samples that may contain preL-HSC, and for examining how these changes disrupt normal HSC function, cause clonal expansion and initiate leukemic development.
Our results have broad clinical implications. Prior studies in T-ALL46 and B-ALL7,11,14 revealed the existence of genetically diverse subclones at diagnosis. As found originally in these diseases47 and now in AML, in approximately 50% of patients the relapse clone is not related to the predominant clone at diagnosis but rather to a minor leukemic subclone 10,15 or to a predicted ancestral clone47, Our direct demonstration that ancestral clones persist at remission suggests that preL-HSCs are resistant to induction chemotherapy and for some patients they might represent a reservoir from which relapse arises. If future phylogenetic single cell lineage analysis establishes this possibility, then preL-HSC should be directly targeted to prevent relapse. As new drugs are developed that effectively target mutations in DNMT3a or other genes (e.g. AG-221, an IDH2 inhibitor) that give rise to preL-HSC, there may be an opportunity to eradicate these preL-HSC clones before the acquisition of additional mutations renders them more resistant to therapy. Our findings also support broadening the definition of minimal residual disease to include not only the post-therapy survival of AML blasts and LSCs but also preL-HSC. Practically, this suggests that for patients with both DNMT3amut and NPM1c, the residual level of both mutations and not NPM1c alone should be monitored. Finally, our database analysis showing that the DNMT3a R882H variant is present in blood samples from normal adults should stimulate new studies investigating whether preL-HSC are present in healthy individuals and determining the risk of progression to AML; these may in turn enable earlier diagnosis for those patients who present without prior overt hematologic disturbances. Of note, a recent report describes the development of donor-derived leukemia in a patient 27 months after receiving allogeneic HSC from an HLA-matched sibling, whose donated PB cells were later found to carry mutations in IDH2 and DNMT3a at low frequency48. Interestingly, the donor remains free of leukemia 10 years after his stem cell donation, suggesting that the mechanisms underlying the progression from subclinical pre-leukemic hematopoiesis to overt leukemia are complex and context dependent.
Methods
Targeted sequencing of leukemia-associated genes
Genomic DNA (gDNA) was subjected to limited whole genome amplification (RepliG, Qiagen) to obtain the required amount of input DNA for the SureSelect protocol. Amplified gDNA was mechanically sheared using the Covaris M220 Focused-ultrasonicator, and Illumina sequencing adaptors were ligated to fragments to make a sequencing library, which was then hybridized with 120mer biotinylated RNA library baits to capture the regions of interest. Baits were designed to capture the coding sequence of the 103 leukemia-associated genes listed in Supplementary Table 1 (total target size ~370 Kb). The targeted regions were pulled out using magnetic streptavidin beads and amplified. The resulting amplified library was quantified and sequenced on the Illumina HiSeq 2000 platform to an average on target coverage of 250×. Reads were aligned to the reference human genome build hg19 using Novoalign (Novocraft Inc.) and on-target single nucleotide variants (SNVs) and indels were called using the genome analysis tool kit (GATK). Somatic SNVs were called in AML blasts with a read depth of at least 30×. The list of contributors to the gene list is provided in Supplementary Note 1.
T cell isolation and expansion from primary AML samples
CD3+ cells were isolated from peripheral blood (PB) AML patient samples using EasySep (Stem Cell Technologies) and re-suspended at a concentration of 1×10⁷cells/2 mL in RPM1 + 10% FBS-HI + rhIL-2 (250 IU/mL, Proleukin, Chiron) + anti-CD28 antibody (5 ug/mL, clone CD28.2, eBioscience). Cells were then added to one well of a 24-well plate that had been pre-coated for 2 hours with anti-CD3 antibody (Clone OKT3, eBioscience) and cultured for 4 days at 37°C with 5% CO2. Cells were harvested on day 4, resuspended in fresh RPMI + 10% FBS-HI + rhIL2 (250 IU/ml) and replated into one well of a 6-well plate. Cells were further cultured and expanded for 14–20 days, feeding with fresh full medium containing rhIL-2 (250 IU/ml) every 3–4 days. At the end of T cell expansion, the purity of CD3+ T cells was checked by flow cytometry. DNA from the cultured T cells was extracted by PureGene Cell kit (Qiagen).
Droplet digital PCR (ddPCR)
Genomic DNA (25ng) or amplified DNA (2 ul from a 1:20 dilution of a 16 hour RepliG whole genome amplification) was subjected to ddPCR in a 96-well plate according to the manufacturer’s protocol. Each sample was tested in duplicate. The plate was then loaded onto a droplet reader with a two color FAM/VIC fluorescence detector. The mutant allele frequency was calculated as the fraction of positive droplets divided by total droplets containing a target. The TaqMan probes and primers used for ddPCR are listed in Supplementary Table 5. To evaluate the detection limits of the ddPCR assay, a standard curve was generated using serial dilutions of DNA with a known mutation frequency mixed with non-mutated DNA. For probes listed in Supplementary Table 5, the minimum detection level was 1:1000 (0.1%).
Fluorescence activated cell sorting of human stem/progenitor and mature cell populations
Mononuclear cells (1×10⁶/100 μl) from peripheral blood or bone marrow of AML patients were stained with the following antibodies (all from BD unless stated otherwise, dilution used and catalogue number in parentheses): anti-CD45RA-FITC (1:25, 555488), anti-CD90-APC (1:50, 561971), anti-CD135-Biotin (1:10, 624008), anti-CD38-PE-Cy7 (1:200, 335790), anti-CD10-Alexa-700 (1:10, 624040), anti-CD7-Pacific Blue (1:50, 642916), anti-CD45-V500 (1:200, 560777), anti-CD34-APC-Cy7 (1:100, custom made by BD, CD34 clone 581), anti-CD34-PerCP-Efluor 710 (1:100, e-Bioscience 46-0344-42), anti-CD33-PE-Cy5 (1:100, Beckman Coulter PNIM2647U), anti-CD19-PE (1:200, 349204), anti-CD3-FITC (1:100, 349201), anti-CD56-Alexafluor 647 (1:100, 557711), and Streptavidin-QD605 (1:200, Invitrogen Q10101MP). Samples from Patients #1, 10, 11 (remission sample only), 32, 35, and 55 were enriched for CD34+ cells using a Miltenyi CD34 MicroBead kit according to the manufacturer’s protocol prior to antibody staining. Cells were sorted on a FACS AriaIII to a post-sort purity of >95%.
Xenotransplantation assays
Animal experiments were performed in accordance with institutional guidelines approved by the UHN Animal Care Committee. 8 to 12-week-old female NOD/SCID/IL-2Rgc-null (NSG) mice were sublethally irradiated (225 cGy) 6–24 hours before transplantation. Mononuclear cells from AML patients were depleted of CD3+ cells by EasySep (Stem Cell Technologies) prior to intrafemoral transplantation. Mice were sacrificed 8 or 16 weeks after transplantation and human engraftment in the injected femur and non-injected bone marrow was evaluated by flow cytometry using the following human-specific antibodies (all used at 1:200, all from BD unless stated otherwise, catalogue number in parentheses): anti-CD45-APC (340943), anti-CD19-PE, anti-CD33-PE-Cy5, anti-CD3-FITC, anti-CD14-PE Texas Red (Beckman Coulter PNIM2707U), anti-CD15-Pacific Blue (642917), anti-CD38-PE-Cy7, and anti-CD34-APC-Cy7. The threshold for detection of human engraftment was 0.1% CD45+ cells. All flow cytometric analysis was performed on the LSRII (BD Biosciences). For limiting dilution assays, the frequency of repopulating cells was calculated using ELDA software49.
Statistical analysis
For the initial targeted sequencing analysis, 12 independent patient samples were studied to capture the biologic diversity of AML. For validation of the DNMT3a findings, 71 samples were screened in order to identify at least 15 with DNMT3a mutations, as predicted by the known prevalence of DNMT3a mutation in AML. For limiting dilution analyses, at least 25 xenografts were analyzed for each patient sample to ensure a large enough sample for statistical comparison. No animals or samples were excluded from any analysis. No formal randomization method was applied when assigning animals to different experimental groups. Group allocation and outcome assessment was not done in a blinded manner, including for animal studies. Frequency estimations were generated using the ELDA software, which takes into account whether the assumptions for LDA are met (http://bioinf.wehi.edu.au/software/elda/index.html, provided by the Walter and Eliza Hall Institute)49. P-values were derived using two-tailed Student’s t-tests. In each group of data, estimate variation was taken into account and is indicated as standard deviation. For all graphs, * p=0.01–0.05, ** p=0.001–0.01, and *** p<0.001.
Extended Data
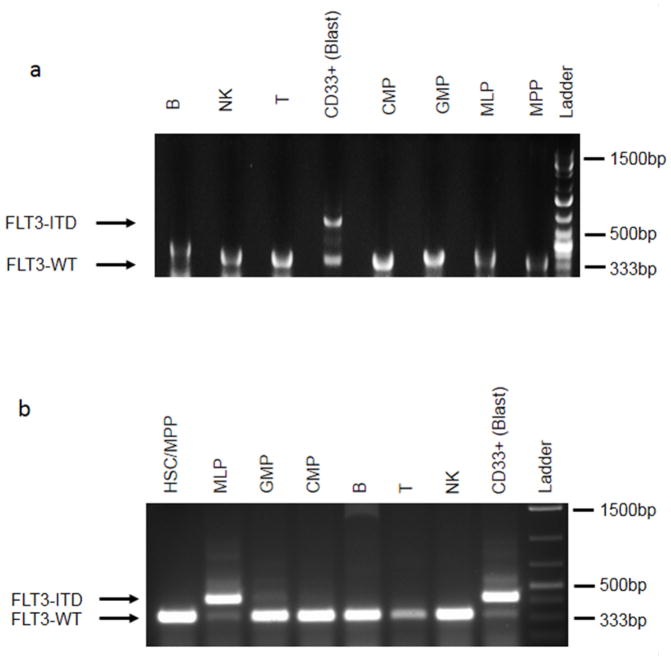
Extended Data Figure 1. FLT3-ITD is a late event in patients carrying DNMT3A mutation.
PCR analysis of FLT3-ITD50 in stem/progenitor, mature lymphoid and blast (CD45dim CD33+) cell populations from patient no. 13 (a) and no. 14 (b). FLT3-ITD was present in the blasts from both patients, and also in MLPs from patient no. 14. In contrast, DNMT3Amut without FLT3-ITD was detected in multiple non-blast cell populations (see Extended Data Fig. 2). HSC, haematopoietic stem cell; MPP, multipotent progenitor; CMP, common myeloid progenitor; MLP, multilymphoid progenitor; GMP, granulocyte monocyte progenitor; NK, natural killer cells.
Extended Data Figure 2. Frequent occurrence of DNMT3A mutation without NPM1 mutation in stem/progenitor and mature lymphoid cells in AML patients at diagnosis.
a, Summary of the allele frequency (%) of DNMT3A and NPM1 mutations in stem/progenitor, mature lymphoid, and blast (CD45dim CD33+) cell populations from 11 AML patient peripheral blood samples obtained at diagnosis, as determined by droplet digital PCR (ddPCR). Phenotypically normal cell populations were isolated by fluorescence activated cell sorting according to the strategy depicted in Fig. 2a. Mutant allele frequency ~50% is consistent with a heterozygous cell population. Departures from 50% mutant allele frequency may be stochastic51, related to clonal heterogeneity, or due to the presence of copy number variations, for example loss of the wild type allele (loss of heterozygosity) or amplification of the mutant allele. NA, no cell population detected; HSC, haematopoietic stem cell; MPP, multipotent progenitor; CMP, common myeloid progenitor; MEP, megakaryocyte erythroid progenitor; MLP, multilymphoid progenitor; GMP, granulocyte monocyte progenitor; NK, natural killer cells. Blank boxes indicate no DNMT3A or NPM1 mutation detected. b, Representative plots showing ddPCR analysis of DNMT3Amut and NPM1c allele frequency in sorted cell populations from patient no. 11. The mutant allele frequency (%) is indicated on each plot.
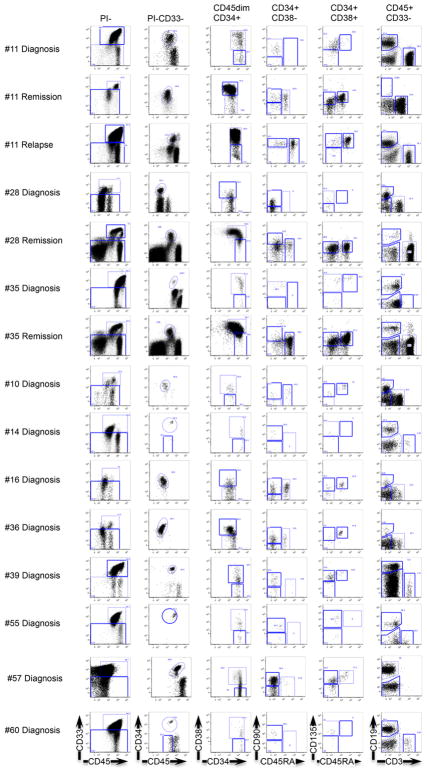
Extended Data Figure 3. Phenotypically normal stem/progenitor and mature cell populations are present in AML patient samples at diagnosis, remission and relapse.
Flow cytometric analysis showing the gating strategy used to isolate phenotypically normal stem/progenitor and mature lymphoid cell populations from AML patient samples. Diagnosis and relapse samples are from peripheral blood; remission samples are from bone marrow.
Extended Data Figure 4. Cells bearing mutations in DNMT3A but not NPM1 are present at diagnosis in AML patients and persist at remission and relapse.
Allele frequency of DNMT3A and NPM1 mutations of patients no. 28, 35, 55, and 57 in stem/progenitor, mature and blast (CD45dim CD33+) cell populations, as determined by droplet digital PCR (ddPCR). Cells were isolated from diagnosis (blue), early remission (white), relapse (red) or late remission (yellow) samples. At remission, CD33+ myeloid cells were also analysed. HSC, haematopoietic stem cell; MPP, multipotent progenitor; MLP, multilymphoid progenitor; CMP, common myeloid progenitor; GMP, granulocyte monocyte progenitor; MEP, megakaryocyte erythroid progenitor; NK, natural killer cells.
Extended Data Figure 5. PreL-HSCs in the peripheral blood of AML patients generate multilineage human grafts in immunodeficient mice.
Summary of results of limiting dilution experiments to assess frequency of pre-leukaemic HSCs generating multilineage grafts after xenotransplantation. Cohorts of NSG mice were transplanted intrafemorally with varying numbers of peripheral blood mononuclear cells from diagnostic samples of AML patient no. 11 (a) and no. 55 (b) and analysed after 8 or 16 weeks by flow cytometry. Engraftment was defined as >0.1% human CD45+ cells in the injected right femur. Shown is the number of mice with multilineage human grafts containing both CD33+ myeloid cells and CD33−CD19+ cells. The frequency of pre-leukaemic HSCs was calculated using the ELDA platform49.
Extended Data Figure 6. Frequent generation of non-leukaemic multilineage human grafts following xenotransplantation of peripheral blood cells from AML patients.
Summary of xenograft characteristics in 123 sublethally irradiated NSG mice transplanted intrafemorally with mononuclear peripheral blood cells from 20 AML patients at diagnosis and analysed after 8 weeks by flow cytometry. The proportion of myeloid (CD33+) and B-lymphoid (CD33−CD19+) cells in the human (CD45+) graft is shown. Leukaemic (AML) engraftment is characterized by a dominant myeloid (CD45dimCD33+) graft, whereas non-leukaemic multilineage grafts contain both lymphoid (predominantly CD33−CD19+ B cells) and myeloid (CD33+) cells. No leukaemic or multilineage graft could be detected in 65/123 mice (53%) in this cohort. Red box indicates AML grafts (27 mice, 22%); blue box indicates multilineage grafts (31 mice, 25%).
Supplementary Material
Acknowledgments
We thank all members of the Dick lab for critical assessment of this work, A. Khandani, P. Penttilä, N. Simard, T. Velauthapillai and the SickKids-UHN flow facility for technical support, J. Claudio for management of the HALT studies that enabled the genetic analysis described herein, and Jie Cui and Xiu-Zhi Yang for curating the human AML samples used in these studies. This work was supported by a Postdoctoral Fellowship Award from the McEwen Centre for Regenerative Medicine with funding made available through the Gentle Ben Charity (L.I.S.), a Canadian Institutes for Health Research (CIHR) fellowship in partnership with the Aplastic Anemia and Myelodysplasia Association of Canada and an award from Vetenskapsradet (S.Z.), and by grants from CIHR, Canadian Cancer Society, Terry Fox Foundation, Genome Canada through the Ontario Genomics Institute, Ontario Institute for Cancer Research with funds from the province of Ontario, a Canada Research Chair, and the Ontario Ministry of Health and Long Term Care (OMOHLTC). The views expressed do not necessarily reflect those of the OMOHLTC. This work was also supported by the Cancer Stem Cell Consortium with funding from the Government of Canada through Genome Canada and the Ontario Genomics Institute (OGI-047), and through the Canadian Institutes of Health Research (CSC-105367). Contributors to the HALT Pan-Leukemia Gene Panel are listed in Supplementary Note 1.
Footnotes
Author Contributions
Authors L.I.S., S.Z. contributed equally to this work; L.I.S., S.Z. designed and performed experiments, analyzed data and wrote the manuscript; A.M., W.C.C screened AML engraftment in xenotransplantation assays; J.M.B., V.G., J.A.K., A.D.S., A.C.S., K.W.Y., M.D.M. collected AML samples and assembled clinical information; J.A.K. correlated xenotransplantation engraftment data with clinical information; J.L.M., M.D. performed xenotransplantation experiments; J.J.F.M., R.M. performed ddPCR; H.J.K., K.L. performed Sanger sequencing; J.D.M., T.J.H., supervised the targeted sequencing; A.M.K.B performed targeted sequencing; Q.M.T., L.D.S. performed DNMT3a data mining. M.D.M. designed the study; J.C.Y.W. supervised AML xenotransplantation screening experiments, designed the study and wrote the manuscript; J.E.D. supervised the study and wrote the manuscript.
References
- 1.Fialkow PJ, et al. Clonal development, stem-cell differentiation, and clinical remissions in acute nonlymphocytic leukemia. N Engl J Med. 1987;317:468–73. doi: 10.1056/NEJM198708203170802. [DOI] [PubMed] [Google Scholar]
- 2.McCulloch EA, Howatson AF, Buick RN, Minden MD, Izaguirre CA. Acute myeloblastic leukemia considered as a clonal hemopathy. Blood Cells. 1979;5:261–82. [PubMed] [Google Scholar]
- 3.Vogelstein B, Fearon ER, Hamilton SR, Feinberg AP. Use of restriction fragment length polymorphisms to determine the clonal origin of human tumors. Science. 1985;227:642–5. doi: 10.1126/science.2982210. [DOI] [PubMed] [Google Scholar]
- 4.Kandoth C, et al. Mutational landscape and significance across 12 major cancer types. Nature. 2013;502:333–9. doi: 10.1038/nature12634. [DOI] [PMC free article] [PubMed] [Google Scholar]
- 5.Greaves M, Maley CC. Clonal evolution in cancer. Nature. 2012;481:306–13. doi: 10.1038/nature10762. [DOI] [PMC free article] [PubMed] [Google Scholar]
- 6.Yates LR, Campbell PJ. Evolution of the cancer genome. Nat Rev Genet. 2012;13:795–806. doi: 10.1038/nrg3317. [DOI] [PMC free article] [PubMed] [Google Scholar]
- 7.Anderson K, et al. Genetic variegation of clonal architecture and propagating cells in leukaemia. Nature. 2011;469:356–61. doi: 10.1038/nature09650. [DOI] [PubMed] [Google Scholar]
- 8.Campbell PJ, et al. The patterns and dynamics of genomic instability in metastatic pancreatic cancer. Nature. 2010;467:1109–13. doi: 10.1038/nature09460. [DOI] [PMC free article] [PubMed] [Google Scholar]
- 9.Ding L, et al. Genome remodelling in a basal-like breast cancer metastasis and xenograft. Nature. 2010;464:999–1005. doi: 10.1038/nature08989. [DOI] [PMC free article] [PubMed] [Google Scholar]
- 10.Ding L, et al. Clonal evolution in relapsed acute myeloid leukaemia revealed by whole-genome sequencing. Nature. 2012;481:506–10. doi: 10.1038/nature10738. [DOI] [PMC free article] [PubMed] [Google Scholar]
- 11.Notta F, et al. Evolution of human BCR-ABL1 lymphoblastic leukaemia-initiating cells. Nature. 2011;469:362–7. doi: 10.1038/nature09733. [DOI] [PubMed] [Google Scholar]
- 12.Shah SP, et al. Mutational evolution in a lobular breast tumour profiled at single nucleotide resolution. Nature. 2009;461:809–13. doi: 10.1038/nature08489. [DOI] [PubMed] [Google Scholar]
- 13.Yachida S, et al. Distant metastasis occurs late during the genetic evolution of pancreatic cancer. Nature. 2010;467:1114–7. doi: 10.1038/nature09515. [DOI] [PMC free article] [PubMed] [Google Scholar]
- 14.Mullighan CG, et al. Genomic analysis of the clonal origins of relapsed acute lymphoblastic leukemia. Science. 2008;322:1377–80. doi: 10.1126/science.1164266. [DOI] [PMC free article] [PubMed] [Google Scholar]
- 15.Shlush LI, et al. Cell lineage analysis of acute leukemia relapse uncovers the role of replication-rate heterogeneity and microsatellite instability. Blood. 2012;120:603–12. doi: 10.1182/blood-2011-10-388629. [DOI] [PubMed] [Google Scholar]
- 16.Sgroi DC. Preinvasive breast cancer. Annu Rev Pathol. 2010;5:193–221. doi: 10.1146/annurev.pathol.4.110807.092306. [DOI] [PMC free article] [PubMed] [Google Scholar]
- 17.Wistuba II, Mao L, Gazdar AF. Smoking molecular damage in bronchial epithelium. Oncogene. 2002;21:7298–306. doi: 10.1038/sj.onc.1205806. [DOI] [PubMed] [Google Scholar]
- 18.Balaban GB, Herlyn M, Clark WH, Jr, Nowell PC. Karyotypic evolution in human malignant melanoma. Cancer Genet Cytogenet. 1986;19:113–22. doi: 10.1016/0165-4608(86)90378-x. [DOI] [PubMed] [Google Scholar]
- 19.Vogelstein B, et al. Genetic alterations during colorectal-tumor development. N Engl J Med. 1988;319:525–32. doi: 10.1056/NEJM198809013190901. [DOI] [PubMed] [Google Scholar]
- 20.Walter MJ, et al. Clonal architecture of secondary acute myeloid leukemia. N Engl J Med. 2012;366:1090–8. doi: 10.1056/NEJMoa1106968. [DOI] [PMC free article] [PubMed] [Google Scholar]
- 21.Doulatov S, Notta F, Laurenti E, Dick JE. Hematopoiesis: a human perspective. Cell Stem Cell. 2012;10:120–36. doi: 10.1016/j.stem.2012.01.006. [DOI] [PubMed] [Google Scholar]
- 22.Raza A, Galili N. The genetic basis of phenotypic heterogeneity in myelodysplastic syndromes. Nat Rev Cancer. 2012;12:849–59. doi: 10.1038/nrc3321. [DOI] [PubMed] [Google Scholar]
- 23.Shih AH, Abdel-Wahab O, Patel JP, Levine RL. The role of mutations in epigenetic regulators in myeloid malignancies. Nat Rev Cancer. 2012;12:599–612. doi: 10.1038/nrc3343. [DOI] [PubMed] [Google Scholar]
- 24.Busque L, et al. Recurrent somatic TET2 mutations in normal elderly individuals with clonal hematopoiesis. Nat Genet. 2012;44:1179–81. doi: 10.1038/ng.2413. [DOI] [PMC free article] [PubMed] [Google Scholar]
- 25.Fialkow PJ, Gartler SM, Yoshida A. Clonal origin of chronic myelocytic leukemia in man. Proc Natl Acad Sci U S A. 1967;58:1468–71. doi: 10.1073/pnas.58.4.1468. [DOI] [PMC free article] [PubMed] [Google Scholar]
- 26.Jan M, et al. Clonal evolution of preleukemic hematopoietic stem cells precedes human acute myeloid leukemia. Sci Transl Med. 2012;4:149ra118. doi: 10.1126/scitranslmed.3004315. [DOI] [PMC free article] [PubMed] [Google Scholar]
- 27.Miyamoto T, Weissman IL, Akashi K. AML1/ETO-expressing nonleukemic stem cells in acute myelogenous leukemia with 8;21 chromosomal translocation. Proc Natl Acad Sci U S A. 2000;97:7521–6. doi: 10.1073/pnas.97.13.7521. [DOI] [PMC free article] [PubMed] [Google Scholar]
- 28.Cancer Genome Atlas Research N. Genomic and epigenomic landscapes of adult de novo acute myeloid leukemia. N Engl J Med. 2013;368:2059–74. doi: 10.1056/NEJMoa1301689. [DOI] [PMC free article] [PubMed] [Google Scholar]
- 29.Yan XJ, et al. Exome sequencing identifies somatic mutations of DNA methyltransferase gene DNMT3A in acute monocytic leukemia. Nat Genet. 2011;43:309–15. doi: 10.1038/ng.788. [DOI] [PubMed] [Google Scholar]
- 30.Ley TJ, et al. DNMT3A mutations in acute myeloid leukemia. N Engl J Med. 2010;363:2424–33. doi: 10.1056/NEJMoa1005143. [DOI] [PMC free article] [PubMed] [Google Scholar]
- 31.Patel JP, et al. Prognostic relevance of integrated genetic profiling in acute myeloid leukemia. N Engl J Med. 2012;366:1079–89. doi: 10.1056/NEJMoa1112304. [DOI] [PMC free article] [PubMed] [Google Scholar]
- 32.Kronke J, et al. Clonal evolution in relapsed NPM1-mutated acute myeloid leukemia. Blood. 2013;122:100–8. doi: 10.1182/blood-2013-01-479188. [DOI] [PubMed] [Google Scholar]
- 33.Doulatov S, et al. Revised map of the human progenitor hierarchy shows the origin of macrophages and dendritic cells in early lymphoid development. Nat Immunol. 2010;11:585–93. doi: 10.1038/ni.1889. [DOI] [PubMed] [Google Scholar]
- 34.Notta F, et al. Isolation of single human hematopoietic stem cells capable of long-term multilineage engraftment. Science. 2011;333:218–21. doi: 10.1126/science.1201219. [DOI] [PubMed] [Google Scholar]
- 35.Laurenti E, et al. The transcriptional architecture of early human hematopoiesis identifies multilevel control of lymphoid commitment. Nat Immunol. 2013;14:756–63. doi: 10.1038/ni.2615. [DOI] [PMC free article] [PubMed] [Google Scholar]
- 36.Kim HJ, et al. Many multipotential gene-marked progenitor or stem cell clones contribute to hematopoiesis in nonhuman primates. Blood. 2000;96:1–8. [PubMed] [Google Scholar]
- 37.Fialkow PJ, Janssen JW, Bartram CR. Clonal remissions in acute nonlymphocytic leukemia: evidence for a multistep pathogenesis of the malignancy. Blood. 1991;77:1415–7. [PubMed] [Google Scholar]
- 38.Eppert K, et al. Stem cell gene expression programs influence clinical outcome in human leukemia. Nat Med. 2011;17:1086–93. doi: 10.1038/nm.2415. [DOI] [PubMed] [Google Scholar]
- 39.Jankowska AM, et al. Mutational spectrum analysis of chronic myelomonocytic leukemia includes genes associated with epigenetic regulation: UTX, EZH2, and DNMT3A. Blood. 2011;118:3932–41. doi: 10.1182/blood-2010-10-311019. [DOI] [PMC free article] [PubMed] [Google Scholar]
- 40.Kikushige Y, et al. Self-renewing hematopoietic stem cell is the primary target in pathogenesis of human chronic lymphocytic leukemia. Cancer Cell. 2011;20:246–59. doi: 10.1016/j.ccr.2011.06.029. [DOI] [PubMed] [Google Scholar]
- 41.Walter MJ, et al. Recurrent DNMT3A mutations in patients with myelodysplastic syndromes. Leukemia. 2011;25:1153–8. doi: 10.1038/leu.2011.44. [DOI] [PMC free article] [PubMed] [Google Scholar]
- 42.Chan SM, Majeti R. Role of DNMT3A, TET2, and IDH1/2 mutations in pre-leukemic stem cells in acute myeloid leukemia. Int J Hematol. 2013 doi: 10.1007/s12185-013-1407-8. [DOI] [PMC free article] [PubMed] [Google Scholar]
- 43.Challen GA, et al. Dnmt3a is essential for hematopoietic stem cell differentiation. Nat Genet. 2012;44:23–31. doi: 10.1038/ng.1009. [DOI] [PMC free article] [PubMed] [Google Scholar]
- 44.Tadokoro Y, Ema H, Okano M, Li E, Nakauchi H. De novo DNA methyltransferase is essential for self-renewal, but not for differentiation, in hematopoietic stem cells. J Exp Med. 2007;204:715–22. doi: 10.1084/jem.20060750. [DOI] [PMC free article] [PubMed] [Google Scholar]
- 45.Kim SJ, et al. A DNMT3A mutation common in AML exhibits dominant-negative effects in murine ES cells. Blood. 2013 doi: 10.1182/blood-2013-02-483487. [DOI] [PMC free article] [PubMed] [Google Scholar]
- 46.Clappier E, et al. Clonal selection in xenografted human T cell acute lymphoblastic leukemia recapitulates gain of malignancy at relapse. J Exp Med. 2011;208:653–61. doi: 10.1084/jem.20110105. [DOI] [PMC free article] [PubMed] [Google Scholar]
- 47.Inaba H, Greaves M, Mullighan CG. Acute lymphoblastic leukaemia. Lancet. 2013;381:1943–55. doi: 10.1016/S0140-6736(12)62187-4. [DOI] [PMC free article] [PubMed] [Google Scholar]
- 48.Yasuda T, et al. Leukemic evolution of donor-derived cells harboring IDH2 and DNMT3A mutations after allogeneic stem cell transplantation. Leukemia. 2013 doi: 10.1038/leu.2013.278. [DOI] [PubMed] [Google Scholar]
- 49.Hu Y, Smyth GK. ELDA: extreme limiting dilution analysis for comparing depleted and enriched populations in stem cell and other assays. J Immunol Methods. 2009;347:70–8. doi: 10.1016/j.jim.2009.06.008. [DOI] [PubMed] [Google Scholar]
- 50.Kottaridis PD, et al. Studies of FLT3 mutations in paired presentation and relapse samples from patients with acute myeloid leukemia: implications for the role of FLT3 mutations in leukemogenesis, minimal residual disease detection, and possible therapy with FLT3 inhibitors. Blood. 2002;100:2393–8. doi: 10.1182/blood-2002-02-0420. [DOI] [PubMed] [Google Scholar]
- 51.Heinrich V, et al. The allele distribution in next-generation sequencing data sets is accurately described as the result of a stochastic branching process. Nucleic Acids Res. 2012;40:2426–31. doi: 10.1093/nar/gkr1073. [DOI] [PMC free article] [PubMed] [Google Scholar]
Associated Data
This section collects any data citations, data availability statements, or supplementary materials included in this article.


