

Abstract
BACKGROUND
Immediate access to an automated external defibrillator (AED) increases the chance of survival from out-of-hospital cardiac arrest (OHCA). Current deployment usually considers spatial AED access, assuming AEDs are available 24 h a day.
OBJECTIVES
We sought to develop an optimization model for AED deployment, accounting for spatial and temporal accessibility, to evaluate if OHCA coverage would improve compared to deployment based on spatial accessibility alone.
METHODS
This was a retrospective population-based cohort study using data from the Toronto Regional RescuNET cardiac arrest database. We identified all nontraumatic public-location OHCAs in Toronto, Canada (January 2006 through August 2014) and obtained a list of registered AEDs (March 2015) from Toronto emergency medical services. We quantified coverage loss due to limited temporal access by comparing the number of OHCAs that occurred within 100 meters of a registered AED (assumed 24/7 coverage) with the number that occurred both within 100 meters of a registered AED and when the AED was available (actual coverage). We then developed a spatiotemporal optimization model that determined AED locations to maximize OHCA actual coverage and overcome the reported coverage loss. We computed the coverage gain between the spatiotemporal model and a spatial-only model using 10-fold cross-validation.
RESULTS
We identified 2,440 atraumatic public OHCAs and 737 registered AED locations. A total of 451 OHCAs were covered by registered AEDs under assumed 24/7 coverage, and 354 OHCAs under actual coverage, representing a coverage loss of 21.5% (p < 0.001). Using the spatiotemporal model to optimize AED deployment, a 25.3% relative increase in actual coverage was achieved over the spatial-only approach (p < 0.001).
CONCLUSIONS
One in 5 OHCAs occurred near an inaccessible AED at the time of the OHCA. Potential AED use was significantly improved with a spatiotemporal optimization model guiding deployment.
Keywords: automated external defibrillator, cardiac arrest, emergency cardiac care, resuscitation
Out-of-hospital cardiac arrest (OHCA) represents a significant public health issue, associated with an estimated 400,000 deaths annually in North America and a <10% survival rate (1,2). Automated external defibrillator (AED) use, coupled with cardiopulmonary resuscitation (CPR), has been shown to increase survival from public-location cardiac arrest (3-6).
Despite the substantial amount of financial resources committed to public access defibrillation (PAD) programs, AED usage in public-location OHCA cases remains low (7-9). There are many potential barriers to bystander AED use including legal liability, awareness, training, technological limitations, and psychological factors (10-12). Another major barrier is the limited availability of AEDs due to building access (11,13-15).
The majority of the research in and guidelines for AED deployment focus on spatial factors with respect to cardiac arrest risk and AED availability. Studies have evaluated cardiac arrest risk by location type (5,16-23) or optimized deployment of AEDs geographically (24,25), without considering temporal factors. In fact, the well-known American Heart Association guidelines for AED placement have suggested placing an AED where there has been a cardiac arrest every 2 years and, more recently, “in public locations where there is a relatively high likelihood of witnessed cardiac arrest” (26,27). The European Resuscitation Council guidelines are similar (28). AED deployment approaches that only consider spatial factors implicitly assume that AEDs and public locations housing AEDs are available and accessible 24 h a day.
Although cardiac arrest incidence and survival vary substantially by time of day and day of week (29,30), temporal access has largely been ignored in the literature, with one notable exception (13). In this paper, we present the first mathematical optimization approach for AED deployment that considers both spatial and temporal accessibility. We hypothesize that: 1) OHCA coverage by existing AEDs is significantly overestimated when temporal accessibility is not considered; and 2) optimizing deployment of prospective AEDs, accounting for both spatial and temporal accessibility, can reverse coverage loss and generate a statistically significant increase in OHCA coverage over an approach that only considers spatial accessibility.
METHODS
Toronto has a population of approximately 2.8 million people in an area of approximately 630.18 km2. A single Emergency Medical Service (EMS) primarily serves the city; however, neighboring EMS services respond to emergency events if they are close in proximity. Multiple EMS units and the fire department often respond to a single emergency event as Toronto has a tiered response system.
STUDY DESIGN AND DATA SOURCES
This was a retrospective population-based cohort study using data from the Toronto Regional RescuNET cardiac arrest database; Rescu Epistry is compliant with the Resuscitation Outcomes Consortium (ROC) Epistry-Cardiac Arrest and based on the Strategies for Post Arrest Care methodologies described elsewhere (31,32).
We included all public-location, atraumatic OHCA episodes in the city of Toronto from January 2006 to August 2014; information for each OHCA entry included demographic characteristics, circumstance of arrest, characteristics of care, and survival outcomes. Public locations included public buildings, places of recreation, industrial facilities, and outdoor public spaces, but excluded hospitals and nursing homes.
A list of registered AEDs was obtained from Toronto EMS as of March 2015. AED registration in Toronto is voluntary but strongly encouraged. The AED dataset contained 912 publicly and privately owned (included with owner consent) AEDs, located at 737 unique addresses. Each entry included the address and location type. Most entries included the hours of operations. Missing information was completed by online search, phone, or in-person visit (Online Appendix).
A dataset of candidate locations for AED placement was collected from June 2014 to January 2015, comprising 4,898 businesses and public points of interest. For each location, we obtained the address and, if available, hours of operation. Data collection was carried out online, by phone, or by in-person visit.
STATISTICAL ANALYSIS
Two separate analyses were conducted.
Analysis 1: Coverage loss of registered AEDs factoring in temporal availability
We first calculated assumed 24/7 coverage: an OHCA is considered covered if it occurred within 100 meters (25,26) of an AED regardless of the AED’s availability. Second, we calculated actual coverage: an OHCA is considered covered if it occurred both within 100 meters of an AED and when the AED was available, based on the location’s hours of operation. Locations were considered temporally inaccessible outside their hours of operation. We chose a coverage radius of 100 meters based on an estimate of the maximum round-trip distance a bystander can transport an AED within 3 minutes (26,33). Finally, we calculated relative coverage loss: assumed 24/7 coverage minus actual coverage all divided by assumed 24/7 coverage. Coverage loss was further analyzed by different times of day (daytime: 8:00 AM to 3:59 PM; evening: 4:00 PM to 11:59 PM, night: 12:00 AM to 7:59 AM), days of the week (weekday/weekend), geographic areas (downtown/not downtown), and specific location types. We computed a 95% confidence interval (CI) for the relative coverage loss using a paired proportions approach plus an error propagation step to convert absolute to relative coverage loss (34,35). We also used a chi-square test to test for statistically significant differences in coverage loss when compared across disjoint and unpaired categories (time of day, geography, and day of week) of OHCAs, with a 2-tailed value of p < 0.05 being significant.
Analysis 2: Coverage gain of AED locations from a spatiotemporal optimization model
We developed a novel spatiotemporal optimization model for AED placement by augmenting a previous spatial-only optimization model developed by our group (25) to account for temporal information of both OHCA cases and candidate AED locations (Online Appendix). Employing a user-defined number of locations (N), our model chooses the best locations to place AEDs to maximize OHCA actual coverage by examining historical OHCA data.
The spatiotemporal model and spatial-only model were evaluated on the improvement of actual coverage above a baseline provided by the existing registered AED network in the city. We used 10-fold cross-validation to compare the theoretical performance of the spatiotemporal model and spatial-only model in terms of actual coverage on historical OHCA data as follows. The OHCAs that were not already covered by the registered AEDs were randomly divided into 10 disjoint sets of equal sizes, which served as the testing sets for each fold. In each fold, the remaining 90% of the OHCAs comprised the training set; note that in each fold, the training and testing sets are completely disjoint. Additionally, the testing sets are disjoint across the folds (i.e., out-of-sample). The training set was used as input to the optimization models to determine the N optimal AED locations. The actual coverage of the selected AED locations was assessed using the testing set OHCAs and then summed over the 10 folds. The totals over the 10 folds were reported for the analysis. By using the testing set OHCAs for the final evaluation of actual coverage, our reported results are out-of-sample. The optimization models were run for each fold increasing by 50 (for N = 50, 100, …, 400).
For each N, we calculated relative coverage gain: actual coverage from spatiotemporal model minus actual coverage from a spatial-only model all divided by actual coverage from the spatial-only model. Overall coverage gain was calculated as the weighted mean of the coverage gain for each N, weighted by the actual coverage values from the spatial-only model. We computed 95% CIs for the overall coverage gain and the coverage gain split by time of day, geography, and day of week (36). Significance in the actual coverage differences was determined using McNemar’s test for each N with a 2-tailed value of p < 0.05 considered significant.
RESULTS
A total of 25,707 nontraumatic OHCAs occurred in Toronto from January 2006 to August 2014. Of these, 2,440 cases occurred in a public setting (Table 1). Of the 25,707 OHCAs, 942 (3.7%) survived to discharge and, of these, 361 occurred in a public setting, corresponding to a survival rate among public OHCAs of 14.8%. Differences in rates of witnessed by bystander (p < 0.001), received bystander CPR (p = 0.001), shockable (p < 0.001), and survival (p = 0.04) were significant across the 3 times of day, but not the difference in bystander-applied AED (p = 0.17). Table 2 shows the breakdown of the 2,440 included public OHCAs by time of day, day of week, and geography. The majority of all OHCAs occurred during the evening, night, and weekends (61.0%). Table 3 shows identical breakdowns for bystander-applied AED. The difference in bystander-applied AED between outside downtown during weekends (6.2%) and downtown during weekdays (11.2%) was statistically significant (p = 0.01).
TABLE 1.
Characteristics of Public Cardiac Arrests
| Characteristic† | Cardiac Arrests
|
|||
|---|---|---|---|---|
| Total (N = 2,440) | Daytime* (n = 1,252) | Evening* (n = 840) | Night* (n = 348) | |
| Age, yrs | 59.0 ± 17.5 | 60.3 ± 17.9 | 58.9 ± 16.8 | 54.6 ± 16.9 |
| Male | 58.9 ± 16.7 | 60.1 ± 17.2 | 58.7 ± 16.1 | 55.1 ± 15.7 |
| Female | 59.4 ± 20.6 | 61.1 ± 21.0 | 60.3 ± 19.5 | 52.6 ± 20.7 |
| Male | 1,979 (81.1) | 1021 (81.5) | 686 (81.7) | 272 (78.2) |
| Witnessed by bystander | 1,142 (46.8) | 590 (47.1) | 446 (53.1) | 106 (30.5) |
| Received bystander CPR | 1,019 (41.8) | 533 (42.6) | 371 (44.2) | 115 (33.0) |
| Bystander-applied AED | 191 (7.8) | 96 (7.7) | 75 (8.9) | 20 (5.8) |
| Ambulance response interval, mins | 5.88 (4.68-7.37) | 5.75 (4.60-7.20) | 5.82 (4.72-7.35) | 6.45 (5.17-7.75) |
| Initial cardiac rhythm | ||||
| Shockable‡ | 868 (35.6) | 465 (37.1) | 327 (38.9) | 76 (21.8) |
| Not shockable‡ | 1,504 (61.6) | 747 (59.7) | 494 (58.8) | 263 (75.6) |
| Survival to discharge | 361 (14.8) | 196 (15.7) | 129 (15.4) | 36 (10.3) |
Values are mean ± SD, n (%), or median (interquartile range).
Time periods were defined as daytime, 8:00 AM-3:59 PM; evening, 4:00 PM-11:59 PM; and night, 12:00 AM-7:59 AM.
Number missing from total: age (79), sex (2), witnessed by bystander (18), received bystander CPR (2), bystander-applied AED (46), arrival interval (2), initial cardiac rhythm (68), and survival (26).
Shockable includes: ventricular fibrillation, ventricular tachycardia and patients listed as shockable; not shockable includes asystole, pulseless electrical activity, patients listed as not shockable, and patients whose initial rhythm was not obtained as resuscitation was stopped before rhythm analysis by protocol due to obvious signs of death.
AED = automated external defibrillator; CPR = cardiopulmonary resuscitation.
TABLE 2.
Public OHCAs
| Public OHCAs
|
|||||
|---|---|---|---|---|---|
| Weekday | Weekend | ||||
|
| |||||
| Time of Day* | Downtown | Outside Downtown | Downtown | Outside Downtown | Total |
| Daytime | 173 (7.1) | 778 (31.9) | 57 (2.3) | 244 (10.0) | 1,252 (51.3) |
| Evening | 111 (4.5) | 480 (19.7) | 46 (1.9) | 203 (8.3) | 840 (34.4) |
| Night | 54 (2.2) | 182 (7.5) | 28 (1.1) | 84 (3.4) | 348 (14.3) |
|
| |||||
| Total | 338 (13.9) | 1,440 (59.0) | 131 (5.4) | 531 (21.8) | 2,440 (100.0) |
TABLE 3.
Bystander-applied AED Use on Public OHCAs
| Bystander-applied AED
|
|||||
|---|---|---|---|---|---|
| Weekday | Weekend | ||||
|
| |||||
| Time of Day* | Downtown | Outside Downtown | Downtown | Outside Downtown | Total |
| Daytime | 24 (13.9) | 51 (6.6) | 6 (10.5) | 15 (6.1) | 96 (7.7) |
| Evening | 10(9.0) | 43 (9.0) | 5 (10.9) | 17 (8.4) | 75 (8.9) |
| Night | 4 (7.4) | 12 (6.6) | 3 (10.7) | 1 (1.2) | 20 (5.7) |
|
| |||||
| Total | 38 (11.2) | 106 (7.4) | 14 (10.7) | 33 (6.2) | 191 (7.8) |
Of the 737 AED locations, 542 (73.5%) were not open 24 h a day and 211 (28.6%) were closed on weekends. Figure 1 shows the proportion of time that registered AEDs are available by time of day and day of week.
FIGURE 1. Registered AED Availability.
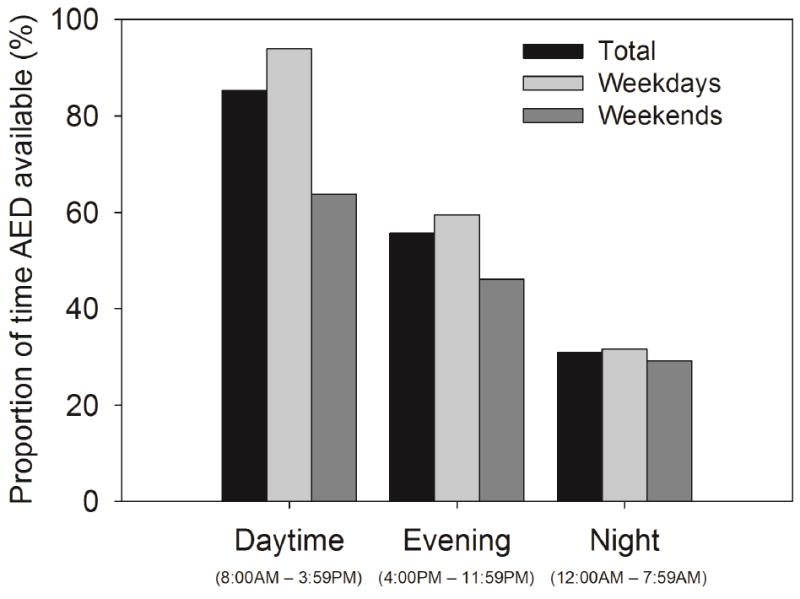
Automated external defibrillator (AED) availability varied by time of day.
Analysis 1: Coverage loss of registered AEDs factoring in temporal availability
Table 4 summarizes the coverage loss statistics. Out of the 2,440 included OHCAs, 451 were covered under assumed 24/7 coverage while 354 were covered under actual coverage, resulting in a relative coverage loss of 21.5% (95% CI: 16.9% to 26.1%). Coverage loss during the evening, night, and weekends was 31.6%, which is when the majority of all OHCAs occurred (Table 2).
TABLE 4.
OHCA Coverage Loss of Registered AEDs
| OHCAs Covered
|
|||||
|---|---|---|---|---|---|
| Total (N = 2,440) | Daytime* (n = 1,252) | Evening* (n = 840) | Night* (n = 348) | ||
| Total (N = 2,440) | Assumed 24/7 coverage | 451 | 221 | 168 | 62 |
| Actual coverage | 354 | 202 | 120 | 32 | |
| Coverage loss (%) | 21.5 | 8.6 | 28.6 | 48.4 | |
|
| |||||
| Weekdays (n = 1,778) | Assumed 24/7 coverage | 342 | 176 | 122 | 44 |
| Actual coverage | 279 | 166 | 90 | 23 | |
| Coverage loss (%) | 18.4 | 5.7 | 26.2 | 47.7 | |
|
| |||||
| Weekends (n = 662) | Assumed 24/7 coverage | 109 | 45 | 46 | 18 |
| Actual coverage | 75 | 36 | 30 | 9 | |
| Coverage loss (%) | 31.2 | 20.0 | 34.8 | 50.0 | |
|
| |||||
| Downtown (n = 469) | Assumed 24/7 coverage | 158 | 74 | 59 | 25 |
| Actual coverage | 130 | 67 | 47 | 16 | |
| Coverage loss (%) | 17.7 | 9.5 | 20.3 | 36.0 | |
|
| |||||
| Outside Downtown (n = 1,971) | Assumed 24/7 coverage | 293 | 147 | 109 | 37 |
| Actual coverage | 224 | 135 | 73 | 16 | |
| Coverage loss (%) | 23.6 | 8.2 | 33.0 | 56.8 | |
|
| |||||
| Weekday | |||||
|
| |||||
| Downtown (n = 338) | Assumed 24/7 coverage | 116 | 57 | 40 | 19 |
| Actual coverage | 96 | 53 | 32 | 11 | |
| Coverage loss (%) | 17.2 | 7.0 | 20.0 | 42.1 | |
|
| |||||
| Outside Downtown (n = 1,440) | Assumed 24/7 coverage | 226 | 119 | 82 | 25 |
| Actual coverage | 183 | 113 | 58 | 12 | |
| Coverage loss (%) | 19.0 | 5.0 | 29.3 | 52.0 | |
|
| |||||
| Weekend | |||||
|
| |||||
| Downtown (n = 131) | Assumed 24/7 coverage | 42 | 17 | 19 | 6 |
| Actual coverage | 34 | 14 | 15 | 5 | |
| Coverage loss (%) | 19.1 | 17.7 | 21.1 | 16.7 | |
|
| |||||
| Outside Downtown (n = 531) | Assumed 24/7 coverage | 67 | 28 | 27 | 12 |
| Actual coverage | 41 | 22 | 15 | 4 | |
| Coverage loss (%) | 38.8 | 21.4 | 44.4 | 66.7 | |
As defined in Table 1.
The differences between coverage loss during daytime, evening, and night were significant (p < 0.001). The differences remained significant when considering only weekdays (p < 0.001), downtown (p = 0.04), and outside downtown (p < 0.001), but not weekends (p = 0.22). The difference in coverage loss between weekdays (18.4%) and weekends (31.2%) was significant (p = 0.04), but not between downtown (17.7%) and outside downtown (23.6%) (p = 0.30).
Comparable coverage losses were observed in downtown during weekdays (17.2%), downtown during weekends (19.1%), and outside downtown during weekdays (19.0%). In comparison, the coverage loss was more than double outside downtown during weekends (38.8%); these differences were significant (p = 0.04).
Table 5 summarizes the coverage loss experienced by registered AEDs categorized by their respective location types. Among location types with the most deployed AEDs, the largest coverage losses were observed at schools (39.7%), industrial facilities (39.3%), recreation/sports facilities (37.1%), and offices (35.7%). These 4 location types accounted for 63.9% of AED locations. Transportation facilities experienced no coverage loss while having the largest number of covered OHCAs.
TABLE 5.
OHCA Coverage Loss of Registered AEDs by Location Type
| Location Type | Number of Locations with an AED | OHCAs Covered | Coverage Loss | |
|---|---|---|---|---|
| Assumed 24/7 Coverage | Actual Coverage | |||
| School | 190 (25.8) | 68 | 41 | 39.7% |
| Recreation/sports facility | 165 (22.4) | 89 | 56 | 37.1% |
| Transportation facility | 93 (12.6) | 144 | 144 | 0.0% |
| Industrial facility | 62 (8.4) | 28 | 17 | 39.3% |
| Office | 54 (7.3) | 56 | 36 | 35.7% |
| Outdoor seasonal facility | 39 (5.3) | 8 | 6 | 25.0% |
| Law enforcement agency | 33 (4.5) | 56 | 39 | 30.4% |
| Library | 25 (3.4) | 20 | 14 | 30.0% |
| Office building | 16 (2.2) | 43 | 37 | 14.0% |
| Medical facility | 15 (2.0) | 11 | 9 | 18.2% |
| Residences - condominium | 13 (1.8) | 3 | 3 | 0.0% |
| Emergency services | 9 (1.2) | 0 | 0 | 0.0% |
| Residence – long-term care or homeless shelters | 6 (0.8) | 14 | 14 | 0.0% |
| Church | 4 (0.5) | 1 | 0 | 100.0% |
| Community hall | 4 (0.5) | 2 | 2 | 0.0% |
| Convention facility | 3 (0.4) | 4 | 4 | 0.0% |
| Entertainment facility | 2 (0.3) | 2 | 1 | 50.0% |
| Shopping center | 2 (0.3) | 5 | 2 | 60.0% |
| Hotel | 1 (0.1) | 1 | 1 | 0.0% |
| Zoo | 1 (0.1) | 0 | 0 | 0.0% |
Analysis 2: Coverage gain of AED locations from a spatiotemporal optimization model
After the 354 OHCAs covered by the registered AEDs were removed, 2,086 remained for the 10-fold cross-validation optimization analysis.
The overall coverage gain (percent gain in actual coverage) from AED locations determined by the spatiotemporal model over the spatial-only model was 25.3% (95% CI: 22.9% to 27.6%) (Figure 2). As shown in Figure 3, the overall coverage gain was statistically significant for all N (p < 0.002 for all N). Results from Figure 2 are further broken down for all N by time of day, day of week, and geography (Online Figures 1 through 7).
FIGURE 2. OHCA Coverage Gain with Spatiotemporal Model.
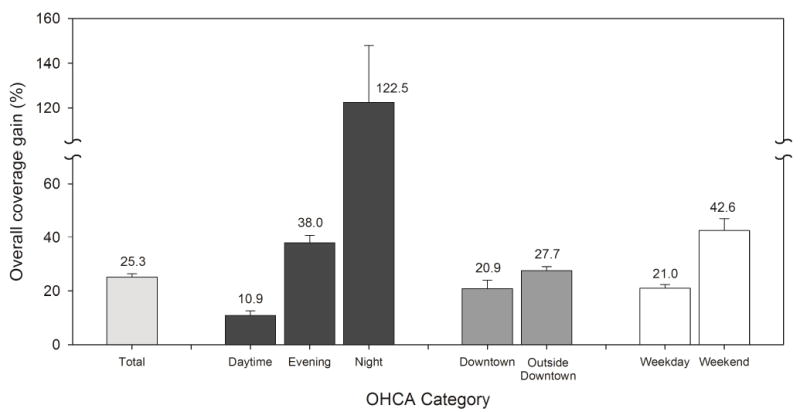
Overall coverage gain in actual coverage of testing set out-of-hospital cardiac arrests (OHCA) by the spatiotemporal model was statistically significant for all categories (p < 0.05) over the spatial-only model.
FIGURE 3. Comparing Spatiotemporal and Spatial-only Model OHCA Coverage.
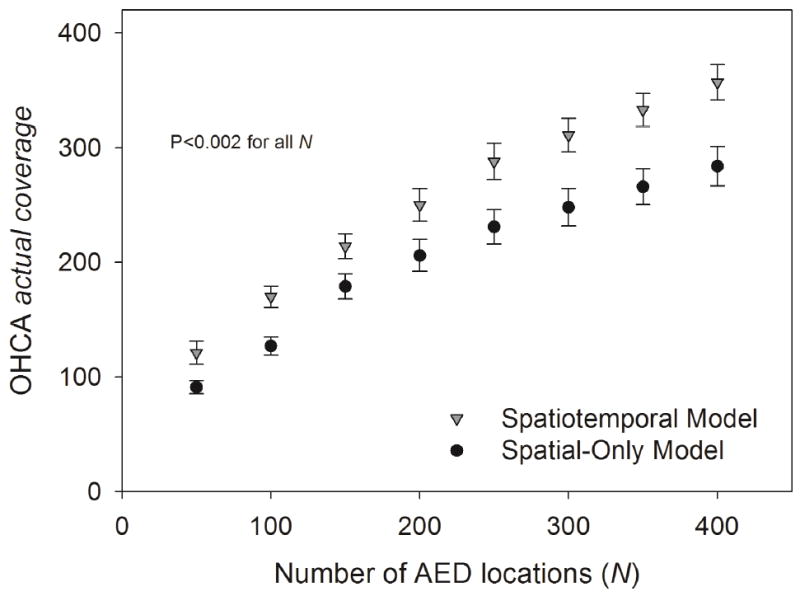
The difference in actual coverage of testing set OHCAs by prospective AED locations determined by the spatiotemporal and spatial-only models was statistically significant for all N (p < 0.002). Abbreviations as in Figures 1 and 2.
An equivalent interpretation of the 25.3% overall coverage gain is that the spatiotemporal model required 32.3% fewer AEDs than the spatial-only model to cover the same number of OHCAs (Online Appendix).
DISCUSSION
The 2 primary, synergistic findings presented in this paper were: 1) a significant proportion of OHCAs occur close to a public AED that is inaccessible at the time of the arrest; and 2) a mathematical model that explicitly accounts for both spatial and temporal accessibility when proposing prospective public AED locations has the potential to significantly increase the likelihood of having an accessible AED nearby during an OHCA event.
Analysis 1: Registered AEDs
A significant loss in OHCA coverage by public AEDs due to limited temporal access was observed across all times of day. The largest loss occurred at night (Central Illustration), corresponding to the time period with the lowest percentage of OHCA cases that were witnessed by a bystander, received bystander CPR/AED, and survived to discharge. Although coverage loss was significantly different across the 3 times of day, the proportion of cases that received bystander AED was not. It is possible that nighttime OHCAs occurred closer to an available AED or that responding bystanders at night were more willing to apply an AED. The latter possibility highlights the potential for improving survival further by improving AED accessibility at night.
CENTRAL ILLUSTRATION. Optimizing Spatiotemporal AED Access: Time Point Comparisons of Registered AEDs.
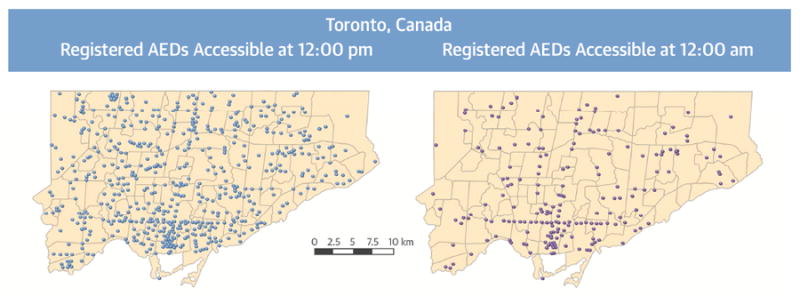
Of a total of 737 registered automated external defibrillators (AED) in Toronto, 95.9% (707 of 737 AEDs) were available at 12 PM and 30.9% (228 of 737 AEDs) were available at 12 AM. The AEDs included in these maps were available at least 5 days of the week at their respective examined times. Potential AED use was significantly improved with a spatiotemporal optimization model guiding deployment, overcoming decreased accessibility in the evening and night.
We further examined our results by geography (downtown/not downtown) and day of week (weekday/weekend). We noted a significant difference in bystander-applied AED between outside downtown during weekends and downtown during weekdays (Table 3). Thus, when considering the subgroups of day of week and geography, the highest bystander-applied AED proportion coincided with the lowest coverage loss (downtown during weekdays), while the lowest bystander-applied AED proportion coincided with the highest coverage loss (outside downtown during weekends). These results suggest a potential correlation between AED availability and usage.
Additionally, coverage loss in downtown Toronto was similar during weekdays and weekends, unlike the coverage loss outside downtown, which was much greater on weekends. This observation suggests that temporal AED accessibility did not decrease as much during the weekend in downtown as it did outside downtown. Forty years ago, the city adopted a planning principle focused on balancing residential and commercial development in downtown. The doubling of the downtown population since the mid-1970s has likely played a role in encouraging downtown businesses serving local residents to maintain robust opening hours, mitigating the weekend coverage loss.
A recent study examined coverage loss due to temporal AED accessibility in Copenhagen, Denmark (13), with a similar significant coverage loss overall as seen in Toronto: 33.5% in Copenhagen and 21.5% in Toronto. Regarding the difference, only 9.1% of AED locations in Copenhagen were open 24 h a day versus 26.5% in Toronto. Certain location types had similar coverage losses including schools (39.7% in Toronto vs. 40.8% in Copenhagen) and transportation facilities (no coverage loss in either). Offices had a larger coverage loss in Copenhagen than Toronto, whereas sports/recreation facilities had a smaller coverage loss. A possible explanation for this inversion is a difference in lifestyle and culture: according to an international work-life balance index, assessing 11 topics of well-being, ranked Denmark first out of 38 countries while Canada ranked 24th (37). Since Toronto and Copenhagen have similar OHCA risk at sports/recreation facilities (16,21), the difference in coverage loss might be partially explained by comparatively longer opening hours for offices and shorter opening hours for sports/recreation facilities in Toronto. Overall, these 2 studies suggested that coverage loss due to temporal factors is likely a universal problem, though it may vary by location type within a city and from city to city for the same location type.
Analysis 2: Optimization
Our spatiotemporal model represented 1 possible method to combat the effects of limited temporal accessibility without compromising spatial access when optimizing AED locations. The overall coverage gain demonstrated by our spatiotemporal model when locating prospective AEDs almost exactly offset the coverage loss experienced by the existing registered AED network. Moreover, the coverage gain remained steady as more AEDs were placed (Figure 3), suggesting that the improvement in OHCA coverage is sustainable as the AED network grows, and is not due to the addition of more AEDs but rather to the accounting for temporal accessibility. The greatest coverage gain occurred at night, which is also the time of day when Toronto’s existing AED network experienced the greatest loss and when survival was lowest.
Holding the number of AED locations constant, the spatiotemporal model’s 25.3% coverage gain was equivalent to a 32.3% decrease in the number of AED locations required to achieve the same coverage as its spatial-only counterpart. This equivalence provided 2 different ways to measure the value of temporal information when optimizing AED locations: in terms of improved potential for AED use given constant system resources or lower cost of system implementation/upkeep for the same coverage level. A similar “trade-off curve” between number of deployed AEDs and AED radius was previously observed (24).
The spatiotemporal model can be used as a decision-support tool for stakeholders involved in the strategic placement of public AEDs, including EMS, urban planning departments, or foundations that fund public AEDs. Evaluating AED deployment policies, such as blanket coverage of certain location types, can easily be done. A user may vary the number of prospective AED locations considered (e.g., based on a funding limit) to examine the potential impact on OHCA coverage. Because the model considers both existing AED locations and future AED placements simultaneously, potential redundancies or holes in coverage can be minimized. The model may also serve as an assistive tool for AED relocation by ignoring the existing AEDs when identifying optimal AED locations. While the model uses city-specific information as inputs, it is a general model and translatable to any city. Its practical applicability elsewhere will depend on data availability in the target city. Furthermore, the model is suitable for both small-scale (e.g., neighborhoods, university campuses) as well as large-scale (e.g., city-wide) deployments. Additional applications could include integration with assistive technologies, such as mobile apps or software pertaining to AED placement.
STUDY LIMITATIONS
A tacit assumption is that the historical distribution of OHCAs is representative of the future. Some justification has been provided in the literature already (38) and a recent study in progress provides additional evidence for Toronto that the distribution is stable over time (39). Additionally, we demonstrated that our spatiotemporal model provides coverage gain even with variability in OHCA occurrences, which was captured via out-of-sample disjoint testing sets in the 10-fold cross-validation.
AED registration is voluntary in the city of Toronto; thus, our list of registered AEDs likely ded not include all AEDs in the city. However, we believe this to be a minor limitation in our analysis since it is unlikely a bystander would be able to find and use an unregistered AED in an emergency. Most unregistered AEDs are privately owned and sometimes solely for internal use, and would not be relevant in this study. Also, our numerical results focus on the change in coverage, not the magnitude of coverage, so missing AEDs would likely have minimal impact.
Coverage provides a convenient quantitative measure for analysis, but ultimately does not equal survival. While coverage and survival are likely positively correlated, coverage is a proxy for usage at best. There has been some effort to relate coverage to AED usage and survival (40) but additional study is required. Coverage gains due to spatiotemporal optimization, all else being equal, should eventually translate to an increased likelihood of an AED being found and applied in the future.
We used hours of operation to measure temporal availability, but other contributing factors to availability exist beyond hours of operation. For example, employee breaks and tardiness might reduce AED accessibility. Additionally, opening hours may vary slightly by season; our analysis used a single snapshot of the hours to represent availability throughout the year.
Our coverage definition did not include the effects of multiple AEDs placed in 1 location or the advantages of closer proximity to the AED within 100 meters. The latter issue has been addressed in another study (40). AED use and coverage may be higher in these cases as bystanders may be able to locate an AED more rapidly. Doors, walls, and multiple floors were not explicitly modeled. Our spatiotemporal model output specific locations for prospective AED deployment primarily for the purpose of pinpointing temporally compromised OHCA hotspots that may be addressed with AEDs in nearby, temporally advantaged locations. The model should not be seen as a prescriptive approach to determining specific buildings in which AEDs should be placed because factors like security, presence of a trained response team, signage, and hours of operation should all be considered in actual deployment decisions. In cities where AED placement decisions are decentralized and most of the suitable locations are private, addressing temporally compromised OHCA hotspots identified by the model will require substantial public-private partnership.
Accessibility is only 1 piece of the larger puzzle in optimizing public defibrillator use and bystander response in an emergency. For example, bystander witness likelihood limits survival improvement through AED use. Other barriers were noted in the introduction to this paper. There are many synergistic and recent efforts to improve awareness, wayfinding, and EMS integration (41,42).
CONCLUSION
Temporal accessibility of public AEDs is critical to both the measurement of true OHCA coverage and the decision on where to locate AEDs. The likelihood of a nearby AED being inaccessible during an OHCA was significant: 1 in 5 OHCAs occurred near an inaccessible AED. According to our computational results, a significant increase in accessibility may be possible if temporal information is properly integrated in AED location decisions. In Toronto, the coverage gain from spatiotemporal optimization was largest at night, which was when the largest loss was experienced by the existing AED network and when survival was lowest. In other words, the potential for spatiotemporal optimization to reverse the effects of limited temporal accessibility was greatest precisely when the need also was greatest. Current evaluation methods may be incorrectly assessing and, thus, significantly overestimating OHCA coverage. Including temporal information is a needed change in the way AED placement guidelines are currently designed.
Supplementary Material
PERSPECTIVES.
COMPETENCY IN SYSTEMS-BASED PRACTICE
Public defibrillators (AEDs) must be both geographically and temporally accessible to assure optimal availability for victims of out-of-hospital cardiac arrest (OHCA). Incorporating both temporal and spatial data in determination of optimal AED placement could enhance accessibility for victims of OHCA and improve outcomes.
TRANSLATIONAL OUTLOOK
Further investigation is needed to identify other factors that contribute to optimal AED placement.
Acknowledgments
The authors acknowledge the helpful feedback given by audience members at the American Heart Association Scientific Sessions 2015 on an early presentation of this research. We are grateful to Cathy Zhan for help with gathering demographic data associated with the cardiac arrest. The local Epistry data set is derived from source documentation provided by Toronto Regional EMS and Fire services participating in the Resuscitation Outcomes Consortium clinical trials.
Funding Sources: Funded by the ZOLL Foundation (ZOLL Foundation Research Grant). The Resuscitation Outcomes Consortium Epistry study is supported by a cooperative agreement (5U01 HL077863) with the National Heart, Lung, and Blood Institute in partnership with the National Institute of Neurological Disorders and Stroke, Canadian Institutes of Health Research–Institute of Circulatory and Respiratory Health, Defense Research and Development Canada, Heart and Stroke Foundation of Canada, and American Heart Association. Rescu Epistry is funded a centre grant from the Laerdal Foundation, and knowledge translation collaborative grants from Canadian Institutes of Health Research and the Heart and Stroke Foundation of Canada.
ABBREVIATIONS AND ACRONYMS
- AED
automated external defibrillator
- CPR
cardiopulmonary resuscitation
- EMS
emergency medical service
- OHCA
out-of-hospital cardiac arrest
- PAD
public access defibrillation
- ROC
resuscitation outcomes consortium
Footnotes
Publisher's Disclaimer: This is a PDF file of an unedited manuscript that has been accepted for publication. As a service to our customers we are providing this early version of the manuscript. The manuscript will undergo copyediting, typesetting, and review of the resulting proof before it is published in its final citable form. Please note that during the production process errors may be discovered which could affect the content, and all legal disclaimers that apply to the journal pertain.
Disclosures: None.
References
- 1.Mozaffarian D, Benjamin EJ, Go AS, et al. Heart disease and stroke statistics—2016 update: a report from the American Heart Association. Circulation. 2016;133:e38–e360. doi: 10.1161/CIR.0000000000000350. [DOI] [PubMed] [Google Scholar]
- 2.Robertson RM. Sudden Death from Cardiac Arrest – Improving the Odds. N Engl J Med. 2000;343:1259–60. doi: 10.1056/NEJM200010263431709. [DOI] [PubMed] [Google Scholar]
- 3.Weisfeldt ML, Sitlani CM, Ornato JP, et al. Survival after application of automatic external defibrillators before arrival of the emergency medical system: Evaluation in the Resuscitation Outcomes Consortium population of 21 million. J Am Coll Cardiol. 2010;55:1713–20. doi: 10.1016/j.jacc.2009.11.077. [DOI] [PMC free article] [PubMed] [Google Scholar]
- 4.Kitamura T, Iwami T, Kawamura T, Nagao K, Tanaka H, Hiraide A. Nationwide public-access defibrillation in Japan. N Engl J Med. 2010;362:994–1004. doi: 10.1056/NEJMoa0906644. [DOI] [PubMed] [Google Scholar]
- 5.Becker L, Eisenberg M, Fahrenbruch C, Cobb L. Public locations of cardiac arrest: Implications for public access defibrillation. Circulation. 1998;97:2106–9. doi: 10.1161/01.cir.97.21.2106. [DOI] [PubMed] [Google Scholar]
- 6.Hallstrom AP, Ornato JP, Weisfeldt M, et al. Public-access defibrillation and survival after out-of-hospital cardiac arrest. New Engl J Med. 2004;351:637–46. doi: 10.1056/NEJMoa040566. [DOI] [PubMed] [Google Scholar]
- 7.Peberdy MA, Kaye W, Ornato JP, et al. Cardiopulmonary resuscitation of adults in the hospital: a report of 14720 cardiac arrests from the National Registry of Cardiopulmonary Resuscitation. Resuscitation. 2003;58:297–308. doi: 10.1016/s0300-9572(03)00215-6. [DOI] [PubMed] [Google Scholar]
- 8.Berdowski J, Blom MT, Bardai A, Tan HL, Tijssen JG, Koster RW. Impact of onsite or dispatched automated external defibrillator use on survival after out-of-hospital cardiac arrest. Circulation. 2011;124:2225–32. doi: 10.1161/CIRCULATIONAHA.110.015545. [DOI] [PubMed] [Google Scholar]
- 9.McNally B, Robb R, Mehta M, et al. Out-of-hospital cardiac arrest surveillance --- Cardiac Arrest Registry to Enhance Survival (CARES), United States, October 1, 2005--December 31, 2010. MMWR Surveill Summ. 2011;60:1–19. [PubMed] [Google Scholar]
- 10.Jorgenson DB, Skarr T, Russell JK, Snyder DE, Uhrbrock K. AED use in businesses, public facilities and homes by minimally trained first responders. Resuscitation. 2003;59:225–33. doi: 10.1016/s0300-9572(03)00214-4. [DOI] [PubMed] [Google Scholar]
- 11.Caffrey SL, Willoughby PJ, Pepe PE, Becker LB. Public use of automated external defibrillators. New Engl J Med. 2002;347:1242–7. doi: 10.1056/NEJMoa020932. [DOI] [PubMed] [Google Scholar]
- 12.Yeung J, Okamoto D, Soar J, Perkins GD. AED training and its impact on skill acquisition, retention and performance--a systematic review of alternative training methods. Resuscitation. 2011;82:657–64. doi: 10.1016/j.resuscitation.2011.02.035. [DOI] [PubMed] [Google Scholar]
- 13.Hansen CM, Wissenberg M, Weeke P, et al. Automated external defibrillators inaccessible to more than half of nearby cardiac arrests in public locations during evening, nighttime, and weekends. Circulation. 2013;128:2224–31. doi: 10.1161/CIRCULATIONAHA.113.003066. [DOI] [PubMed] [Google Scholar]
- 14.Deakin CD, Shewry E, Gray HH. Public access defibrillation remains out of reach for most victims of out-of-hospital sudden cardiac arrest. Heart. 2014;100:619–23. doi: 10.1136/heartjnl-2013-305030. [DOI] [PubMed] [Google Scholar]
- 15.Leung AC, Asch DA, Lozada KN, et al. Where are lifesaving automated external defibrillators located and how hard is it to find them in a large urban city? Resuscitation. 2013;84:910–4. doi: 10.1016/j.resuscitation.2013.01.010. [DOI] [PMC free article] [PubMed] [Google Scholar]
- 16.Folke F, Lippert FK, Nielsen SL, et al. Location of cardiac arrest in a city center: Strategic placement of automated external defibrillators in public locations. Circulation. 2009;120:510–7. doi: 10.1161/CIRCULATIONAHA.108.843755. [DOI] [PubMed] [Google Scholar]
- 17.Gratton M, Lindholm DJ, Campbell JP. Public-access defibrillation: Where do we place the AEDs? Prehosp Emerg Care. 1999;3:303–5. doi: 10.1080/10903129908958958. [DOI] [PubMed] [Google Scholar]
- 18.Iwami T, Hiraide A, Nakanishi N, et al. Outcome and characteristics of out-of-hospital cardiac arrest according to location of arrest: A report from a large-scale, population-based study in Osaka, Japan. Resuscitation. 2006;69:221–8. doi: 10.1016/j.resuscitation.2005.08.018. [DOI] [PubMed] [Google Scholar]
- 19.Davies CS, Colquhoun MC, Boyle R, Chamberlain DA. A national programme for on-site defibrillation by lay people in selected high risk areas: initial results. Heart. 2005;91:1299–302. doi: 10.1136/hrt.2003.032631. [DOI] [PMC free article] [PubMed] [Google Scholar]
- 20.Huig IC, Boonstra L, Gerritsen PC, Hoeks SE. The availability, condition and employability of automated external defibrillators in large city centres in the Netherlands. Resuscitation. 2014;85:1324–9. doi: 10.1016/j.resuscitation.2014.05.024. [DOI] [PubMed] [Google Scholar]
- 21.Brooks SC, Hsu JH, Tang SK, Jeyakumar R, Chan TC. Determining risk for out-of-hospital cardiac arrest by location type in a Canadian urban setting to guide future public access defibrillator placement. Ann Emerg Med. 2013;61:530–8e2. doi: 10.1016/j.annemergmed.2012.10.037. [DOI] [PubMed] [Google Scholar]
- 22.Valenzuela TD, Roe DJ, Nichol G, Clark LL, Spaite DW, Hardman RG. Outcomes of rapid defibrillation by security officers after cardiac arrest in casinos. New Engl J Med. 2000;343:1206–9. doi: 10.1056/NEJM200010263431701. [DOI] [PubMed] [Google Scholar]
- 23.Page RL, Joglar JA, Kowal RC, et al. Use of automated external defibrillators by a U.S. airline. New Engl J Med. 2000;343:1210–6. doi: 10.1056/NEJM200010263431702. [DOI] [PubMed] [Google Scholar]
- 24.Siddiq AA, Brooks SC, Chan TC. Modeling the impact of public access defibrillator range on public location cardiac arrest coverage. Resuscitation. 2013;84:904–9. doi: 10.1016/j.resuscitation.2012.11.019. [DOI] [PMC free article] [PubMed] [Google Scholar]
- 25.Chan TC, Li H, Lebovic G, et al. Identifying locations for public access defibrillators using mathematical optimization. Circulation. 2013;127:1801–9. doi: 10.1161/CIRCULATIONAHA.113.001953. [DOI] [PubMed] [Google Scholar]
- 26.Aufderheide T, Hazinski MF, Nichol G, et al. Community lay rescuer automated external defibrillation programs: Key state legislative components and implementation strategies: A summary of a decade of experience for healthcare providers, policymakers, legislators, employers, and community leaders from the American Heart Association Emergency Cardiovascular Care Committee, Council on Clinical Cardiology, and Office of State Advocacy. Circulation. 2006;113:1260–70. doi: 10.1161/CIRCULATIONAHA.106.172289. [DOI] [PubMed] [Google Scholar]
- 27.American Heart Association. ECCguidelines.heart.org. American Heart Association, Inc.; 2015. Web-based Integrated Guidelines for Cardiopulmonary Resuscitation and Emergency Cardiovascular Care – Part 5: Adult Basic Life Support and Cardiopulmonary Resuscitation Quality. [Google Scholar]
- 28.Nolan JP, Soar J, Zideman DA, et al. European Resuscitation Council Guidelines for Resuscitation 2010 Section 1. Executive summary. Resuscitation. 2010;81:1219–76. doi: 10.1016/j.resuscitation.2010.08.021. [DOI] [PubMed] [Google Scholar]
- 29.Bagai A, McNally BF, Al-Khatib SM, et al. Temporal differences in out-of-hospital cardiac arrest incidence and survival. Circulation. 2013;128:2595–602. doi: 10.1161/CIRCULATIONAHA.113.004164. [DOI] [PubMed] [Google Scholar]
- 30.Brooks SC, Schmicker RH, Rea TD, et al. Out-of-hospital cardiac arrest frequency and survival: evidence for temporal variability. Resuscitation. 2010;81:175–81. doi: 10.1016/j.resuscitation.2009.10.021. [DOI] [PMC free article] [PubMed] [Google Scholar]
- 31.Morrison LJ, Nichol G, Rea TD, et al. Rationale, development and implementation of the Resuscitation Outcomes Consortium Epistry-Cardiac Arrest. Resuscitation. 2008;78:161–9. doi: 10.1016/j.resuscitation.2008.02.020. [DOI] [PMC free article] [PubMed] [Google Scholar]
- 32.Lin S, Morrison LJ, Brooks SC. Development of a data dictionary for the Strategies for Post Arrest Resuscitation Care (SPARC) network for post cardiac arrest research. Resuscitation. 2011;82:419–22. doi: 10.1016/j.resuscitation.2010.12.006. [DOI] [PubMed] [Google Scholar]
- 33.Gundry JW, Comess KA, DeRook FA, Jorgenson D, Bardy GH. Comparison of Naïve Sixth-Grade Children With Trained Professionals in the Use of an Automated External Defibrillator. Circulation. 1999;100:1703–7. doi: 10.1161/01.cir.100.16.1703. [DOI] [PubMed] [Google Scholar]
- 34.McNemar Q. Note on the sampling error of the difference between correlated proportions or percentages. Psychometrika. 1947;12:153–157. doi: 10.1007/BF02295996. [DOI] [PubMed] [Google Scholar]
- 35.Ku HH. Notes on the use of propagation of error formulas. J Res Natl Bur Stand. 1966;70C:263–73. [Google Scholar]
- 36.Gatz DF, Smith L. The standard error of a weighted mean concentration—I. Bootstrapping vs other methods. Atmos Environ. 1995;29:1185–93. [Google Scholar]
- 37.Work-Life Balance. OECD Better Life Index; [August 31, 2015]. Available at: http://www.oecdbetterlifeindex.org/topics/work-life-balance/ [Google Scholar]
- 38.Sasson C, Keirns CC, Smith D, et al. Small area variations in out-of-hospital cardiac arrest: Does the neighborhood matter? Ann Intern Med. 2010;153:19–22. doi: 10.1059/0003-4819-153-1-201007060-00255. [DOI] [PMC free article] [PubMed] [Google Scholar]
- 39.Demirtaş D, Brooks SC, Morrison LJ, Chan TCY. Spatiotemporal Stability of Public Cardiac Arrests. AHA Resuscitation Science Symposium (ReSS) - Abstract; Orlando, Fla. 2015. [Google Scholar]
- 40.Chan TCY, Demirtas D, Kwon RH. Optimizing the deployment of public access defibrillators. Manage Sci. 2016 Jan 28; Epub before print. [Google Scholar]
- 41.Merchant RM, Asch DA, Hershey JC, et al. A crowdsourcing innovation challenge to locate and map automated external defibrillators. Circ Cardiovasc Qual Outcomes. 2013;6:229–36. doi: 10.1161/CIRCOUTCOMES.113.000140. [DOI] [PubMed] [Google Scholar]
- 42.PulsePoint Foundation. [August 31, 2015];Designed to Put AEDs in Motion. Available at: http://www.pulsepoint.org/pulsepoint-aed/
Associated Data
This section collects any data citations, data availability statements, or supplementary materials included in this article.