Abstract
This study was conducted to evaluate the use of metabolomics for improving our ability to draw correlations between early life exposures and reproductive and/or developmental outcomes. Pregnant CD rats were exposed by gavage daily during gestation to vehicle or to butylbenzyl phthalate (BBP) in vehicle at a level known to induce effects in the offspring and at a level previously not shown to induce effects. Urine was collected for 24 h (on dry ice using all glass metabolism chambers) from dams on gestational day 18 (during exposure) and on post natal day (pnd) 21, and from pnd 25 pups. Traditional phenotypic anchors were measured in pups (between pnd 0 and pnd 26). Metabolomics of urine collected from dams exposed to vehicle or BBP exhibited different patterns for endogenous metabolites. Even three weeks after gestational exposure, metabolic profiles of endogenous compounds in urine could differentiate dams that received the vehicle, low dose, or high dose of BBP. Metabolic profiles could differentiate male from female pups, pups born to dams receiving the vehicle, low or high BBP dose, and pups with observable adverse reproductive effects from pups with no observed effects. Metabolites significant to the separation of dose groups and their relationship with effects measured in the study were mapped to biochemical pathways for determining mechanistic relevance. The application of metabolomics to understanding the mechanistic link between low levels of environmental exposure and disease/dysfunction holds huge promise, because this technology is ideal for the analysis of biological fluids (e.g., urine, serum) in human populations.
INTRODUCTION
Exposures in pregnancy, in utero development and early postnatal rapid development result in physiological changes in metabolism that make them vulnerable to developing adverse effects from exposure to chemicals. Traditional studies of reproductive and developmental toxicity use markers (e.g., organ weights, histopathology, hormone levels, or anogenital distance) that are indicative of disease or dysfunction, and are not typically sensitive at environmentally relevant exposures and thus cannot be used to extrapolate findings from high-dose studies. Methods are needed that can improve our ability to draw mechanistic correlations between life-stage exposures and the development of adverse health outcomes at high-dose exposures, with low dose environmentally relevant exposures and possible adverse outcomes.
The field of developmental and reproductive toxicology is being transformed by the integration of new molecular biology, imaging and genomic technologies. In 2002, several agencies developed the framework to begin the needed investment in scientific endeavors to help establish a systems approach to strengthening the area of developmental and reproductive biology (Mirkes et al., 2003). In the past few years, ground breaking research in genomic analysis for reproductive and developmental toxicology has emerged. These studies (predominantly studies of alterations in gene expression) have demonstrated (1) how specific chemicals influence the highly sensitive processes in early mammalian development (Clausen et al, 2005); (2) how gene expression can help define the shape of the dose-response curve at low doses (Daston and Naciff, 2005); (3) how the effect of estrogen agonists or estrogen antagonists on gene expression relates to the embryonic and fetal development of the rat testis and epididymis (Naciff et al., 2005); (4) how chemicals induce alterations in the expression of genes known to be expressed during development of the craniofacies (Gelineau-van Waes et al., 1999); (5) specific genes that are induced in the embryo following exposure to teratogens (Mikheeva et al., 2004; Kultima et al., 2004); (6) specific genes involved in estrogen-induced organ growth (Moggs et al., 2004; Naciff and Daston 2004) and the development of the uterus and ovary (Daston and Naciff, 2005); and (7) the use of gene ontology and pathway analysis to provide insights into the molecular mechanisms of estrogens (Currie et al., 2005).
Proteomics in reproductive and developmental biology is a rapidly growing area. Early applications of proteomics in reproduction and development included the elucidation of biomarkers in amniotic fluid and maternal serum for intrauterine infection and premature rupture of membranes (Buhimschi et al., 2004; Buhimschi et al., 2005a–c; Gravett et al., 2004; Klein et al., 2005; Nilsson et al., 2004; Ruetschi et al. 2005; Thadikkaran et al., 2005; Vuadens et al., 2003). More recent studies have investigated the proteome of semen (Li et al., 2007), identified semen biomarkers of varying fertility rates (Peddinti et al., 2008), and examined inter-individual variations in the seminal plasma proteome of fertile men (Yamakawa et al., 2007). Studies have been conducted to determine the proteins in common in oocytes and ovarian cumulus cells that may be involved in the communication process for maturation (Memili et al., 2007), to determine biomarkers of preeclampsia by evaluation of amniotic fluid of healthy vs hypertensive, or preeclamptic women (Park et al., 2008), and to study mammalian preimplantation and postimplantation embryonic development (Katz-Jaffe et al., 2005). Proteomics has been included in the study of bisphenol A-induced alterations in the proteome of prenatally exposed mice (Yang et al., 2008).
While genomics and proteomic applications in reproductive and developmental toxicology have rapidly increased in the literature in recent years, studies that investigate changes in the metabolome in the study of reproduction and development are just now beginning to emerge. Metabolomics has been used to distinguish between plasma samples from healthy women and those from women with preeclampsia (Kenny et al. 2005), and to investigate markers for the early detection of epithelial ovarian cancer (Odunsi et al., 2005). Researchers have also demonstrated that metabolomics could be better correlated with the viability of an embryo than using traditional morphology measurements, and with a higher correlation of pregnancy (Vergouw et al., 2008). The use of metabolomics in the study of male fertility is growing, with recent reports that associate alterations in the sperm metabolome with diabetic status (Mallidis et al., 2007). The use of metabolomics in the study of the consequences of environmental stressors in reproduction and development is an open field. Significant metabolic perturbations in the early life stages of Chinook salmon exposed to pesticides have been demonstrated using metabolomics (Viant et. al., 2006); and metabolomics has been used to demonstrate an alteration in the metabolic syndrome of offspring born to pregnant rats on ad libitum feeding or under feed restriction (Desia et al., 2007).
The work presented here was conducted to use metabolomics of maternal and offspring urine to evaluate the impact of prior exposure on the biochemical profiles of offspring exposed in utero to a chemical known to cause endocrine disruption, butylbenzyl phthalate.
METHODS
Study Compound Selection
Phthalate esters are ubiquitous industrial chemicals (Blount et al., 2000). Adult exposures to butylbenzyl phthalate (BBP, CAS No 85-68-7) is estimated at 2 µg/kg/day from foods (the major source), and exposures to infants and children are estimated as up to three-fold higher (Kavlock et al., 2002). Human exposure to BBP in workers have been estimated at 143 and 286 µg/kg body weight per day. The development toxicity LOAEL (lowest observable adverse effect level) in rats is 185 mg/kg per day and the reproductive LOAEL is greater than 500 mg/kg per day (Kavlok et al, 2002). In a CDC (Center for Disease Control) study, urinary concentrations of monobutyl phthalate (a metabolite of both BBP and dibutylphthalate) and monobenzyl phthalate (a metabolite of BBP), were observed in all of the reference population of 289 adults, and higher levels of MBP (ca 47 µg/g creatinine) were observed in women of child-bearing age (Blount et al., 2000). BBP is known to disrupt reproductive development in male rats following in utero exposure to a high oral dose (Nagao et al., 2000), by affecting fetal testosterone biosynthesis in the Leydig cells, and to affect a Leydig cell protein, Insl3, responsible for formation and function of the gubernacular cords to enable descent of the testes to the lower abdominal inguinal ring by birth and into the scrotal sacs by the end of lactation (Wilson et al., 2004). The testosterone decrease is mediated by changes in gene expression regulating synthesis and transport, resulting in retained nipples/areolae (sexuality dimorphic structures), reduced anogenital distance (to a more female value), cryptorchidism (undescended testes, also affected by reduced Insl3), and hypospadias (failure of penile tube to fuse) (Foster, 2006; Liu et al., 2005; Tyl et al., 2004). High doses of phthalates, including BBP, are known to produce the so-called ‘phthalate syndrome’ (Gray et al., 1999, 2000; Parks et al., 1999, 2000; Kavlock et al., 2002).
Study Design and Sample Collection
Timed-pregnant Sprague Dawley rats were obtained from Charles River, Raleigh, NC. Dams arrived on gestation day (gd) 11 and were singly housed in microisolator cages. They were provided food (Purina rodent chow 5002) and water ad libitum. Dams were dosed daily by gavage with BBP from gd 14 through gd 21. Three dams per group were dosed with corn oil vehicle, 25 mg/kg/day BBP, or 750 mg/kg/day BBP dissolved in corn-oil. On gd 18, dams were placed individually in all glass metabolism cages for the 0–6 and 6–24 hour collection of urine, and subsequently returned to microisolator cages. All deliveries occurred within a 24 hour period. The dosing period (from gd 14-gd 19) was selected because it is a period of androgen dependent sex differentiation (Anway et a., 2005), and at the higher dose (750 mg/kg/day), BBP was expected to induce effects on reproduction and development (e.g., reduced anogenital distance, AGD; nipple retention, etc). Including a high dose level that was expected to induce effects in the offspring provides phenotypic anchors for analysis of the metabolomics data at the effect level. Including the low dose level (25 mg/kg/day) that was not expected to induce measureable (observable) reproductive and developmental effects in pups on pnd 26 enabled the evaluation of changes in metabolic profiles that arise due to exposure. Urine was collected from dams, for 24 hours, on GD 18, following 5 days of exposure to BBP, but prior to delivery of pups. Urine was collected from dams again on pnd 21, following weaning. Pup urine was collected, for 24 hours, several days (pnd 25) after weaning.
On pnd 0, the litters that exceeded 10 pups were culled by random selection of males and of females; attempting to have five per sex per litter. All live pups were counted, sexed, weighed and examined grossly at birth (pnd 0), and on pnd 4, 7, 14 and 21. The AGD and pup weights were recorded on pnd 0, pnd 21, and pnd 26 for F1 offspring. The F1 male pups were checked for retained nipples and areolae on the ventrum on pnd 11 (all litters) and again on pnd 13.
The pups were weaned on pnd 21, weighed, eartagged and housed by sex and litter in microisolator cages. On pnd 21, dams were placed into all glass metabolism cages for 24 h for collection of 0–6 and 6–24 h urine. On pnd 25, pups were placed in all glass metabolism cages for the collection of urine. Pups were grouped (up to 3 pups per metabolism cage) by sex, litter and measured effect (such as retained nipples or increased/decreased AGD). Following urine collections, dams and pups were sacrificed on pnd 26 under CO2, blood was drawn by cardiac puncture, they were subjected to a full necropsy, and tissues were retained for potential future analysis. Blood was processed to serum, and urine and serum were stored at −80°C for subsequent analysis.
Hormone Analysis
Hormones were measured using commercially available kits and standard methods performed in this laboratory. Measurements were made for luteinizing hormone (LH) in serum from dams and male and female pups, testosterone (T) in males, and estradiol (E) in females.
Metabolomics
Sample Preparation, data acquisition, and processing
Samples were prepared for NMR analysis by mixing an aliquot (~630 µL) of urine with 70 µL of a solvent buffer solution containing two internal standards (DSS and imidazole) for line shape analysis and spectral assignment and quantitation using the library in NMR Suite 4.6 Professional software (Chenomx, Edmonton, Alberta, Canada). NMR spectra were acquired on a Varian Inova 600 MHz instrument located in the NMR facility at Duke University, Durham, NC. 1H NMR spectra were acquired using the first increment of a NOESY sequence, with a 100 ms mixing time, 1 s relaxation delay, a spectral width of 12 ppm, and 32 transients. The water resonance was suppressed using resonance irradiation during the relaxation delay. All spectra are acquired at 25°C, and the quality of each NMR spectrum was assessed for the level of noise and alignment of identified markers. Spectra were assessed for missing data and underwent quality checks.
NMR data was processed using a traditional binning approach by automated integration (increments of 0.04 ppm) over the spectral window, excluding the region of water suppression, and normalized to the total spectral intensity. NMR data were also processed using NMR Suite 4.6 Professional software, which deconvolutes the entire spectrum based on chemical shift and coupling patterns, and then matches signals to a reference library of approximately 300 low-molecular-weight metabolites. The internal standard (imidazole) was used as the reference for performing the library matching. This software contains an internal library adjustment for increments in chemical shift based on pH variations (Weljie et al., 2006). A concentration determination for each metabolite was made by relative integration of the analyte to the internal standard, where the library of concentrations was developed to account for differences in integral values as related to the relaxation time of the signal (Weljie et al., 2006; Slupsky et al., 2007). This method has some advantages over binning in two major ways. First, small increments in pH can result in portions of metabolite signals aligning with different bins when using the binning approach, while deconvolution circumvents this problem. A second advantage is that this analysis depends on the concentration of each metabolite, while the binning approach results in situations where each metabolite has multiple signals that fall within separate bins. For subsequent data reduction of the data derived from library matching, the concentration of each metabolite was normalized to total creatinine.
Data Reduction and Visualization
Data captured by NMR (metabolite i.d. and concentration; or bin region and integral value) were transported to SAS for statistical analysis and visualized in Spotfire, or the data were transported to software (Umetrics) for data reduction and visualization using SIMCA-P 11.5. Several approaches were taken to analyze the NMR data to provide the best set of analytes that could distinguish the four study groups (gd18 dams, pnd 21 dams, pnd 26 males, pnd 26 females) based on gender, age, dose, and phenotypic results. In addition, data was combined for the study groups and reduced. Approaches included: analysis of data using all bins (exclusion of water region), analysis of data generated by complete spectral library matching performed via Suite 4.6 Professional software Umetrics, and analysis based on a targeted list of analytes. Data for each of the four study groups, where the study groups are defined as the gd 18 dams, pnd 21 dams, pnd 26 male pups and pnd 26 female pups, were analyzed independently from other study groups. NMR spectra were assessed for the presence of signals derived from the parent compound, BBP, or from metabolites derived from the parent compound. No signals were observed for BBP or derived metabolites in urine collected from dams on pnd 21 or from pups on pnd 26, but were observed in urine collected from dams during the dosing period (gd 18). Thus, when using the binning approach, signals derived from BBP or derived metabolites were excluded from the analysis (which occurred only for gd 18 urine). When using the library matching approach, all signals are matched to those of endogenous compounds, and then assessed to ensure that the fit did not also match the parent compound or parent derived metabolites. For analysis with binned data, the integral was normalized to the total integral for each spectrum. For analysis using data from library matching, the concentration of each metabolite was normalized to creatinine. Principal component analysis (PCA) or PCA with partial least squares projection to latent structures (PLSDA) was conducted using SIMCA-P 11.5 for the binned and metabolite data. Loadings and variable importance plots were examined to determine the bins or metabolites that best define the dose groups. Subsequently, PCA using only the bins or analytes selected from the loadings and variable importance plots was conducted to demonstrate that the analysis with the subset of bins or metabolites could provide clear separation of the study and dose groups. Additional analysis included determining the standard difference of each metabolite in BBP dose group compared with the vehicle group (analysis in SAS) with visualization in Spotfire. Metabolites identified as important for the separation of groups based on age, gender, dose or phenotypic anchors were mapped to biochemical pathways.
RESULTS
Phenotypic Results
Phenotypic anchors for reproductive toxicity are summarized in Table 1. DAMS: F0 parental females, on average, exhibited decrease in absolute and relative weights of the uterus plus cervix at the high dose group. There were no maternal findings in the vehicle and low-dose groups. All dams receiving a high dose of BBP during gestation had male pups with extensive reproductive findings documented on pnd 26. Reproductive findings in the low-dose group were observed for some of the male pups in all three litters on pnd 11 or pnd 21, but were less severe than for the high dose group and resolved by pnd 26.
Table 1.
Summary of the reproductive findings for male and female pups born to dams exposed to BBP by gavage from gd 14-gd 21.
Control Group: 17 males: 13 females
|
High Dose (750 mg/kg/day) 6 males
|
Pups: Vehicle Corn oil Group
For the control group, all clinical and gross observations were normal and there were no findings of nipple or areolae retention.
Low Dose Findings
A total of 16 male offspring were evaluated. A total of nine male pups from the three litters had reproductive findings at the low dose. Seven of the 16 male pups had retained areolae on pnd 11 (but not on pnd 26) and two male pups had decreased AGD on pnd 21 (not present in pnd 0 or pnd 26). At the time of necropsy (pnd 26), all male AGD and areolae were normal. There were no findings in the female reproductive tissues for the low-dose pups.
High Dose Findings
At 750 mg/kg per day, there was an increased stillborn index on pnd 0, a reduced survival index for pnd 0–4, and reduced pup body weights/litter during lactation. The sex ratio (% males/litter) was equal across all groups on pnd 0, but was reduced from pnd 4–21 (i.e. male pups preferentially died on pnd 0–4). In the high dose group, all male pups had decreased AGD on pnd 0, which persisted through pnd 26. All male pups had retained areolae, and half of the male pups had retained nipples at pnd 11 or 13. At necropsy (pnd 26), all males in the high-dose group were missing part or all of the epididymis and seminal vesicles. Abnormal or missing prostate (two of six male pups) and abnormal or missing testes (four of six male pups) were also found. One pup also exhibited a cleft phallus, and abnormal or missing vas deferens (three pups) were found in the male pups. No significant findings were present for the F1 female pups born to dams receiving the high-dose of BBP.
Hormones
The measurement of luteinizing hormone (LH) in serum from dams and male and female pups, testosterone (T) in males, and estradiol (E) in females was conducted using traditional approaches in reproductive and development toxicology. For dams, a significant decrease in E occurred 3 weeks after the exposure to a high-dose of BBP, compared with low-dose and vehicle control groups (Table 2). A reverse trend occurred for the female pups, where a significant increase in mean E occurred for the female pups born to dams that had the high BBP exposure, compared with the control group. For both dams and female pups, the average level of LH was increased in high-dose study group compared with the control; however, these values were not statistically significantly different. T levels in serum of male pups on pnd 26 were similar for all dose groups, and were similar between male pups that had adverse reproductive findings and those without adverse reproductive findings. On average, the LH levels in the males in the high-dose group were elevated, but not significantly different, over control or the low-dose group males.
Table 2.
Hormones measured in serum from dams (pnd 21) and pups (pnd 26) following the daily gestational exposure (gd 14–21) of dams to corn oil vehicle, 25/mg/kg/day, or 750 mg/kg/day BBP.
| Dams | Male Pups | Female Pups | ||||
|---|---|---|---|---|---|---|
| Dose Group | Estradiol (pg/mL) Mean ± SD |
Luteinizing Hormone (ng/mL) Mean ± SD |
Testosterone (ng/mL) Mean ± SD |
Luteinizing Hormone (ng/mL) Mean ± SD |
Estradiol (pg/mL) Mean ± SD |
Luteinizing Hormone (ng/mL) Mean ± SD |
| Vehicle Control |
57.4 ± 1.88 | 2.29 ± 0.435 | 0.105 ± 0.084 | 2.71 ± 0.667 | 24.1 ± 1.27 | 4.51 ± 0.896 |
| Low Dose (25 mg BBP/kg/day) |
63.5 ± 5.90 | 2.19 ± 0.050 | 0.120 ± 0.072 | 2.00 ± 0.597 | 26.28 ± 0.548 | 4.68 ± 2.59 |
| Low Dose (Affected Males only) |
0.125 ± 0.075 | 2.02 ± 0.552 | ||||
| Low Dose (Unaffected Males only) |
0.110 ± 0.057 | 1.98 ± 0.750 | ||||
| High dose (750 mg BBP/kg/day) |
37.6 ± 7.96 | 3.88 ± 2.96 | 0.110 ± 0.085 | 7.16 ± 6.37 | 27.5 ± 0.751 | 6.59 ±2.22 |
Visual Assessment of 1H NMR Spectra
Maternal Urine
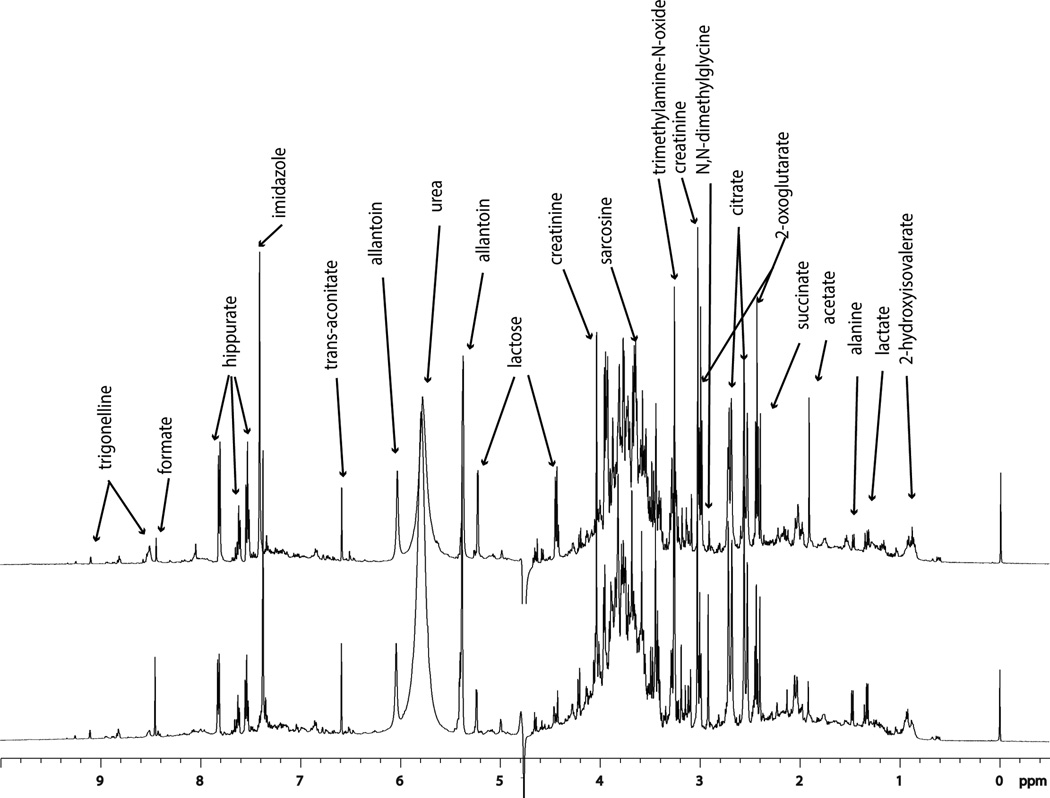
The relative intensity of signals in the NMR spectra of urine from BBP-exposed dams in comparison with signals from vehicle-exposed dams was examined to evaluate quantitative differences in the excretion of endogenous metabolites. Relative quantitative differences were apparent in NMR spectra of endogenous metabolites in gd 18 dam urine from BBP exposed dams (exposed from gd14 to gd 21) compared with urine from the vehicle exposed dams. Likewise, dam urine collected (pnd 21) 3 weeks following the last day of exposure showed relative quantitative differences between the BBP-exposed and vehicle exposed groups (Fig. 1), where the quantitative differences are related to the relative proportion of endogenous metabolites. It was expected that quantitative differences between the vehicle and high-dose BBP-exposed dams would be observed for samples collected on gd 18 (during the time period of exposure), since the high dose was selected at a concentration known to disrupt the endocrine system. Findings of quantitative difference (based on relative signal intensity) between the vehicle and low-dose group supported the hypothesis that low-dose exposure to phthalates also altered the metabolic status of the dam. The investigation for alterations in the relative ratios 3 weeks following exposure cessation supported the hypothesis that BBP exposure had a lasting effect that could be detected by assessment of the biochemical profile.
Figure 1.
1H NMR spectra of 6–24 hour pnd-21 urine from a female rat three weeks following an eight-day gestational exposure (gd 14 to gd 21) to 750 mg/kg/day BBP (bottom trace) or vehicle (top trace). Quantitative differences in the levels of endogenous metabolites are indicated by differences in the relative ratios of signals. Signals for metabolites were matched with the quantitative library of metabolites. Higher concentration metabolite signals are labeled.
Offspring Urine
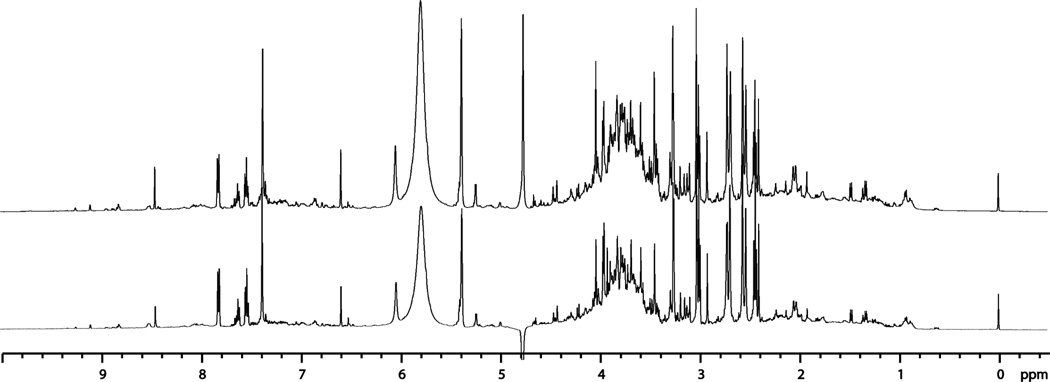
Relative quantitative differences were apparent in NMR spectra of endogenous metabolites in pnd 26 urine from pups born to dams that had a BBP exposure (from gd14 to gd21) in comparison with pups born to dams that had exposure to vehicle alone (Fig. 2). The finding of quantitative differences between the vehicle, low-dose, and high-dose groups for the pups support the hypothesis that in utero exposure to BBP has a lasting impact on the biochemical makeup of the offspring, and demonstrated the utility of NMR based metabolomics for such assessments.
Figure 2.
1H NMR spectra of pnd 26-urine collected from male rat pups that had prior in utero exposure to BBP (bottom trace) or vehicle (corn-oil vehicle top trace) via the dams exposure during gestation. Quantitative differences in the levels of endogenous metabolites are indicated by differences in the relative ratios of signals. Signals for metabolites were matched with the quantitative library of metabolites.
Metabolomics of Maternal Urine
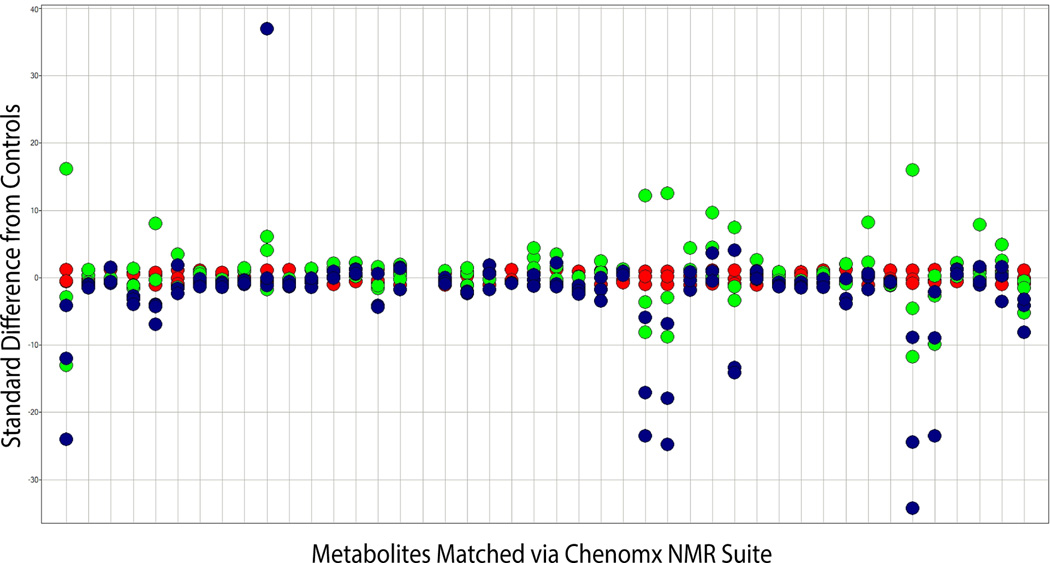
The concentrations of endogenous metabolites were determined using library matching via Professional Suite 4.6 (Chenomx), and data was transported to SAS to determine the standard difference of each metabolite (normalized to creatinine) in each treatment group from the average control group value for that metabolite. This data was then transported to a software package (Spotfire) for visualization of the statistical data, and into Umetrics for multivariate analysis and visualization. As expected based on visualization of the NMR spectra, analysis of dam urine collected on gd 18 (during the time of exposure) showed significant differences (>2.5 standard differences) in the concentrations of many endogenous metabolites for dams that received the high dose of BBP compared with the vehicle group. In addition, the concentrations of endogenous metabolites in gd 18 urine from the dams that received the low-dose of BBP were also significantly different from controls. Even 3 weeks after the gestational exposure (on pnd 21; Fig. 3) had ended, metabolic profiles could be used to differentiate dams that had experienced a gestational low-dose exposure (green) from dams that had a gestational vehicle exposure (red), or dams that had a gestational high-dose exposure (blue).
Figure 3.
Maternal pnd 21 Urine: Standard difference (Y-axis) of specific [metabolite] in pnd 21 urine (6–24 hr) of dams receiving BBP only during pregnancy from mean [metabolite] in pnd 21 urine from vehicle controls. Differences are significant at 2.5 standard deviations from control. Control (red, circle), low dose (green, square), and high dose (blue, triangle).
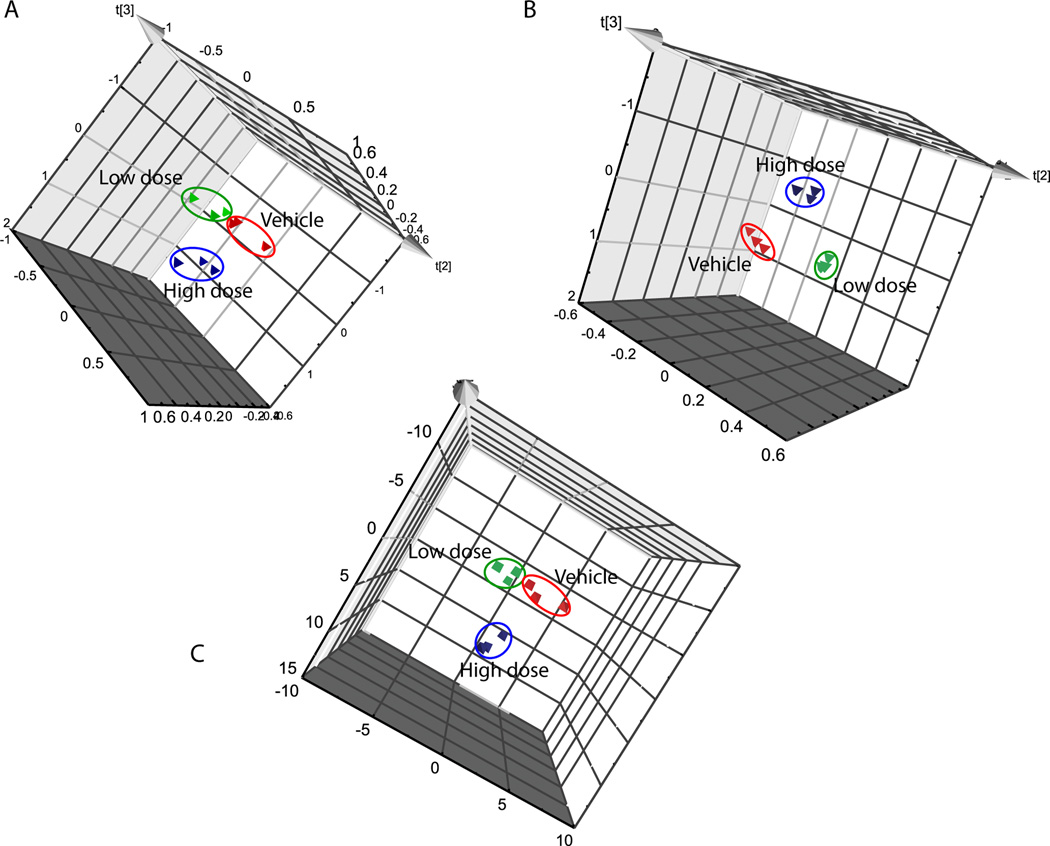
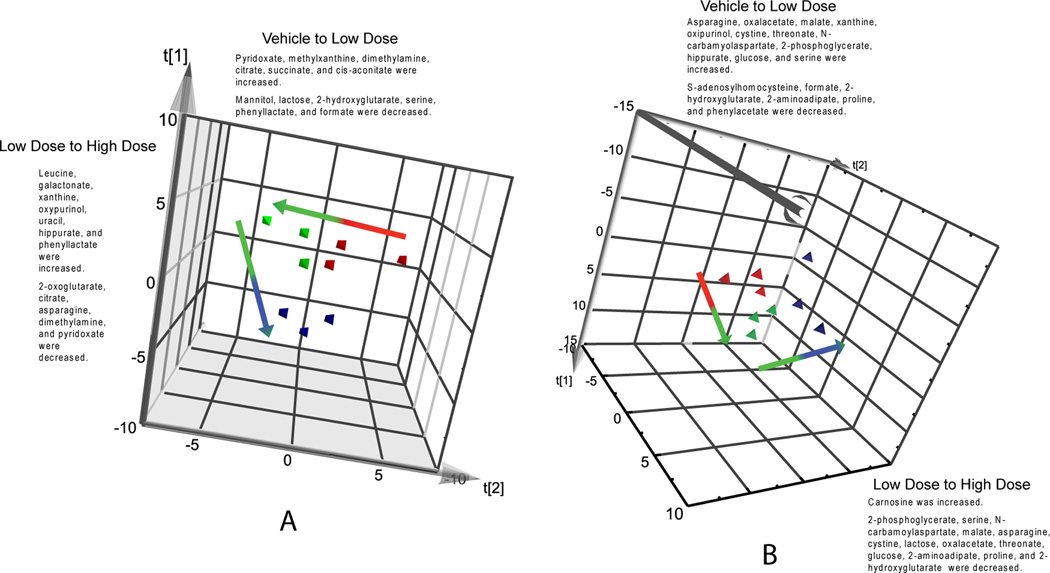
PCA or PLSDA was conducted using binned data normalized to the total intensity for each dam urine spectrum. PCA analysis using all binned data for the gd 18 dams and for the pnd 21 dams showed a good separation of dose groups (note shown). PLSDA was employed and loading and variable importance plots were subsequently used to determine the bins that best define the dose groups. Subsequent PCA using only the bins selected from the loading and variable importance plots did result in clear separation of dose groups for each study group. An example is shown for urine analyzed for the gd18 dams (Fig. 4). The PCA analysis using all bins (Fig. 4A) demonstrates differentiation of dose groups. PLS-DA analysis (Fig. 4B) was used to seperate the dose groups and determine the bins most important for this separation. Subsequent PCA analysis of only the bins selected from the PLS-DA loadings and variable importance plots was then conducted to validate the use of the subset of bins in defining the dose groups (Fig. 4).
Figure 4.
The PCA analysis of gd 18 dam urine using the full set of bin data (4a), with PLS (4b), and using only bin data selected from examination of loadings and variable importance plots (4c). Control (red), low dose (green), and high dose (blue) groups are indicated by the circled regions.
Full library matching using the NMR Suite 4.6 Professional Software provided all metabolites (and their respective concentrations) that demonstrated a match within each of the dam urine spectra. Inspection of loading and variable importance plots from the PLSDA analysis of all data matched within the library enabled the selection of a sub-set of analytes to use in targeted profiling.
Targeted Profiling
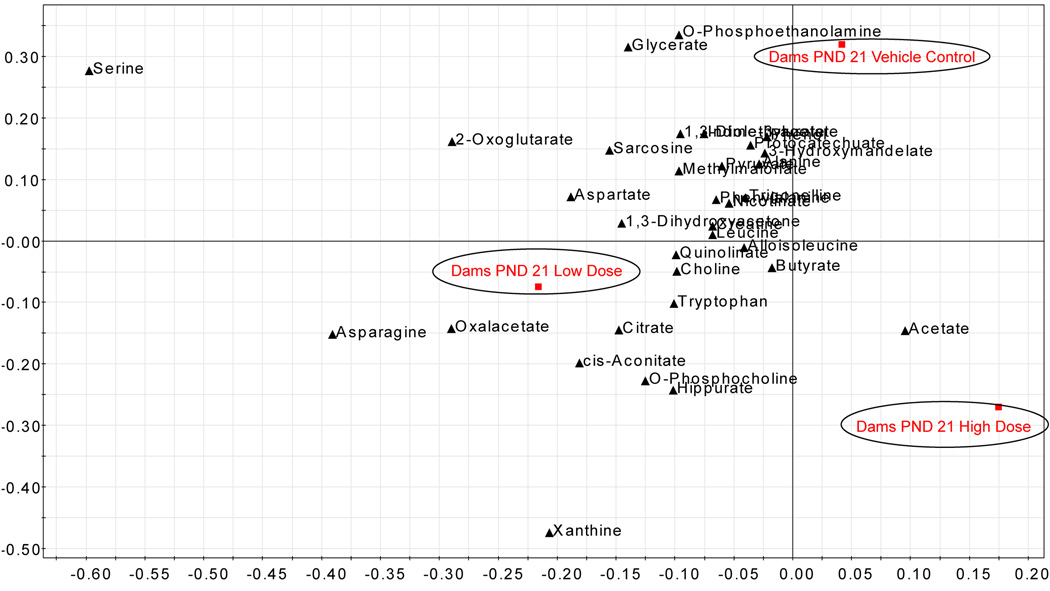
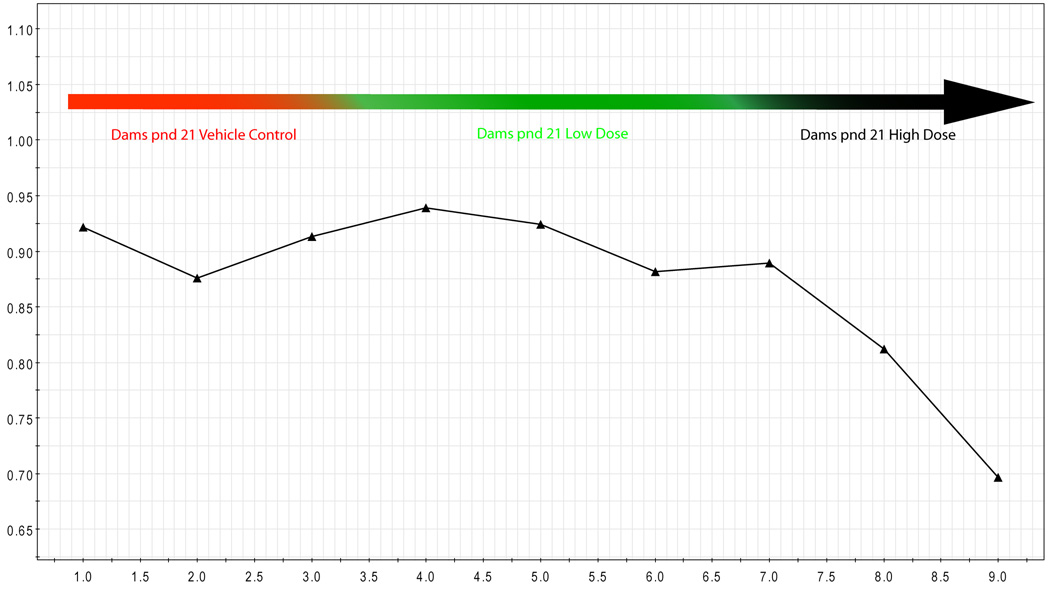
Targeted lists were generated based on results from the statistical analysis and visualization of Spotfire data, and from insepction of loadings plots and variable importance plots that were generated using the bin data and library matched data. The targeted lists were then used for the conduct of PCA/PLS-DA analysis with inspection of loadings and variable importance plots. PCA analysis using the targeted list of analytes generated for gd18 dam urine and pnd21 dam urine are shown in Fig. 5. For gd 18 dams (Fig. 5A) and for pnd 21 dams (Fig. 5B), the multivariate analysis could be used to distinguish the study groups. Loading scatter plots (example shown in Fig. 5C) were used to determine the metbolites that best defined study groups and the concentration of metabolites scaled to creatinine (y-axis) was visualized for each pnd 21 dam (example shown for nicotinate in Fig. 5D) to examine the directionality of change for dams within the study groups.
Figure 5.
Example visualizations shown for the PCA analysis of the targeted list of analytes for gd-18 dam urine (5a) and pnd-21 dam urine (5b). Vehicle (red), low dose (green), and high dose (blue) groups are indicated by the circled regions. 5c) An example loading scatter plot is shown for pnd-21 dam urine, indicating metabolites that are increased or decreased for the respective study groups. 5d) The concentration of metabolites scaled to creatinine (y-axis) were visualized for each pnd-21 dam (dam identifier x-axis) to determine metabolites important in defining the study groups. Example shown for nicotinate.
Pup pnd 26 Urine
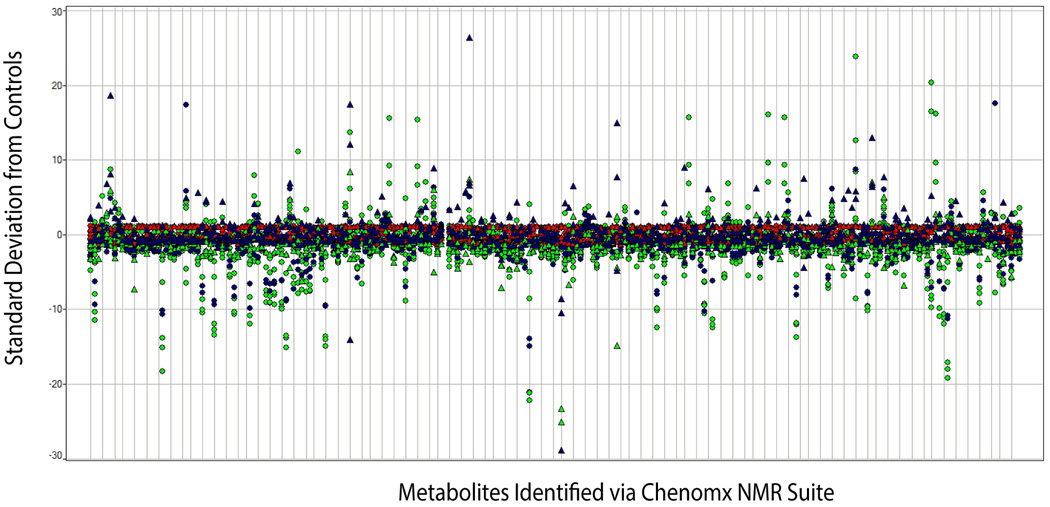
The standard differences from control for concentrations of endogenous metabolites in pnd-26 urine of male pups (circle) born to dams that experienced a high-dose (blue) or a low-dose (green) exposure to BBP compared with male pups born to dams that had a vehicle exposure (red) are shown in Fig. 6. Metabolites were significantly different in urine from the BBP dose groups compared with control. Likewise, significant differences were present for metabolites measured in urine from female pups (triangle) born to dams exposed to vehicle (red), high-(blue), or low-dose (green) BBP.
Figure 6.
Pup Urine: Standard difference (Y-axis) of specific [metabolite] in pnd 26 urine of pups born to dams that received a low dose or effect level dose of BBP during pregnancy from mean [metabolite] in urine of pups born to dams receiving vehicle only. Each point represents a metabolite (X-axis) in pnd 26 urine collected from pups: control (red), low (green), or high (blue) dose groups: triangle, female; circle, male.
Significant differences, in terms of magnitude change from control, were found for the low-dose group, many times greater than differences observed in the high-dose group, particularly for males. These data may indicate the initiation of increased responses for the offspring at low doses that may enable them to better adapt to the BBP exposure. It is also possible that these differences reflect a low-dose adverse effect that could serve as an early indicator of the onset of the development of adverse developmental outcome. Additional studies with more time-points and dose groups are needed to determine the relevance of this low-dose response.
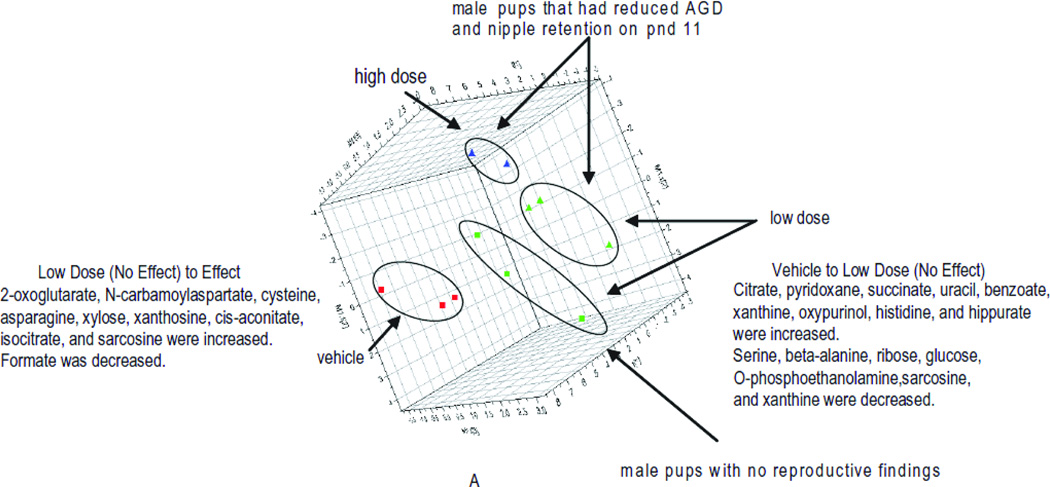
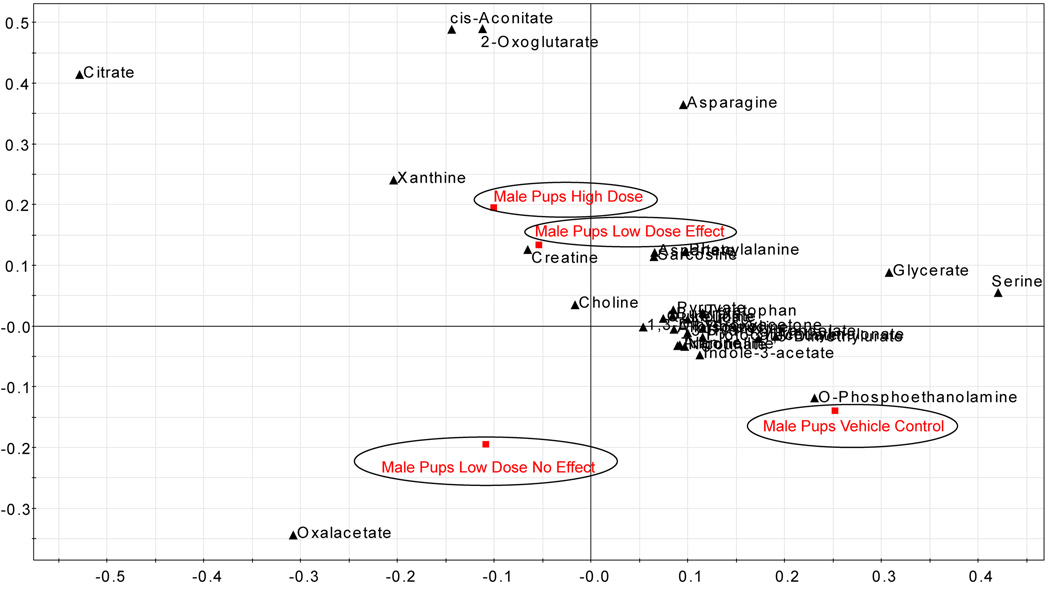
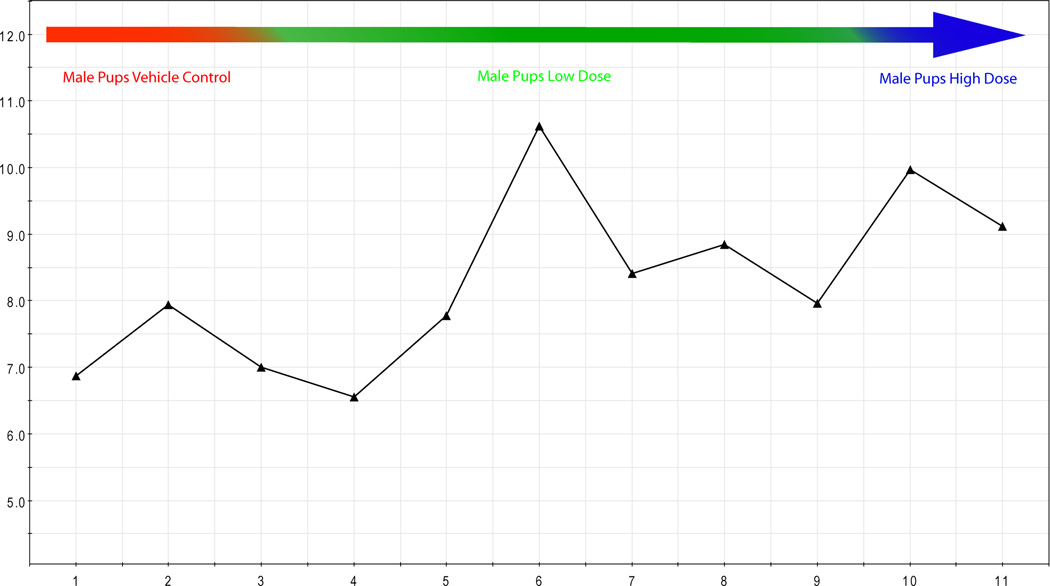
As expected, the multivariate analysis of the male and female pup urine clearly distinguished pups by sex. In addition, the analysis could distinguish both male and female pups by the dose the dam received during gestation (Fig. 7A, male pups). Multivariate analysis of male pup urine showed that pups in the low-dose group that did not have reproductive effects at any time during the study (green square) were in closer proximity to the pups born to vehicle exposed dams (red square), compared with pups in the low-dose group that had reproductive findings on pnd 21 (green triangle) that resolved by pnd 26. The pups from the low-dose group that had reproductive findings prior to pnd 26 (green triangle) were in closer proximity to the pups from the high-dose group with reproductive findings (blue triangle). While the sample numbers are low, there is compelling evidence that metabolomics could be used to develop non-invasive markers of adverse reproductive findings. The associated loading scatter plot indicated the metabolites that are increased or decreased for the respective study groups (Fig. 7B) and the concentration of metabolites (example shown for xanthine, Fig 7C) scaled to creatinine (y-axis) were visualized for each pup (pup identifier x-axis) to evaluate the directionality of change.
Figure 7.
a) Multivariate analysis of male pup urine (pnd 26) showed that pups from the low dose group with no reproductive findings (green square) had profiles more similar to the controls (red square) than the pups in low dose group that had reproductive findings prior to pnd 26 (green triangle). Control (red), low (green), or high (blue) dose groups are indicated by circled regions: triangle, reproductive findings at some time during study; square, no-effect male. b) The associated loading scatter plot indicated the metabolites that are increased or decreased for the respective study groups. c) The concentration of metabolites scaled to creatinine (y-axis) were visualized for each pup (pup identifier x-axis) to determine metabolites important in defining the study groups. Example shown for xanthine.
Relevant Metabolites and Pathways
Multivariate analysis, loadings plots, and variable importance plots were used to derive a sub-set of analytes most important for classification of each study group. In addition, the standard differences of metabolite concentrations from control values (in parenthesis) were used to determine the metabolites that most significantly differed for each study group.
Dams gd 18
In general, metabolites that best classified the gd 18 low-dose dams included metabolites derived from Krebs Cycle metabolism (isocitrate, 2; and 2-oxoglutarate, 3) phenylalanine metabolism (hippurate, 5), valine, leucine and isoleucine degradation (acetoacetate, −4). Gd-18 high-dose dams were best classified by metabolites associated with amino acid, purine, pyrimidine, glycerolipid metabolism and tryptophan metabolism with the following metabolites significantly different between the dg-18 high-dose dams and the respective control group: indole-3-acetate (3.5), quinolinate (4.0), and tryptophan (2.5), dihydroxyacetone (14), alanine (8), aminobutyrate (27), creatine (11), hippurate (30), leucine (65), alloisoleucine (65), choline (2), methylmalonate (6), phenylalanine (2.5), and pyruvate (13).
Dams pnd 21
Pnd-21 low-dose dams were best classified by metabolites derived from Krebs cycle metabolism (oxaloacetate, 3) and alanine metabolism (asparagine, 7), as well as xanthine (2). An increase in quinolate (4) (related to tryptophan metabolism) was observed for pnd 21 low-dose dams relative to control dams. Metabolites derived from Krebs cycle (acetate, 6) were statistically different between the pnd-21 high-dose dams and the control groups, and were also important to the classification of the pnd-21 high-dose group. Compounds associated with tryptophan and niacinamide metabolism (e.g., quinolate, 4; trigonelline, −6; indole-3-acetate, −3; and nicotinate, −6) were decreased in the pnd 21 high-dose group relative to the control group. The high-dose pnd 21 dam urine was lower (−3) in o-phosphoethanolamine (glycerophospholipid metabolism and glycine serine, threonine metabolism), and was lower (−3) in protocatechuate (phenylalanine and tyrosine, tryptophan metabolism) relative to the control group.
Female pups (pnd 26) born to dams receiving the low or the high dose of BBP during gestation were best classified based on metabolites derived from Krebs Cycle metabolism (citrate, 3; and 2-oxoglutarate, 2) and metabolites involved in glycine, serine and threonine metabolism (glycerate, −16): consistent with metabolites that had the most significant difference between the control and dose groups. Sarcosine (9) was one of the most significantly elevated metabolites for female pups born to dams that received high dose of BBP.
Metabolites that best classified male pups born to dams with a low-dose gestational exposure and that had no measurable reproductive endpoint at any study time-points mapped to the glycine, serine, and threonine pathway (-o-phosphocholine,11) or to β-alanine metabolism (dihydrouracil, −4). Metabolites from these two pathways also had the most significant changes from control. Male pups born to dams that had a high-dose gestational exposure were best classified by compounds involved in the Krebs cycle (2-oxoglutarate, 12), alanine, glycine, serine, threonine, pyrimidine and purine metabolism. The standard difference from control for male pups (regardless of effect or dose) showed decreases in tryptophan (−6), nicotinate (−3) and trigonelline (−4) (tryptophan and nicotinate metabolism), phenol (−6), protocatchuate (−5), and hydroxymandelate (−6) (tyrosine metabolism), and dimethylurate (−7) (purine). All pups that had measureable reproductive endpoints at any study time-point also had elevated 2-oxoglutarate (7) relative to the time-matched control. This metabolite was lower (−2.5) in urine from male pups that did not have measureable reproductive endpoints at any time-point.
DISCUSSION
This study was conducted to determine the utility of metabolomics in providing biomarkers in non-invasive biological fluids for the study of reproductive and developmental toxicology, and providing insights regarding mechanisms involved in generation of adverse effects. While interpretations of this study are limited due to the small study size, this study has clearly demonstrated the ability of metabolomics to differentiate urine samples from dams (during and following pregnancy) and from pups (following weaning) based on the gestational exposure of the dam to vehicle, low, or high doses of BBP. The study has demonstrated the use of this approach for the development of a method to assess prior exposure, and for developing non-invasive markers of reproductive and developmental outcomes.
The findings of male pup, but not female pup, reproductive and developmental toxicity following the dams’ daily gestational (gd 14 to gd 21) exposure to the high dose of BBP was an anticipated study outcome; consistent with previous research with BBP (Tyl et al., 2004). The findings of male reproductive effects in some males from all litters from the low-dose group on pnd 11 (nipple retention) and pnd 21 (reduced AGD) had not been previously demonstrated. However, the resolution of effects by pnd 26 was consistent with previous studies (Tyl et al. 2004).
Hormone measurements for the dam on pnd 21 showed a decrease in E for the high-dose group relative to the control group, consistent with the directionality of the most significant changes in profiles of endogenous metabolites for the pnd 21 dams. E levels in pnd-26 female pups showed an increase for the high-dose group relative to the control group, also consistent with the directionality of the most significant change in endogenous metabolites. Analysis of T or LH in male pups did not show significant differences between the dose groups or a relationship to the phenotypic effect. While previous studies have demonstrated reduced testicular and circulating T in gd 19 rat fetuses following in utero exposure to phthalates (Wilson et al., 2004), there are no data on circulating T levels in postnatal/postwean exposed rat offspring. It is known that reduced T results in increased hypothalamic synthesis and release of Gonadotrophin-releasing hormones (GnRH). GNRH stimulates pituitary production and release of follicle stimulating hormone (FSH) and luteinizing hormone (LH), which stimulate the testicular interstitial Leydig cells to increase their size and number to increase T synthesis. When T returns to normal levels, FSH and LH levels return to normal, consistent with our observations for T and LH measurements for male pups on pnd 26. All of the phthalate-induced postnatal male pup changes are initiated by reduced T in utero during initial male reproductive development. Because of the wide variation in hormone responses within each study and dose group, conclusions linking metabolite profile changes with hormonal variations could not be drawn. However, it was demonstrated that metabolomics of urine from pups could be used to differentiate those pups born to dams that had gestational exposure to vehicle or BBP, while the measurement of hormones was insufficient for making this differentiation.
Gene expression data compiled from a number of studies have been used to determine the pathways affected by administration of dibutylphthalate during pregnancy and evaluation of the effects on fetal testis gene expression (Euling et al., 2006). In terms of overall pathway activity, the pathways most affected were valine, leucine, isoleucine, alkaloid and steroid biosynthesis, and butanoate, beta-alanine, glycine, serine, threonine metabolism, arginine and proline metabolism, histidine and fatty acid metabolism. These results are consistent with the metabolites and pathways used to classify our exposure groups and are metabolites that are shown to be statistically different between the exposure and control groups. The effects of BBP exposure on gene expression have been evaluated in the rat mammary gland at pnd 21, 35, 50, and 100, after neonatal/pubertal exposure on pnd 2 – 20 (5 days per week, 500 mg/kg per day) (Moral et al., 2007). A substantial number of genes (515) were upregulated at pnd 21, immediately after exposure, compared with one gene downregulated. The genes affected changed with time after exposure. At 35 days, four genes were upregulated, and two downregulated. At 50 days, 25 genes were upregulated, and 14 were downregulated, and by 100 days, three genes were upregulated and none downregulated. Glutamate decarboxylase was downregulated at all timepoints. Fukuwatari and co-workers (Fukuwatari et al., 2004) found that administration of diethylhexylphthalate inhibits a key enzyme in the conversion of tryptophan to nicotinamide, and enhances quinolinate production and excretion in urine. This is consistent with the increases in quinolinate in the gd 18 dam urine and other metabolites identified that are involved in the tryptophan pathway.
In summary, this study has demonstrated the use of urinary metabolites in a classification approach of prior exposure (to include prior in utero exposure) past the time of the presence of the parent compound and metabolites derived from the parent compound. This approach may find important application in the assessment of prior exposure to classifications of environmental toxicants or drugs, and through mapping to metabolic pathways can provide important mechanistic insights.
Acknowledgments
This research was supported by RTI International
LITERATURE CITED
- Anway MD, Cupp AS, Uzumcu M, Skinner MK. Epigenetic transgenerational actions of endocrine disruptors and male fertility. Science. 2005;308(5727):1391–1392. doi: 10.1126/science.1108190. [DOI] [PMC free article] [PubMed] [Google Scholar]
- Blount BC, Silva MJ, Caudill SP. Levels of seven urinary phthalate metabolites in a human reference population. Environ. Health Perspect. 2000;108(10):972–982. doi: 10.1289/ehp.00108979. [DOI] [PMC free article] [PubMed] [Google Scholar]
- Buhimschi IA, Buhimschi CS, Christner R, Norwitz E, Weiner CP. Proteomic profiling and intra-amniotic infection. JAMA. 2004;292:2338. doi: 10.1001/jama.292.19.2338-a. author reply 2338–9. [DOI] [PubMed] [Google Scholar]
- Buhimschi IA, Buhimschi CS, Christner R, Weiner CP. Proteomics technology for the accurate diagnosis of inflammation in twin pregnancies. Bjog. 2005b;112:250–255. doi: 10.1111/j.1471-0528.2004.00341.x. [DOI] [PubMed] [Google Scholar]
- Buhimschi IA, Buhimschi CS, Weiner CP, Kimura T, Hamar BD, Sfakianaki AK, Norwitz ER, Funai EF, Ratner E. Proteomic but not enzyme-linked immunosorbent assay technology detects amniotic fluid monomeric calgranulins from their complexed calprotectin form. Clin. Diagn. Lab. Immunol. 2005c;12:837–844. doi: 10.1128/CDLI.12.7.837-844.2005. [DOI] [PMC free article] [PubMed] [Google Scholar]
- Buhimschi IA, Christner R, Buhimschi CS. Proteomic biomarker analysis of amniotic fluid for identification of intra-amniotic inflammation. Bjog. 2005d;112:173–181. doi: 10.1111/j.1471-0528.2004.00340.x. [DOI] [PubMed] [Google Scholar]
- Clausen I, Kietz S, Fischer B. Lineage-specific effects of polychlorinated biphenyls (PCB) on gene expression in the rabbit blastocyst. Reprod Toxicol. 2005 May-Jun;20(1):47–56. doi: 10.1016/j.reprotox.2004.11.006. [DOI] [PubMed] [Google Scholar]
- Currie RA, Orphanides G, Moggs JG. Mapping molecular responses to xenoestrogens through Gene Ontology and pathway analysis of toxicogenomic data. Reprod Toxicol. 2005 Sep-Oct;20(3):433–440. doi: 10.1016/j.reprotox.2005.03.014. [DOI] [PubMed] [Google Scholar]
- Daston GP, Naciff JM. Gene expression changes related to growth and differentiation in the fetal and juvenile reproductive system of the female rat: evaluation of microarray results. Reprod Toxicol. 2005a Jan-Feb;19(3):381–394. doi: 10.1016/j.reprotox.2004.09.004. [DOI] [PubMed] [Google Scholar]
- Desai M, Gayle D, Babu J, Ross MG. The timing of nutrient restriction during rat pregnancy/lactation alters metabolic syndrome phenotype. Am J Obstet Gynecol. 2007 Jun;196(6):555.e1–555.e7. doi: 10.1016/j.ajog.2006.11.036. 2007 PMID: 17547893. [DOI] [PMC free article] [PubMed] [Google Scholar]
- Euling S, Sen B, Welsh W, Georgopoulos PG, Ovacik M, Ieerapetritou MG, Androulakis I. Expression profiling to assess developmental effects of exposure to DBP. Poster presentation from ebCTC 2006 overview workshop at EOHSI. 2006 Nov 17; 2006. [Google Scholar]
- Foster PM. Disruption of reproductive development in male rat offspring following in utero exposure to phthalate esters. Int. J. Andrology. 2006 Feb;29(1):140–147. doi: 10.1111/j.1365-2605.2005.00563.x. Discussion 181–185. [DOI] [PubMed] [Google Scholar]
- Fukuwatari T, Ohsaki S, Fukuoka S, Sasaki R, Shibata K. Phthalate esters enhance quinolinate production by inhibiting α-Amino-β-Carboxymuconate-ε-Semialdehyde decarboxylase (ACMSD), a key enzyme of the tryptophan pathway. Tox Sci. 2004;(81):302–308. doi: 10.1093/toxsci/kfh204. [DOI] [PubMed] [Google Scholar]
- Gelineau-van Waes J, Bennett GD, Finnell RH. Phenytoin-induced alterations in craniofacial gene expression. Teratology. 1999 Jan;59(1):23–34. doi: 10.1002/(SICI)1096-9926(199901)59:1<23::AID-TERA7>3.0.CO;2-M. [DOI] [PubMed] [Google Scholar]
- Gravett MG, Novy MJ, Rosenfeld RG, Reddy AP, Jacob T, Turner M, McCormack A, Lapidus JA, Hitti J, Eschenbach DA, Roberts CT, Jr, Nagalla SR. Diagnosis of intra-amniotic infection by proteomic profiling and identification of novel biomarkers. JAMA. 2004;292:462–469. doi: 10.1001/jama.292.4.462. [DOI] [PubMed] [Google Scholar]
- Gray LE, Jr, Wolf C, Lambright C, Mann P, Price M, Cooper RL. Administration of potentially antiandrogenic pesticides (procymidone, linuron, iprodione, clozolinate, p,p’-DDE, and ketoconazole) and toxic substance (dibutyl- and diethylhexyl phthalate, PCB 169, and ethane dimethane sulphonate) during sexual differentiation produces diverse profiles of reproductive malformations in the male rat. J. Toxicol. Ind. Health. 1999;15(1/2):94–118. doi: 10.1177/074823379901500109. [DOI] [PubMed] [Google Scholar]
- Gray LE, Jr, Ostby J, Price M, Veeramachaneni DNR, Parks L. Perinatal exposure to the phthalates DEHP, BBP and DINP, but not DEP, DMP or DOTP alters sexual differentiation of the male rat. Toxicol. Sci. 2000;58(2):350–365. doi: 10.1093/toxsci/58.2.350. [DOI] [PubMed] [Google Scholar]
- Katz-Jaffe MG, Linck DW, Schoolcraft WB, Gardner DK. A proteomic analysis of mammalian preimplantation embryonic development. Reproduction. 2005 Dec;130(6):899–905. doi: 10.1530/rep.1.00854. [DOI] [PubMed] [Google Scholar]
- Kavlock R, Boekelheide K, Chapin R, Cunningham M, Faustman E, Foster P, Golub M, Henderson R, Hinberg I, Little R, Seed J, Shea K, Tabacova S, Tyl R, Williams P, Zacharewski T. NTP Center for the Evaluation of Risks to Human Reproduction: phthalates expert panel report on the reproductive and developmental toxicity of butyl benzyl phthalate. Reprod Toxicol. 2002;16:453–487. doi: 10.1016/s0890-6238(02)00029-1. [DOI] [PubMed] [Google Scholar]
- Kenny LC, Dunn WB, Ellis DI, Myers J, Baker PN, Consortium G, Kell DB. Novel biomarkers for pre-eclampsia detected using metabolomics and machine learning. Metabolomics. 2005;1:227–234. [Google Scholar]
- Klein LL, Freitag BC, Gibbs RS, Reddy AP, Nagalla SR, Gravett MG. Detection of intra-amniotic infection in a rabbit model by proteomics-based amniotic fluid analysis. Am. J. Obstet. Gynecol. 2005;193:1302–1306. doi: 10.1016/j.ajog.2005.06.017. [DOI] [PubMed] [Google Scholar]
- Kultima K, Nystrom AM, Scholz B, Gustafson AL, Dencker L, Stigson M. Valproic acid teratogenicity: a toxicogenomics approach. Environ Health Perspect. 2004 Aug;112(12):1225–1235. doi: 10.1289/txg.7034. [DOI] [PMC free article] [PubMed] [Google Scholar]
- Li LW, Fan LQ, Zhu WB, Nien HC, Sun BL, Luo KL, Liao TT, Tang L, Lu GX. Establishment of a high-resolution 2-D reference map of human spermatozoal proteins from 12 fertile sperm-bank donors. Asian J Androl. 2007 May;9(3):321–329. doi: 10.1111/j.1745-7262.2007.00261.x. [DOI] [PubMed] [Google Scholar]
- Liu K, Lehmann KP, Sar M, Young SS, Gaido KW. Gene expression profiling following in utero exposure to phthalate esters reveals new gene targets in the etiology of testicular dysgenesis. Biol. Reprod. 2005;73(1):180–192. doi: 10.1095/biolreprod.104.039404. [DOI] [PubMed] [Google Scholar]
- Mallidis C, Green BD, Rogers D, Agbaje IM, Hollis J, Migaud M, Amigues E, McClure N, Browne RA. Metabolic profile changes in the testes of mice with streptozotocin-induced type 1 diabetes mellitus. Int J Androl. 2007;30:9999. doi: 10.1111/j.1365-2605.2007.00829.x. [DOI] [PubMed] [Google Scholar]
- Memili E, Peddinti D, Shack LA, Nanduri B, McCarthy F, Sagirkaya H, Burgess SC. Bovine germinal vesicle oocyte and cumulus cell proteomics. Reproduction. 2007;133(6):1107–1120. doi: 10.1530/REP-06-0149. [DOI] [PubMed] [Google Scholar]
- Mikheeva S, Barrier M, Little SA, Beyer R, Mikheeva AM, Kerr MK, Mirkes PE. Alterations in gene expression induced in day-9 mouse embryos exposed to hyperthermia (HS) or 4-hydroperoxycyclophosphamide (4CP): analysis using cDNA microarrays. Toxicol. Sci. 2004;79(2):345–359. doi: 10.1093/toxsci/kfh080. [DOI] [PubMed] [Google Scholar]
- Mirkes P, McClure ME, Heindel JJ, Sander M. Developmental toxicology in the 21st century: multidisciplinary approaches using model organisms and genomics. Birth Defects Res A Clin Mol Teratol. 2003;67(1):21–34. doi: 10.1002/bdra.10024. [DOI] [PubMed] [Google Scholar]
- Moggs JG, Tinwell H, Spurway T, Chang HS, Pate I, Lim FL, Moore DJ, Soames A, Stuckey R, Currie R, Zhu T, Kimber I, Ashby J, Orphanides G. Phenotypic anchoring of gene expression changes during estrogen-induced uterine growth. Environ Health Perspect. 2004;112(16):1589–1606. doi: 10.1289/txg.7345. [DOI] [PMC free article] [PubMed] [Google Scholar]
- Moral R, Wang R, Russo IH, Mailo DA, Lamartiniere CA, Russo J. The plasticizer butyl benzyl phthalate induces genomic changes in rat mammary gland after neonatal/prepubertal exposure. BMC Genomics. 2007;8:453. doi: 10.1186/1471-2164-8-453. [DOI] [PMC free article] [PubMed] [Google Scholar]
- Naciff JM, Daston GP. Toxicogenomic approach to endocrine disrupters: identification of a transcript profile characteristic of chemicals with estrogenic activity. Toxicol Pathol. 2004 Jul-Aug;32(Suppl 2):59–70. doi: 10.1080/01926230490463812. [DOI] [PubMed] [Google Scholar]
- Naciff JM, Hess KA, Overmann GJ, Torontali SM, Carr GJ, Tiesman JP, Foertsch LM, Richardson BD, Martinez JE, Daston GP. Gene expression changes induced in the testis by transplacental exposure to high and low doses of 17{alpha}-ethynyl estradiol, genistein, or bisphenol A. Toxicol Sci. 2005 Aug;86(2):396–416. doi: 10.1093/toxsci/kfi198. [DOI] [PubMed] [Google Scholar]
- Nagao T, Ohta R, Marumo H, Shindo T, Yoshimura S, Ohno H. Effect of butylbenzyl phthalate after gavage administration: a two-generation reproductive study. Reprod. Toxicol. 2000;14(6):513–532. doi: 10.1016/s0890-6238(00)00105-2. [DOI] [PubMed] [Google Scholar]
- Nilsson S, Ramstrom M, Palmblad M, Axelsson O, Bergquist J. Explorative study of the protein composition of amniotic fluid by liquid chromatography electrospray ionization Fourier transform ion cyclotron resonance mass spectrometry. J. Proteome Res. 2004;3:884–889. doi: 10.1021/pr0499545. [DOI] [PubMed] [Google Scholar]
- Odunsi K, Wollman RM, Ambrosone CB, Hutson A, McCann SE, Tammela J, Geisler JP, Miller G, Sellers T, Cliby W, Qian F, Keitz B, Intengan M, Lele S, Alderfer JL. Detection of epithelial ovarian cancer using 1H-NMR-based metabonomics. Int J Cancer. 2005 Feb 20;113(5):782–788. doi: 10.1002/ijc.20651. 2005. [DOI] [PubMed] [Google Scholar]
- Park JS, Oh KJ, Norwitz ER, Han JS, Choi HJ, Seong HS, Kang YD, Park CW, Kim BJ, Jun JK, Syn HC. Identification of proteomic biomarkers of preeclampsia in amniotic fluid using SELDI-TOF mass spectrometry. Reprod. Sci. 2008 May;15(5):457–468. doi: 10.1177/1933719108316909. [DOI] [PubMed] [Google Scholar]
- Parks LG, Ostby JS, Lambright CR, Abbott BD, Gray LE., Jr Perinatal butylbenzyl phthalate (BBP) and bis (2-ethylhexyl) phthalate (DEHP) exposures induce antiandrogenic effects in Sprague-Dawley (SD) rats. Biol. Reprod. 1999;60:153. [Google Scholar]
- Parks LG, Ostby JS, Lambright CR, Abbott BD, Klinefelter GR, Barlow NJ. The plasticizer diethylhexyl phthalate induces malformations by decreasing fetal testosterone biosynthesis during sexual differentiation in the male rat. Toxicol. Sci. 2000;58:339–349. doi: 10.1093/toxsci/58.2.339. [DOI] [PubMed] [Google Scholar]
- Peddinti D, Nanduri B, Kaya A, Feugang JM, Burgess SC, Memili E. Comprehensive proteomic analysis of bovine spermatozoa of varying fertility rates and identification of biomarkers associated with fertility. BMC Syst. Biol. 2008 Feb;22:19. doi: 10.1186/1752-0509-2-19. [DOI] [PMC free article] [PubMed] [Google Scholar]
- Ruetschi U, Rosen A, Karlsson G, Zetterberg H, Rymo L, Hagberg H, Jacobsson B. Proteomic analysis using protein chips to detect biomarkers in cervical and amniotic fluid in women with intra-amniotic inflammation. J. Proteome Res. 2005;4:2236–2242. doi: 10.1021/pr050139e. [DOI] [PubMed] [Google Scholar]
- Slupsky CM, Rankin KN, Wagner J, Fu H, Chang D, Weljie AM, Saude EJ, Lix B, Adamko DJ, Shah S, Greiner R, Sykes BD, Marrie TJ. Investigations of the Effects of Gender, Diurnal Variation, and Age in Human Urinary Metabolomic Profiles. Anal. Chem. 2007;79(18):6995–7004. doi: 10.1021/ac0708588. 2007. [DOI] [PubMed] [Google Scholar]
- Thadikkaran L, Crettaz D, Siegenthaler MA, Gallot D, Sapin V, Iozzo RV, Queloz PA, Schneider P, Tissot JD. The role of proteomics in the assessment of premature rupture of fetal membranes. Clin Chim Acta. 2005 Oct;360(1–2):27–36. doi: 10.1016/j.cccn.2005.04.018. [DOI] [PubMed] [Google Scholar]
- Tyl RW, Myers CB, Marr MC, Fail PA, Seely JC, Brine DR, Barter RA, Butala JH. Reproductive toxicity evaluation of dietary butyl benzyl phthalate (BBP) in rats. Reprod Toxicol. 2004 Mar-Apr;18(2):241–264. doi: 10.1016/j.reprotox.2003.10.006. [DOI] [PubMed] [Google Scholar]
- Vergouw CG, Botros LL, Roos P, Lens JW, Schats R, Hompes PG, Burns DH, Lambalk CB. Metabolomic profiling by near-infrared spectroscopy as a tool to assess embryo viability: a novel, non-invasive method for embryo selection. Human Reprod. 2008 Jul;23(7):1499–1504. doi: 10.1093/humrep/den111. [DOI] [PubMed] [Google Scholar]
- Viant MR, Pincetich CA, Tjeerdema RS. Metabolic effects of dinoseb, diazinon and esfenvalerate in eyed eggs and alevins of Chinook salmon (Oncorhynchus tshawytscha) determined by 1H NMR metabolomics. Aquat Toxicol. 2006 May 25;77(4):359–371. doi: 10.1016/j.aquatox.2006.01.009. 2006. [DOI] [PubMed] [Google Scholar]
- Vuadens F, Benay C, Crettaz D, Gallot D, Sapin V, Schneider P, Bienvenut WV, Lemery D, Quadroni M, Dastugue B, Tissot JD. Identification of biologic markers of the premature rupture of fetal membranes: proteomic approach. Proteomics. 2003;3:1521–1525. doi: 10.1002/pmic.200300455. [DOI] [PubMed] [Google Scholar]
- Weljie AM, Newton J, Mercier PM, Carlson E, Slupsky CM. Targeted Profiling: Quantitative Analysis of 1H-NMR Metabolomics Data. Anal Chem. 2006;78(13):4430–4442. doi: 10.1021/ac060209g. 2006. [DOI] [PubMed] [Google Scholar]
- Wilson VS, Lambright C, Furr J, Ostby J, Wood C, Held G, Gray LE., Jr Phthalate ester-induced gubernacular ligament lesions are associated with reduced Insl3 gene expression in the fetal rat testis during sexual differentiation. Tox. Lett. 2004;146:207–215. doi: 10.1016/j.toxlet.2003.09.012. [DOI] [PubMed] [Google Scholar]
- Yamakawa K, Yoshida K, Nishikawa H, Kato T, Iwamoto T. Comparative analysis of interindividual variations in the seminal plasma proteome of fertile men with identification of potential markers for azoospermia in infertile patients. J. Androl. 2007;28(6):858–865. doi: 10.2164/jandrol.107.002824. [DOI] [PubMed] [Google Scholar]
- Yang M, Lee HS, Pyo MY. Proteomic biomarkers for prenatal bisphenol A-exposure in mouse immune organs. Environ. Mol. Mutagen. 2008 Jun;49(5):368–373. doi: 10.1002/em.20394. [DOI] [PubMed] [Google Scholar]


