

Abstract
Synthetic random copolymers based on the nylon-3 (β-peptide) backbone show promise as inexpensive antimicrobial agents resistant to proteolysis. We present a time-resolved observational study of the attack of a particular copolymer MM63:CHx37 on single, live E. coli cells. The composition and chain length of MM63:CHx37 (63% cationic subunits, 37% hydrophobic subunits, 35-subunit average length) were optimized to enhance antibacterial activity while minimizing lysis of human red blood cells. For E. coli cells that export GFP to the periplasm, we obtain alternating phase contrast and green fluorescence images with 12 s time resolution over 60 min following initiation of copolymer flow. Within seconds, cells shrink and exhibit the same plasmolysis spaces that occur following abrupt external osmotic upshift. The osmoprotection machinery attempts to replenish cytoplasmic water, but recovery is interrupted by permeabilization of the cytoplasmic membrane (CM) to GFP. Evidently the highly cationic copolymer and its counterions rapidly translocate across the outer membrane (OM) without permeabilizing it to GFP. The CM permeabilization event is spatially localized. Cells whose CM has been permeabilized never recover growth. The minimum inhibitory concentration (MIC) for cells lacking the osmolyte importer ProP is fourfold smaller than for normal cells, suggesting that osmoprotection is an important survival strategy. In addition, at the time of CM permeabilization we observe evidence of oxidative stress. The MIC under anaerobic conditions is at least eight-fold larger than in aerobic conditions, further implicating oxidative damage as an important bacteriostatic effect. Once the copolymer reaches the periplasm, multiple growth-halting mechanisms proceed in parallel.
Graphical Abstract
There is a profound and widely recognized need for new molecular strategies to combat pathogenic bacteria.1,2 Such strategies include drugs for systemic use in patients (delivered either orally or by injection), agents that act at interfaces between the human body and the external world, and materials that can disinfect environmental surfaces (e.g., in hospitals). Humans and other multicellular organisms have evolved distinctive defense mechanisms at interfaces such as skin and the GI tract. In particular, a wide range of small and medium-sized polypeptides can exert broad-spectrum antibacterial activity via multiple mechanisms.3–6 One common mechanistic theme among these antimicrobial peptides (AMPs) involves disruption of bacterial membranes, a mode of action against which it seems difficult for microbes to evolve resistance. Membrane-active AMPs are generally selective for bacterial cell membranes relative to host cell membranes, based on charge differences at the cell surfaces. The peptides usually bear net positive charge, and the outer surfaces of bacterial cells have a substantial negative charge density, while the outer surfaces of eukaryotic cells tend more toward electroneutrality.
In earlier work, we tested the unorthodox hypothesis that the biological activity profile of AMPs may not depend on a defined subunit sequence. We have identified multiple examples of sequence-random nylon-3 copolymers (β-peptide backbone) that mimic AMPs in inhibiting bacterial growth while displaying little propensity to lyse human red blood cells (“hemolysis”).7–12 Because sequence-random copolymers are much easier to produce than are sequence-specific peptides or other oligomers, it is conceivable that nylon-3 materials could be developed for clinical applications involving interfaces between the human body and the environment.
In parallel, we have developed unique, single-cell fluorescence imaging assays that monitor in real time key mechanistic events during the attack of AMPs on live E. coli or B. subtilis.13–18 These events include the translocation of an AMP across the outer membrane (OM), permeabilization of the cytoplasmic membrane (CM), the onset of osmotic and oxidative stress, and the halting of growth. Here we apply those mechanistic assays to the attack of one promising nylon-3 copolymer MM63:CHx37 (Fig. 1) on live E. coli. In earlier work, this polymer displayed high antimicrobial activity against a panel of bacterial species and also low hemolytic activity against red blood cells.10 MM63:CHx37 is copolymerized from monomethyl beta lactam (MMβ) and cyclohexyl beta lactam (CHxβ) monomers, mixed in molar ratio of 63:37. Within the polymeric product, the subunit MM has a free amine group at its α-carbon and carries a positive charge at physiological pH. On the other hand, the subunit CHx is hydrophobic. Previous studies showed that the polymer disrupts bilayers composed of bacterial lipids,11,19 but the mechanism by which the polymer acts on live cells has not been characterized.
Figure 1.
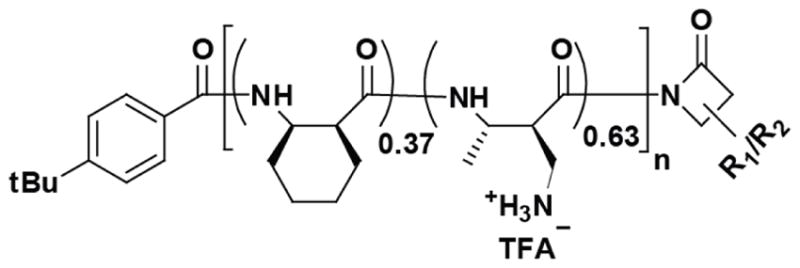
Structure of the nylon-3 copolymer MM63:CHx37, with the monomer molar ratio of 63:37 (cationic subunits: hydrophobic subunits). Mean chain length was 35 subunits.
Observations described below show that the highly cationic copolymer translocates across the E. coli OM within seconds, imparting hyperosmotic shock to the cell and abruptly halting growth. Subsequent permeabilization of the CM is concurrent with the apparent onset of oxidative stress. While we have observed analogous symptoms during the attack of natural and synthetic AMPs on E. coli,13,15,17,18 the facility with which the highly charged nylon-3 copolymer crosses the outer membrane without permeabilizing it to GFP is unique in our experience. Unlike the previously studied natural AMPs LL-37 and Cecropin A, the copolymer never permeabilizes the outer membrane (OM) to GFP over the 50-min observation period. Once the copolymer reaches the periplasm at sufficiently high concentration, multiple growth-halting effects evidently occur in parallel, as described in detail below.
RESULTS AND DISCUSSION
The four E. coli strains of interest (Table 1) are wild-type MG1655 (“WT”), a proP deletion mutant strain (“ΔproP”), and versions of these strains that express GFP from a plasmid and export it to the periplasm (“WT-ppGFP” and “ΔproP-ppGFP, respectively). MIC measurements for the WT and ΔproP strains are shown in Fig. S1 and summarized in Table 1. For the microscopy experiments, cells are sampled from exponentially growing cultures and plated on a coverslip that forms the base of a microfluidics chamber. At t = 0, the flow of aerated medium is switched to aerated medium plus a known concentration of the copolymer MM63:CHx37. Green fluorescence and phase contrast images are alternated at 6-s intervals (12-s total cycle time) for a period of up to 1 hr. Cell length measurements reveal osmotic effects, while GFP images reveal osmotic effects and membrane permeabilization events. The permeable dye CellROX Green fluoresces to provide a signal of oxidative stress.
Table 1.
E. coli strains, doubling times, and MIC values for copolymer MM63:CHx37.
| E. coli straina | Doubling time at 30°C (min)b | MIC (μg/mL)c |
|---|---|---|
| MG1655 (WT) | 50 | 25 (+ O2), >200 (− O2) |
| WT-ppGFP | 51 | -- |
| ΔproP | 50 | 6.25 (+ O2) |
| ΔproP-ppGFP | 49.5 | -- |
See text for detailed description of strains.
In bulk cultures grown in EZRDM.
Minimum inhibitory concentration for 6-hr incubation period. (+ O2) denotes growth in aerobic conditions; (− O2) denotes growth in anaerobic conditions.
Apparent Osmotic Effects of Nylon-3 Copolymer on WT-ppGFP Cells
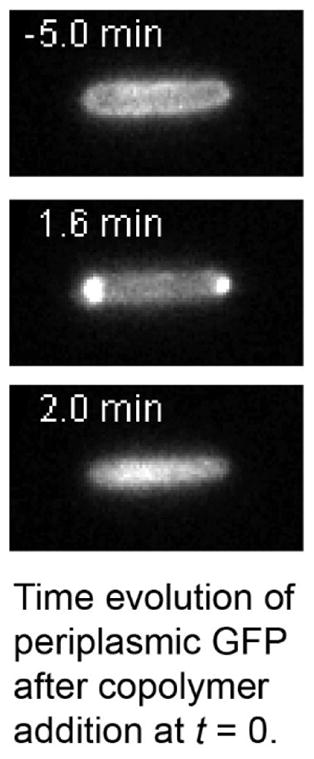
At t = 0, we initiated flow of 30 μg/mL of copolymer MM63:CHx37 (1.2X the WT MIC) into the microfluidics chamber and observed changes in the WT-ppGFP cell length and in the GFP intensity and spatial distribution as a function of time. More than 70 cells were observed over 8 different experimental preparations, with good reproducibility of symptoms vs time. Within 1–2 imaging cycles (12–24 s) after injection, all the cells abruptly begin to shrink in length (Figs. 2 and S2; Movie S1). Over the next 1–2 min, additional, less rapid shrinkage occurs until the total cell length has decreased by (9 ± 3)% of the original length. As the shrinkage proceeds, periplasmic GFP intensity gradually accumulates at the two cell poles (Fig. 2A). We interpret this observation to indicate that the cytoplasm has lost water to the expanded periplasmic endcaps. We denote the cell shrinkage and “periplasmic bubble” formation events as Phase 1 of the cellular response to the copolymer.
Figure 2.

The strain WT-ppGFP was treated with 30 μg/mL of copolymer MM63:CHx37 (1.2X the WT MIC) at time t = 0. A) GFP fluorescence images for a typical cell at t = −5.0 min, 1.6 min, and 2.0 min. B) The intensity profile projected onto the short axis of the cell at t = −5.0 min and +2.0 min. The periplasmic profile has become cytoplasmic. C) Cell length and total GFP fluorescence intensity vs time for the same cell shown in A. Length shrinks abruptly during the first 12–24 s after injection (Phase 1, salmon color); recovers partially at t = 1.7 min (Phase 2, yellow color); and then stabilizes after permeabilization of the cytoplasmic membrane at t = 1.9 min (Phase 3, blue color). See Movie S1.
The overall cell shrinkage and the change in the spatial distribution of periplasmic GFP during Phase 1 are highly reminiscent of the effects induced by an abrupt external osmotic upshift with an osmolyte that accesses the periplasm but does not permeate the CM, such as NaCl.20–22 The periplasmic bubbles are known as plasmolysis spaces.20 We ascribe the copolymer-induced cell shrinkage to rapid translocation of the highly positively charged copolymer and its many counterions across the OM and into the periplasm. This increases the periplasmic osmolality and draws water from the cytoplasm. One driving force for copolymer translocation across the OM is the concentration gradient. In addition, the cationic copolymer may have binding affinity for periplasmic components such as the anionic peptidoglycan layer. The cytoplasmic membrane accommodates the reduced cytoplasmic volume by collapsing its endcaps, approximately conserving the surface area of the CM. This opens gaps between the CM and OM at the endcaps. The resulting expansion and redistribution of the periplasmic volume causes freely diffusing molecules like GFP to collect in the endcaps, where most of the periplasmic volume now resides.
We can compare the periplasmic GFP images induced by 1.2X WT MIC of the copolymer with those induced by external NaCl in our earlier study of plasmolysis effects.20 By this measure, the hyperosmotic shock from the copolymer is roughly equivalent to that arising from a moderate external NaCl upshift of ~250 mOsm. If we assume each copolymer entering the periplasm brings 20 counterions with it and the periplasm is an ideal solution, this would imply a copolymer concentration in the periplasm of ~13 mM. As a rough estimate, this concentration of copolymer would occupy only ~6% of the periplasm by volume, which is feasible. However, the copolymer concentration in the surround is held at 30 μg/mL, which corresponds to a molar concentration of ~8 μM. The driving force that would concentrate the copolymer 1600-fold in the periplasm is unknown. It remains possible that a smaller periplasmic concentration is activating unknown biophysical or osmoregulation mechanisms.
For 80% of the cells, we usually observed partial recovery of cell length over the first several minutes after the shrinkage event (Fig. 2C; additional examples in Fig. S2). We denote this as Phase 2 of the response. As the cells regain length, their periplasmic bubbles shrink measurably. This recovery of length and decrease in bubble volume continues until the moment of permeabilization of the cytoplasmic membrane to GFP. CM permeabilization is observed as an abrupt change in GFP spatial distribution due to a transfer of GFP from periplasm to the cytoplasm (Fig. 2A and B). About 20% of the WT-ppGFP cells did not exhibit a discernible Phase 2; imaged with 12-s resolution, these cells went directly from Phase 1 to Phase 3 (examples in Fig. S2). CM permeabilization occurred unusually quickly for these cells. We hypothesize that the partial length recovery in Phase 2 is due to the natural osmoprotection response of the cell.23 In the earliest response, the cell actively imports K+ and glutamate (Glu−) into the cytoplasm in an attempt to retain cytoplasmic water. Later, the cell uses ProP to import neutral osmoprotectants and exports the excess K+ from the cytoplasm, enabling restoration of growth. This hypothesis is tested below.
Cytoplasmic Membrane Permeabilization and Irreversible Halting of Growth
At the same copolymer concentration of 1.2X MIC, >85% of the cells exhibit CM permeabilization within the 60-min observation time (Fig. 2A, B). The GFP spatial distribution changes dramatically in just 1–2 imaging cycles (12–24 s), from a periplasmic distribution to a cytoplasmic distribution. At the same time, we observe a decrease in total GFP fluorescence intensity by 15% (Fig. 2C). This decrease is likely due to the higher pH of the cytoplasm and the known pH sensitivity of GFP fluorescence.24 We define the period after CM permeabilization as Phase 3. After permeabilization of the CM the cell length typically stabilizes at a value ~5% smaller than the original length at t = 0. No subsequent cell growth is observed over the 60-min observation period.
Remarkably, cytoplasmic membrane permeabilization consistently occurs locally, near one pole. This is observed most readily in filamentous, cephalexin-treated cells (Fig. 3, Movie S4), but the same behavior is observed in cells growing normally. See SI for additional details. Because the copolymer lacks a defined length, sequence, or chirality, we do not believe the permeabilization can be due to well-defined pore structures. Some sort of “chaotic pore” or “localized carpet mechanism” seems more likely.
Figure 3.

MG1655 expressing periplasmic GFP was treated with cephalexin at 60 μg/mL prior to the exposure to MM63:CHx37. The injection of the polymer solution occurred at 120 sec. The axial fluorescence intensity was normalized by the total fluorescence intensity. The red dotted line indicates the basal level of fluorescence in the cylindrical region of the cell when the plasmolysis occurred. See Movie S4.
The time at which CM permeabilization occurs varies widely from cell to cell, typically lying in the range t = 1–20 min after copolymer injection (Fig. S2). Complete loss of the GFP signal, which would indicate permeabilization of the OM to GFP, never occurs within the 1-hr observation period. We infer that MM63:CHx37 can move across the OM and accumulate inside the periplasm without permeabilizing the OM to GFP-size species. The subsequent permeabilization of the CM to GFP should release small molecules (including ATP) from the cytoplasm into the periplasm and then to the surrounding medium, destroying the proton-motive force (pmf). Evidently CM permeabilization halts the osmotic recovery response and ends Phase 2. Studies of WT-ppGFP cells at sub-MIC copolymer dosage (below) confirm the correlation of CM permeabilization with the irreversible halting of growth.
Remarkably, at 1.2X MIC copolymer dosage, a few (<5%) of the cells exhibit several cycles of Phase 1 and Phase 2 prior to CM permeabilization (Fig. S3 and Movie S2). These cells shrink, then recover in length, then shrink and recover again. The periplasmic bubbles form, then deflate, then form and deflate again. The cycles continue until the CM becomes permeabilized. We do not understand this behavior.
Active Respiration Required for Partial Length Recovery
If the partial recovery of cell length in Phase 2 is related to active osmoregulation, we reasoned that the recovery should depend on respiration, which maintains the pmf and enables biosynthesis of ATP. ATP production in turn allows the cell to import ions (K+ and Glu−) and osmoprotectants (Pro and glycine betaine, if present in the medium) into the cytoplasm against the chemical gradient.25–28 To test this hypothesis, we pre-treated WT-ppGFP cells with both CCCP and α-deoxyglucose. This treatment halts respiration; see SI for additional details. Much like the respiring cells (Fig. 4A), the non-respiring cells (Fig. 4B) shrank in length by ~10% and formed periplasmic bubbles. Evidently the initial shrinkage (Phase 1) does not require ATP or the pmf, although the shrinkage occurred more slowly in general for pre-treated cells than for untreated cells. Unlike the respiring cells, for the non-respiring cells we typically observed no significant recovery of the cell length after the shrinkage; Phase 2 was absent. These observations are consistent with the osmotic hypothesis, which predicts that cell shrinkage does not require active respiration, but that partial recovery of cell length does require respiration (i.e., ATP). In addition, the non-respiring cells do not exhibit a decrease in GFP intensity at the time of CM permeabilization, consistent with the lack of a pH gradient across the CM. Additional details are provided in SI.
Figure 4.

Relative cell length vs time under MM63:CHx3 treatment at 30 μg/mL on WT MG1655 expressing periplasmic GFP without (left) and with (right) pretreated with CCCP (200 μM) and α-deoxyglucose (1 mM). The normally growing cells (right) exhibit Ph1 (Phase 1, red), Ph2 (Phase 2, yellow), and Ph3 (Phase 3, blue). The CCCP/α-deoxyglucose treated cells exhibited Ph1, and Ph3. The time at which cytoplasmic membrane (CM) permeabilization occurred is labeled with an arrow.
Import of Osmoprotectants Required for Growth Recovery at sub-MIC Dosage
Our hypothesis is that entry of the copolymer and its counterions into the periplasm mimics an external osmotic upshift (i.e., hyperosmotic shock). This phenomenon should trigger the natural cellular osmoprotection mechanisms, including initial import of K+ and Glu− and subsequent import of neutral osmoprotectants such as Pro and glycine betaine (if available) by ProP.23 We therefore predicted that deletion of the gene proP should diminish the cell’s ability to respond to copolymer attack and recover growth. The channel ProU can provide an alternative means of osmoprotectant uptake, but the ProU expression level is low in our medium.23 For the ΔproP strain of E. coli, the copolymer MIC is only 6.3 μg/mL (Table 1 and Fig. S1), a factor of 4 lower than for wild-type MG1655. This difference is consistent with our hypothesis that ProP helps wild-type E. coli to resist the deleterious effects of exposure to the nylon-3 copolymer.
We performed single-cell, time-lapse microscopy imaging of the WT-ppGFP and the ΔproP-ppGFP strain at 15 μg/mL of copolymer. This concentration is well below the MIC for the WT strain (25 μg/mL), but above the MIC for the ΔproP strain (6.3 μg/mL). Measurement of the relative cell length vs time without injection of the copolymer shows that the ΔproP and wild-type MG1655 strains both grow at the same rate.
For WT cells we monitored cell length vs time after initiation of flow of 15 μg/mL copolymer at t = 0 (example in Movie S3). To enable facile comparison among cells of different initial length, in Fig. 5A we plot relative cell length vs time for 20 WT cells, calculated by dividing the cell length at times t > −5 min by the length at t = −5 min. Immediately after injection, the cells abruptly shrink in length by (5 ± 1)% (Fig. 5A). Measurements on WT-ppGFP cells treated with 15 μg/mL of copolymer showed that periplasmic bubbles form when the shrinkage occurred. As shown above, cells shrank by 9% on average at the higher copolymer concentration (30 μg/mL of MM63:CHx37). Evidently the degree of cell shrinkage in Phase 1 increases with the bulk concentration of the copolymer, as seems reasonable if shrinkage is caused by an osmotic effect. Accordingly, in an imaging study of the effects of external addition of osmolytes, the Shaevitz lab found that the fractional degree of shrinkage increased with bulk concentration of osmolyte.21
Figure 5.

Relative cell length vs time under MM63:CHx3 treatment at 15 μg/mL on WT MG1655 (gray, n = 20) and ΔproP (green, n = 41). The dotted line indicates the time of injection.
At 15 μg/mL of copolymer, the majority of the WT cells (>85%) began to lengthen again several minutes after the shrinkage event (Fig. 5A). This lengthening apparently arises from real growth, not just an osmotic recovery, because the cell length at t = 20 min typically exceeds that at t = 0 and continues to increase thereafter. In addition, for the WT-ppGFP strain, as the recovering cells lengthen the pattern of GFP fluorescence returns to the normal periplasmic distribution. For all WT cells that recovered, no CM permeabilization step was observed over the 30 min observation period. In contrast, permeabilization of the CM to GFP (observed as movement of GFP into the cytoplasm) was always observed for the small fraction of cells (~15%) that did not begin to lengthen after the initial cell shrinkage event. In WT-ppGFP cells exposed to the sub-MIC copolymer concentration, the initial osmotic effect is evidently reversible unless CM permeabilization occurs. Again, CM permeabilization to GFP correlates with the irreversible halting of growth.
We carried out analogous imaging studies after treatment of the ΔproP strain with 15 μg/mL of MM63:CHx37 (Fig. 5B). This concentration is more than twice the 6-hr MIC for the ΔproP strain. Because we are concerned with membrane permeabilization and osmotic effects, we chose to compare wild-type and ΔproP behaviors at the same absolute bulk copolymer concentration. Immediately after the injection, we observed shrinkage of the relative cell length (Phase 1). Measurements with ΔproP-ppGFP showed that periplasmic bubbles of GFP formed at the endcaps. The degree of shrinkage, (7 ± 2)%, is slightly higher than that of WT cells, (5 ± 1)%, suggesting that the absence of ProP enables the copolymer to induce a larger net osmotic effect. At 15 μg/mL of copolymer, the percentage of the cells that undergo CM permeabilization is similar for the WT-ppGFP strain (14%, n = 42) and the ΔproP-ppGFP strain (13%, n = 78), indicating that the presence or absence of ProP does not influence CM permeabilization. However, unlike wild-type MG1655, a large majority of ΔproP cells (~90%) did not return to normal growth over the 30-min observation period.
These data support the hypothesis that in WT cells treated with 15 μg/mL of copolymer, the import of osmoprotectants by ProP enables most cells to recover from the initial osmotic effects. For the ΔproP mutant strain, the same osmotic effects are evidently sufficient to halt growth, even when CM permeabilization does not occur.
Oxidative Stress on Permeabilization of Cytoplasmic Membrane
In earlier studies of the effects of the peptides CM15 and LL-37 on E. coli,13 formation of reactive oxygen species (ROS) was observed at the time of permeabilization of the cytoplasmic membrane. For CM15, the MIC was 20-fold higher (i.e., the peptide was much less active) under anaerobic conditions relative to aerobic conditions, indicating that ROS formation is an important cause of growth inhibition under aerobic conditions. ROS-mediated damage may eventually prove to be a fairly general growth-halting mechanism for AMPs under aerobic conditions, but more work is needed before this conclusion is secure. We wondered whether nylon-3 copolymers that mimic AMP behavior might also inhibit growth via formation of reactive oxygen species.
To answer this question, we measured the nylon-3 copolymer MIC for WT cells under aerobic and anaerobic growth conditions (Table 1, Fig. S1). The MIC under anaerobic conditions is at least 8-fold higher than under aerobic conditions (>200 μg/mL vs 25 μg/mL). Evidently growth inhibition is much more effective in the presence of oxygen than in its absence. To test for ROS formation, we applied the CellROX Green assay to WT cells treated with the copolymer, as described earlier for the AMP CM15.13 CellROX Green is a permeable, oxidation-sensitive dye. In vitro, it is selectively oxidized to a fluorescent form CellROX* by reaction with superoxide (O2−) or hydroxyl radical (•OH) in the presence of ds-DNA, but not with hydrogen peroxide (H2O2). CellROX* fluoresces upon binding to DNA.
At t = 0 we initiated flow of aerated EZRDM containing 30 μg/mL of copolymer MM63:CHx37 (1.2X the WT MIC) plus 2.5 μM of CellROX Green across plated WT cells. The subsequent changes in cell length vs time were similar to those without CellROX Green, typically exhibiting three phases (example in Fig. 6). During Phase 1 (cell shrinkage), the CellROX* fluorescence intensity rises slightly (Movie S5). During Phase 2 (osmotic response and partial recovery of the turgor pressure), the CellROX* intensity plateaus. During Phase 3 (after CM permeabilization), much stronger CellROX* intensity rises gradually over a period of 5–10 min. The spatial distribution of fluorescence is that of the nucleoids (Movie S5). Lacking the corresponding periplasmic GFP image, we cannot accurately determine when the cytoplasmic membrane is permeabilized. Based on experiments like that of Fig. 2, we expect that the CM is permeabilized when the cell length recovery ends. If so, then the strong CellROX* signal begins to rise when CM permeabilization occurs, long after the cell shrinkage event. This behavior is similar to that observed for CM15 on E. coli.13
Figure 6.

Typical single-cell measurements of CellROX* fluorescence intensity (green) and cell length (black) following addition of MM63:CHx37 to WT-ppGFP cells at t = 0. (A) 1.2X MIC and (B) 0.6X MIC. In panel A, CM permeabilization likely occurs at t ~ 7 min, when length recovery ends. In panel B, CM permeabilization never occurs and cells recover growth. See Movie S5.
As a control, we carried out the CellROX Green assay at 15 μg/mL of MM63:CHx37 (0.6X the WT MIC, example in Fig. 6B). As in Fig. 5, the cell length shrinks immediately upon injection of the copolymer, and growth resumes after several minutes. The CellROX* intensity increases slightly during Phase 1 and then plateaus, as was observed at the higher copolymer concentration. However, there is no subsequent large increase in CellROX* intensity over the next 20 min. At 1.2X MIC, the mean of the peak CellROX* intensity was 200 ± 50 in arbitrary units (n = 20). At 0.6X MIC, the mean was four times smaller: 50 ± 20 (n = 17). Error estimates are ± one standard deviation of the mean in both cases.
Evidently strong CellROX* fluorescence occurs only for copolymer concentrations sufficiently high to induce CM permeabilization. Combined with the 8-fold increase in MIC under anaerobic conditions, the difference in CellROX* fluorescence between low and high copolymer concentrations strongly suggests that oxidative stress induced by the copolymer is a significant component of the growth-halting mechanism. We suspect that the copolymer is interfering with the electron transport chain, but the detailed mechanism is not clear.
Facile Passage of Highly Cationic Copolymer Across the Outer Membrane
In earlier work, we observed abrupt shrinkage of E. coli cell length and partial length recovery after addition of the natural AMPs LL-37 18 or Cecropin A 17 or the synthetic AMP CM15.13 However, the shrinkage typically began 1–2 min after addition of the antimicrobial peptide and was not accompanied by formation of plasmolysis spaces. The osmotic effects of the nylon-3 copolymer are evidently much stronger and occur much more rapidly than for any of the peptides, on a timescale of ~10 s. Evidently at least some components of the random copolymer mixture can penetrate the OM and enter the periplasm readily without permeabilizing the OM to GFP, which is retained in the periplasm.
This behavior is remarkable for such a highly cationic species (63% cationic subunits per chain, on average). We speculate that the copolymer chains, which presumably cannot fold to a compact conformation, may thread their way through OM channel proteins, such as TolC or OmpF. These channels are sufficiently large to accommodate an unfolded peptide chain,29,30 and so may well accommodate an unfolded nylon-3 chain as well. As precedent, we cite the clear structural evidence that the initial stage of attack of various colicins on E. coli involves insertion of an unfolded N-terminal region through these same outer membrane channels.29,30 Experiments on reconstituted channels could test this speculation.
Although the range of copolymers and natural antimicrobial peptides studied thus far by our time-resolved methods is limited, these antibacterial agents seem to share some common mechanistic features. Once a highly cationic agent crosses the OM and reaches the periplasm, cytoplasmic membrane permeabilization and the onset of oxidative stress occur rapidly. To aid the design of new agents, it would be useful to develop a multi-well, time-resolved, fluorescence-based assay that senses rapid translocation of the agent across the outer membrane. The CellROX Green assay may prove useful in that context.
“K+ Poisoning” of the Cytoplasm as Possible Growth-Halting Mechanism?
Phase 2 of the copolymer attack on E. coli is characterized by partial recovery of the original GFP periplasmic spatial distribution and of the cell length. Evidently the cell is regaining some of the turgor pressure lost during the initial hyperosmotic shock. This phase requires active respiration, as non-respiring cells did not recover in length (Fig. 4). The first response of E. coli to hyperosmotic shock is the active import of K+.31 This response begins on a sub-minute timescale, so we suggest that the partial recovery of turgor pressure after the initial polymer attack is driven primarily by K+ import. The lack of recovery in non-respiring cells is consistent, because K+ import relies on the pmf and ATP.25–28 As shown by Huang and co-workers,22 cell wall synthesis and accumulation of peptidoglycan may well continue during hyperosmotic shock. We suggest that “storage” of excess cell wall during Phase 1 may enable the observed abrupt, partial length recovery as the turgor pressure is partially restored and the cell “re-inflates” (Figs. 2 and 4).
The hypothesis that K+ accumulation underlies the initial length recovery is indirectly supported by the behavior of the ΔproP strain. At 0.6X WT MIC, which is more than twice the MIC of the ΔproP strain, both WT and ΔproP partially recover length at a similar rate for the first few minutes after the shrinkage (Fig. 5). Both strains have functional potassium transporters, and the cytoplasmic membrane remains intact throughout. However, only the WT strain subsequently recovers proper growth, achieving lengths greater than that at t = 0. The ΔproP strain recovers part of its original length but does not achieve normal growth. We conjecture that the inability to replace K+ by neutral osmoprotectants, due to the absence of ProP, prevents a return to normal growth. The resulting “K+ poisoning” may well prevent proper function of essential biological processes involving protein-nucleic binding, including transcription and translation.32,33
Two other osmoprotectant importers, ProU and BetT, are known in addition to ProP.31 However, these two are expressed significantly only in cells adapted for growth in medium of high osmolality, a condition not met by our growth medium. There would not be sufficient time to change the transcription profile (i.e., to upregulate ProU and/or BetT) before the purported K+ poisoning event shuts down transcription. In addition, when ΔproP cells were rinsed in fresh growth medium after treatment with 0.6 WT MIC of copolymer, normal growth did not resume. This is consistent with the hypothesis that these cells have no way of resolving the accumulation of excess K+. However, we emphasize that K+ poisoning as a growth-halting mechanism is quite speculative at present.
Anionic Lipids as Target for Cationic Peptide?
The behavior of cephalexin-treated cells shows that the permeabilization event is localized near one cell pole (Fig. 3). The reason for this localization is unclear. The cytoplasmic endcaps are known to concentrate anionic lipids, including cardiolipin (CL) and phosphatidylglycerol (PG).34 The highly cationic copolymer might well interact particularly strongly with such lipids. Why does permeabilization to GFP occur only at one endcap? Substantial turgor pressure still remains just before the CM permeabilization event. One possibility is that this residual turgor pressure assists permeabilization. Once GFP-sized species can equilibrate their concentrations across the CM, this residual turgor has diminished.
Summary
The new data reported here reveal multiple growth-halting effects after addition of the sequence- and stereo-random nylon-3 copolymer MM63:CHx37 to E. coli. The direct observations are summarized in the schematic of Fig. 7. On a timescale of seconds, the copolymer readily traverses the OM without permeabilizing this membrane to periplasmic GFP. The evidence from the ΔproP mutant strain suggests that the periplasmic osmotic upshift caused by the copolymer and its counterions in and of itself would be sufficient to abruptly halt growth were it not for the natural osmotic recovery mechanisms. Permeabilization of the CM to GFP evidently marks the point of no return to normal cell growth. Once CM permeabilization has occurred, we never observe subsequent growth recovery. This irreversibility may be due to loss of the pmf and to loss of ATP and other key small molecules from the cytoplasm. CM permeabilization is also the moment of the onset of strong oxidative stress, as evidenced by the concomitant increase in CellROX* fluorescence (Fig. 6). The 8-fold increase in MIC under anaerobic conditions compared with aerobic conditions provides further evidence for the importance of oxidation-mediated events. Oxidative damage is evidently crucial to the bacteriostatic potency of the copolymer in aerobic conditions. The evidence for generalized hyperosmotic and oxidative damage mechanisms is strong. However, our observations do not rule out the possibility that the copolymer might also disrupt other, more specific biochemical processes, such as cell wall biosynthesis or transcription or translation.5 We have not tested for long-term bactericidal action of the copolymer, although it seems highly unlikely that cells could recover from the membrane permeabilization and oxidative damage events observed here.
Figure 7.
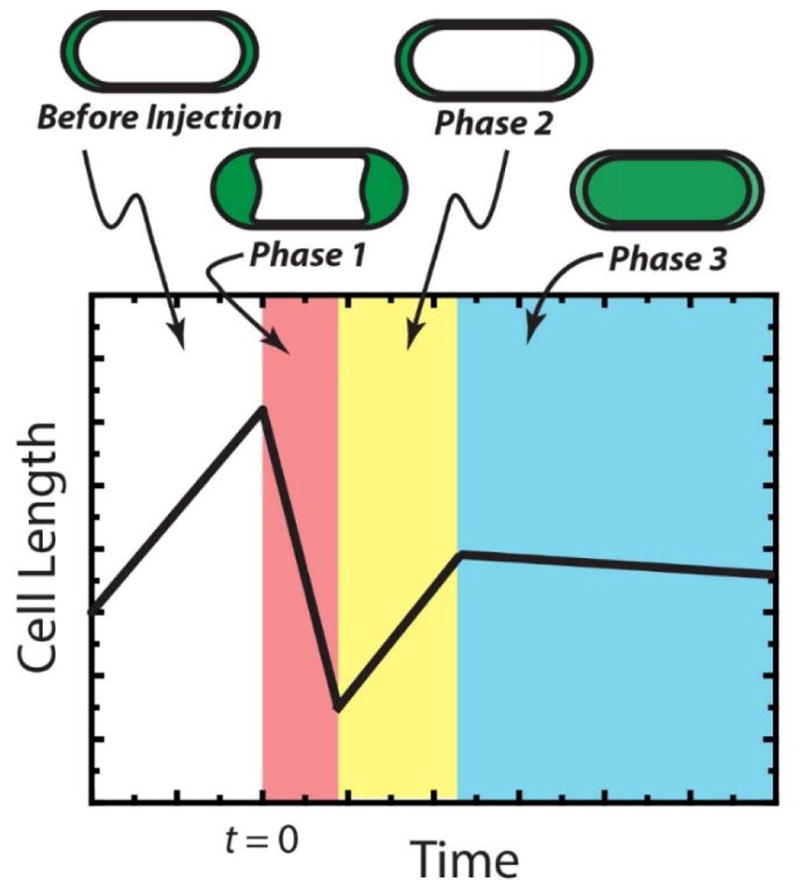
Schematic of the observed sequence of events after addition of MM63:CHx37 to WT-ppGFP cells at 1.2X MIC. Phase 1: periplasmic “bubbles” and cell shrinkage; halting of cell growth. Phase 2: partial osmotic recovery. Phase 3: Permeabilization of cytoplasmic membrane. Duration of the three phases varies widely from cell to cell. See text for more details.
The multi-pronged nature of the attack of the nylon-3 copolymer on E. coli is reminiscent of the effects of natural and synthetic antimicrobial peptides.1,35 What distinguishes the copolymer from the AMPs we have studied thus far is the copolymer’s ability to traverse the OM so rapidly, within seconds of injection. The resulting influx of copolymer and its counterions causes an unusually large and abrupt hyperosmotic upshift within the periplasm. Additional deleterious effects follow within several minutes. Future work will attempt to elucidate what specific polymeric properties underlie this ability to translocate so readily across the outer membrane of Gram negative species, which is critical for effective bacteriostatic action.
METHODS
The nylon-3 copolymer MM63:CHx37 (Fig. 1) was synthesized as before10,12 from racemic β-lactams, making each polymer heterochiral. Polymer samples had average chain length of 35 subunits. The polydispersity index (PDI) value was 1.10. Details of the four bacterial strains used (Table 1) are given in SI. All cultures were grown in EZ rich, defined medium (EZRDM)36 to minimize background fluorescence. The MIC for different strains (Table 1, Fig. S1) was determined using a broth microdilution method, described elsewhere.37 All experiments were carried out at 30°C. For microscopy experiments, cells were harvested from mid-log phase and plated on a polylysine-coated coverslip, which formed the base of a microfluidics chamber. Plated cells grow normally in a constant flow of aerated medium. Time-lapse imaging details are provided in SI. We typically alternate phase contrast and green fluorescence images at 6-s intervals for the duration of a movie, up to 60 min in total length.
Supplementary Material
Acknowledgments
Research reported in this publication was supported by the National Institute of General Medical Sciences of the National Institutes of Health under Award Number R01GM094510 (to JCW as PI) and R01GM093265 (to JCW and SHG as co-PIs). The content is solely the responsibility of the authors and does not necessarily represent the official views of the National Institutes of Health.
Footnotes
Supporting Information
Additional methodological details. Figure S1: MIC measurements. Figure S2: Further examples of single-cell length vs time results. Figure S3: Two examples of multiple cycles of cell shrinkage and partial recovery. Movie S1: WT cells at 1.2X MIC. Movie S2: Multiple cycles of cell shrinkage and partial recovery. Movie S3: WT cells at 0.6X MIC. Movie S4: Permeabilization of CM at one endcap. Movie S5: WT cell at 1.2X MIC with CellROX* fluorescence. Additional supporting movie details.
Notes
The authors declare no competing financial interest.
References
- 1.Hancock RE, Sahl HG. New strategies and compounds for anti-infective treatment. Curr Opin Microbiol. 2013;16:519–521. doi: 10.1016/j.mib.2013.08.004. [DOI] [PubMed] [Google Scholar]
- 2.Afacan NJ, Yeung AT, Pena OM, Hancock RE. Therapeutic potential of host defense peptides in antibiotic-resistant infections. Curr Pharma Design. 2012;18:807–819. doi: 10.2174/138161212799277617. [DOI] [PubMed] [Google Scholar]
- 3.Zasloff M. Antimicrobial peptides of multicellular organisms. Nature. 2002;415:389–395. doi: 10.1038/415389a. [DOI] [PubMed] [Google Scholar]
- 4.Gallo RL, Hooper LV. Epithelial antimicrobial defence of the skin and intestine. Nat Rev Immunology. 2012;12:503–516. doi: 10.1038/nri3228. [DOI] [PMC free article] [PubMed] [Google Scholar]
- 5.Guilhelmelli F, Vilela N, Albuquerque P, da Derengowski LS, Silva-Pereira I, Kyaw CM. Antibiotic development challenges: the various mechanisms of action of antimicrobial peptides and of bacterial resistance. Front Microbiol. 2013;4:353. doi: 10.3389/fmicb.2013.00353. [DOI] [PMC free article] [PubMed] [Google Scholar]
- 6.Brogden KA. Antimicrobial peptides: pore formers or metabolic inhibitors in bacteria? Nat Rev Microbiol. 2005;3:238–250. doi: 10.1038/nrmicro1098. [DOI] [PubMed] [Google Scholar]
- 7.Liu R, Chen X, Chakraborty S, Lemke JJ, Hayouka Z, Chow C, Welch RA, Weisblum B, Masters KS, Gellman SH. Tuning the Biological Activity Profile of Antibacterial Polymers via Subunit Substitution Pattern. JACS. 2014;136:4410–4418. doi: 10.1021/ja500367u. [DOI] [PMC free article] [PubMed] [Google Scholar]
- 8.Chakraborty S, Liu R, Hayouka Z, Chen X, Ehrhardt J, Lu Q, Burke E, Yan Y, Weisblum B, Wong GCL, Masters KS, Gellman SH. Ternary Nylon-3 Copolymers as Host-Defense Peptide Mimics: Beyond Hydrophobic and Cationic Subunits. JACS. 2014;136:14530–14535. doi: 10.1021/ja507576a. [DOI] [PMC free article] [PubMed] [Google Scholar]
- 9.Chakraborty S, Liu R, Lemke JJ, Hayouka Z, Welch RA, Weisblum B, Masters KS, Gellman SH. Effects of Cyclic vs Acyclic Hydrophobic Subunits on the Chemical Structure and Biological Properties of Nylon-3 Copolymers. ACS Macro Lett. 2013;2:753–756. doi: 10.1021/mz400239r. [DOI] [PMC free article] [PubMed] [Google Scholar]
- 10.Mowery BP, Lindner AH, Weisblum B, Stahl SS, Gellman SH. Structure-activity Relationships among Random Nylon-3 Copolymers That Mimic Antibacterial Host-Defense Peptides. JACS. 2009;131:9735–9745. doi: 10.1021/ja901613g. [DOI] [PubMed] [Google Scholar]
- 11.Epand RF, Mowery BP, Lee SE, Stahl SS, Lehrer RI, Gellman SH, Epand RM. Dual Mechanism of Bacterial Lethality for a Cationic Sequence-Random Copolymer that Mimics Host-Defense Antimicrobial Peptides. J Mol Biol. 2008;379:38–50. doi: 10.1016/j.jmb.2008.03.047. [DOI] [PubMed] [Google Scholar]
- 12.Mowery BP, Lee SE, Kissounko DA, Epand RF, Epand RM, Weisblum B, Stahl SS, Gellman SH. Mimicry of antimicrobial host-defense peptides by random copolymers. JACS. 2007;129:15474–15475. doi: 10.1021/ja077288d. [DOI] [PubMed] [Google Scholar]
- 13.Choi H, Yang Z, Weisshaar JC. Single-cell, real-time detection of oxidative stress induced in Escherichia coli by the antimicrobial peptide CM15. PNAS USA. 2015;112:E303–E310. doi: 10.1073/pnas.1417703112. [DOI] [PMC free article] [PubMed] [Google Scholar]
- 14.Bakshi S, Choi H, Rangarajan N, Barns KJ, Bratton BP, Weisshaar JC. Nonperturbative Imaging of Nucleoid Morphology in Live Bacterial Cells during an Antimicrobial Peptide Attack. Appl Env Microbiol. 2014;80:4977–4986. doi: 10.1128/AEM.00989-14. [DOI] [PMC free article] [PubMed] [Google Scholar]
- 15.Bakshi S, Choi H, Mondal J, Weisshaar JC. Time-dependent effects of transcription- and translation-halting drugs on the spatial distributions of the Escherichia coli chromosome and ribosomes. Mol Microbiol. 2014;94:871–887. doi: 10.1111/mmi.12805. [DOI] [PMC free article] [PubMed] [Google Scholar]
- 16.Barns KJ, Weisshaar JC. Real-time attack of LL-37 on single Bacillus subtilis cells. Biochim Biophys Acta-Biomembr. 2013;1828:1511–1520. doi: 10.1016/j.bbamem.2013.02.011. [DOI] [PMC free article] [PubMed] [Google Scholar]
- 17.Rangarajan N, Bakshi S, Weisshaar JC. Localized permeabilization of E coli membranes by the antimicrobial peptide Cecropin A. Biochemistry. 2013;52:6584–6594. doi: 10.1021/bi400785j. [DOI] [PMC free article] [PubMed] [Google Scholar]
- 18.Sochacki KA, Barns KJ, Bucki R, Weisshaar JC. Real-time attack on single Escherichia coli cells by the human antimicrobial peptide LL-37. PNAS USA. 2011;108:E77–E81. doi: 10.1073/pnas.1101130108. [DOI] [PMC free article] [PubMed] [Google Scholar]
- 19.Lee MW, Chakraborty S, Schmidt NW, Murgai R, Gellman SH, Wong GCL. Two interdependent mechanisms of antimicrobial activity allow for efficient killing in nylon-3-based polymeric mimics of innate immunity peptides. Biochim Biophys Acta-Biomembr. 2014;1838:2269–2279. doi: 10.1016/j.bbamem.2014.04.007. [DOI] [PMC free article] [PubMed] [Google Scholar]
- 20.Sochacki KA, Shkel IA, Record MT, Weisshaar JC. Protein Diffusion in the Periplasm of E. coli under Osmotic Stress. Biophys J. 2011;100:22–31. doi: 10.1016/j.bpj.2010.11.044. [DOI] [PMC free article] [PubMed] [Google Scholar]
- 21.Pilizota T, Shaevitz JW. Plasmolysis and Cell Shape Depend on Solute Outer-Membrane Permeability during Hyperosmotic Shock in E. coli. Biophys J. 2013;104:2733–2742. doi: 10.1016/j.bpj.2013.05.011. [DOI] [PMC free article] [PubMed] [Google Scholar]
- 22.Rojas E, Theriot JA, Huang K. The response of bacterial growth rate to osmotic shock. PNAS USA. 2014;111:7807–7812. doi: 10.1073/pnas.1402591111. [DOI] [PMC free article] [PubMed] [Google Scholar]
- 23.MacMillan SV, Alexander DA, Culham DE, Kunte HJ, Marshall EV, Rochon D, Wood JM. The ion coupling and organic substrate specificities of osmoregulatory transporter ProP in Escherichia coli. Biochim Biophys Acta-Biomembr. 1999;1420:30–44. doi: 10.1016/s0005-2736(99)00085-1. [DOI] [PubMed] [Google Scholar]
- 24.Wilks JC, Slonczewski JL. pH of the cytoplasm and periplasm of Escherichia coli: Rapid measurement by green fluorescent protein fluorimetry. J Bacteriol. 2007;189:5601–5607. doi: 10.1128/JB.00615-07. [DOI] [PMC free article] [PubMed] [Google Scholar]
- 25.Trchounian A, Kobayashi H. Kup is the major K+ uptake system in Escherichia coli upon hyper-osmotic stress at a low pH. FEBS Lett. 1999;447:144–148. doi: 10.1016/s0014-5793(99)00288-4. [DOI] [PubMed] [Google Scholar]
- 26.Rhoads DB, Epstein W. Energy coupling to net K+ transport in Escherichia coli K-12. J Biol Chem. 1977;252:1394–1401. [PubMed] [Google Scholar]
- 27.Siebers A, Altendorf K. Characterization of the phosphorylated intermediate of the K+-translocating KDP-ATPase from Escherichia coli. J Biol Chem. 1989;264:5831–5838. [PubMed] [Google Scholar]
- 28.Buurman ET, Kim KT, Epstein W. Genetic evidence for two sequentially occupied K+ binding sites in the KDP transport ATPase. J Biol Chem. 1995;270:6678–6685. doi: 10.1074/jbc.270.12.6678. [DOI] [PubMed] [Google Scholar]
- 29.Spector J, Zakharov S, Lill Y, Sharma O, Cramer WA, Ritchie K. Mobility of BtuB and OmpF in the Escherichia coli outer membrane: implications for dynamic formation of a translocon complex. Biophys J. 2010;99:3880–3886. doi: 10.1016/j.bpj.2010.10.029. [DOI] [PMC free article] [PubMed] [Google Scholar]
- 30.Housden NG, Hopper JTS, Lukoyanova N, Rodriguez-Larrea D, Wojdyla JA, Klein A, Kaminska R, Bayley H, Saibil HR, Robinson CV, Kleanthous C. Intrinsically Disordered Protein Threads Through the Bacterial Outer-Membrane Porin OmpF. Science. 2013;340:1570–1574. doi: 10.1126/science.1237864. [DOI] [PMC free article] [PubMed] [Google Scholar]
- 31.Wood JM. Bacterial responses to osmotic challenges. J Gen Physiol. 2015;145:381–388. doi: 10.1085/jgp.201411296. [DOI] [PMC free article] [PubMed] [Google Scholar]
- 32.Richey B, Cayley DS, Mossing MC, Kolka C, Anderson CF, Farrar TC, Record MT. Variability of the Intracellular Ionic Environment of Escherichia coli - Differences between In vitro and In vivo Effects of Ion Concentrations on Protein-DNA Interactions and Gene Expression. J Biol Chem. 1987;262:7157–7164. [PubMed] [Google Scholar]
- 33.Record MT, Jr, Anderson CF, Mills P, Mossing M, Roe JH. Ions as regulators of protein-nucleic acid interactions in vitro and in vivo. Adv Biophys. 1985;20:109–135. doi: 10.1016/0065-227x(85)90033-4. [DOI] [PubMed] [Google Scholar]
- 34.Oliver PM, Crooks JA, Leidl M, Yoon EJ, Saghatelian A, Weibel DB. Localization of Anionic Phospholipids in Escherichia coli Cells. J Bacteriol. 2014;196:3386–3398. doi: 10.1128/JB.01877-14. [DOI] [PMC free article] [PubMed] [Google Scholar]
- 35.Hancock REW, Sahl HG. Antimicrobial and host-defense peptides as new anti-infective therapeutic strategies. Nat Biotech. 2006;24:1551–1557. doi: 10.1038/nbt1267. [DOI] [PubMed] [Google Scholar]
- 36.Neidhardt FC, Bloch PL, Smith DF. Culture medium for enterobacteria. J Bacteriol. 1974;119:736–747. doi: 10.1128/jb.119.3.736-747.1974. [DOI] [PMC free article] [PubMed] [Google Scholar]
- 37.Choi H, Chakraborty S, Liu R, Gellman SH, Weisshaar JC. Medium Effects on Minimum Inhibitory Concentrations of Nylon-3 Polymers against E. coli. PLoS One. 2014;9 doi: 10.1371/journal.pone.0104500. [DOI] [PMC free article] [PubMed] [Google Scholar]
Associated Data
This section collects any data citations, data availability statements, or supplementary materials included in this article.