

Abstract
Objectives
OZ439, or artefenomel, is an investigational synthetic ozonide antimalarial with similar potency, but a significantly improved pharmacokinetic profile, compared with artemisinins. We wished to measure key pharmacokinetic and pharmacodynamic parameters and the pharmacokinetic/pharmacodynamic relationship of artefenomel in humans to guide the drug's further development as combination therapy in patients.
Patients and methods
We tested artefenomel in the human induced blood-stage malaria (IBSM) model. Plasmodium infection was monitored by quantitative PCR (qPCR) and upon reaching 1000 parasites/mL single doses of 100, 200 and 500 mg of artefenomel were administered orally with evaluation of drug exposure and parasitaemia until rescue treatment after 16 days or earlier, if required.
Results
A single 100 mg dose had only a transient effect, while the 200 mg dose resulted in a significant reduction in parasitaemia before early recrudescence. At the highest (500 mg) dose, initial clearance of parasites below the limit of detection of qPCR was observed, with a 48 h parasite reduction ratio (PRR48) >10 000 and a parasite clearance half-life of 3.6 h (95% CI 3.4–3.8 h). However, at this dose, recrudescence was seen in four of eight subjects 6–10 days after treatment. Pharmacokinetic/pharmacodynamic modelling predicted an MIC of 4.1 ng/mL.
Conclusions
These results confirm the antimalarial potential of artefenomel for use in a single-exposure combination therapy. The observations from this study support and will assist further clinical development of artefenomel.
Introduction
Following the ill-fated efforts to eradicate malaria in the 1960s that were followed by antimalarial drug resistance and mosquito resistance to insecticides, the WHO has again declared malaria control a global development priority and has changed its recommendation from control to elimination.1 The currently recommended first-line therapy for malaria is artemisinin-based combination therapy (ACT). However, emergence of artemisinin resistance, manifested initially as slowed parasite clearance, is being increasingly reported across the Greater Mekong Subregion2–4 and in Myanmar,5 associated with mutations in the PF3D7_1343700 kelch13 gene.6–8
A steady stream of new drugs is needed to permit elimination and deal with artemisinin resistance.9–12 Artefenomel is a synthetic trioxolane under development that has potential value as a novel antimalarial agent;13–15 it was recently tested in Phase I14 to Phase II clinical trials.16 Based on the favourable safety and pharmacokinetics (PK) observed in the earlier Phase I study,14 we conducted a study to characterize the artefenomel PK and pharmacodynamic (PD) parameters in healthy volunteers following infection with blood-stage Plasmodium falciparum parasites and assess artefenomel tolerability (secondary outcome).
Recently, we have developed a new clinical trial model, induced blood-stage malaria (IBSM), that involves healthy volunteers who are inoculated intravenously with infected erythrocytes, allowing testing of antimalarial drugs with activity against rapidly proliferating, asexual erythrocytic stages of the parasite. In this model, key drug efficacy parameters can be safely assessed at low, synchronized parasitaemic densities. The model has been used for established drugs such as mefloquine and these results were found to accurately mirror drug efficacy in patients.17,18
To define and model the key PK/PD parameters of artefenomel administered orally as a single dose, this study was designed to explore its antimalarial activity in at least three doses administered as a single oral dose, starting with 100 mg.
Methods
Study plan
An open-label, single-centre, controlled study was undertaken following methods previously described,17 and detailed in the Supplementary data available at JAC Online. Briefly, following a 4 week screening period, volunteers were inoculated with ∼1800 viable P. falciparum-infected human erythrocytes. Upon reaching a threshold of 1000 parasites/mL as estimated by qPCR,19 participants were admitted to the study unit and confined for 48 h for administration of artefenomel as a single dose, determination of parasitaemia and drug levels, and safety monitoring. Single oral doses of 100, 200 and 500 mg of artefenomel were administered to eight subjects in three cohorts. The PCR assay measured the 18S rRNA gene, thus detecting all parasite stages. If clinically well at the end of the 48 h confinement period, participants were discharged and monitored on an outpatient basis for safety, artefenomel plasma levels and parasitaemia. Parasitaemia was followed for up to 16 days before compulsory commencement of treatment with artemether/lumefantrine (Riamet®). Early intervention occurred if either poor response to artefenomel or fast recrudescence was seen. The study was designed to be conducted in three sequential cohorts (n = 8), with a starting dose of 100 mg of artefenomel and doses of 200 mg and 500 mg in subsequent cohorts. Artefenomel (mesylate) was administered in ∼200 mL of suspension with 0.8% polysorbate aqueous solution and Orasweet® after the participant had drunk 200 mL of full-cream milk. Sampling for parasitaemia (qPCR) was done each morning from day 3 post-inoculation and twice daily (morning and evening) until subjects reached the 1000 parasites/mL threshold. After artefenomel administration, blood samples were taken at 2, 4, 8, 12, 24, 30, 36, 48, 60, 72, 84, 96, 108, 120, 132 and 144 h, on the three mornings following the first Riamet® dose and then at the end-of-study visit. Plasma concentration of artefenomel was measured by UPLC-MS/MS.14
Pharmacometric analysis
A mixed-effects PK model using a two-compartmental disposition, with first-order absorption, a lag time and dose-dependent clearance was found to fit the data well. Non-compartmental PK analyses were performed using WinNonlin® (Pharsight, Cary, USA) and NONMEM® (version 6; ICON plc, Dublin, Ireland). PD analysis of parasite reduction ratio (PRR) and parasite clearance half-life was undertaken as previously described.18 In brief, the decay rate (slope coefficient from the log-linear decay regression) for each individual was calculated and then the weighted average slope and corresponding standard error were calculated using the inverse variance method.
The minimal parasiticidal concentration (MPC) and MIC were estimated from PK/PD model parameters. A PK/PD modelling approach was undertaken as outlined previously.20,21 In a subsequent step, the subject-specific concentration–time profiles were linked to the parasitaemia response in the PK/PD model, thereby relating the reduction in parasitaemia over time to the effect of the drug. Details of the structural form of the PK/PD model are provided in the Supplementary data.
Model-based simulations were performed to predict the probability of treatment success (cure) for different doses of artefenomel. Treatment success was defined as complete parasite clearance, numerically defined as the parasite count in blood decreasing below the pre-defined threshold of 0.003 parasites/mL, any time between 0 and 28 days after drug administration. This threshold, well below the limit of detection or symptoms, is an operational (statistical) concept associated with a risk of recrudescence. Treatment success in a simulated subject was therefore achieved when the subject had a decrease in parasitaemia below the recrudescence cut-off of 0.003 parasites/mL. For each simulated dose, response was simulated for 1000 subjects and the probability of cure was calculated as the percentage of patients whose parasitaemia descended below the threshold. The uncertainty in the expected probability of cure was included in the simulations by simulating 200 replicates, where, for each replicate, model parameters were re-sampled from the variance–covariance matrix of the estimated model parameters for both the PK and the PK/PD model. These simulations were based on an adopted artefenomel population PK model in patients (James S. McCarthy, Mark Baker, Peter O’Rourke, Louise Marquart, Paul Griffin and Jörg J. Möhrle, unpublished results). Figure S4, available as Supplementary data at JAC Online shows the simulated probability of cure after 28 days for various doses of artefenomel. The simulated expected probability of cure (95% CI) for artefenomel doses of 400, 500 and 800 mg were 0.11 (0.04–0.74), 0.15 (0.06–0.79) and 0.27 (0.13–0.87), respectively.
Safety assessments
Safety was assessed by recorded adverse events. See the Supplementary data for more details.
Ethical considerations
The study was conducted in accordance with the principles of the Declaration of Helsinki. It was approved by the QIMR Human Research Ethics Committee as QP12C10 Version 1.7, 18 December 2012; Addendum to PICF 25 January 2013 [Cohort 3]/IEC: QIMR-HREC, and registered on anzctr.org.au (registration number ACTRN12612000814875). All participating volunteers provided written consent.
Results
Fifty volunteers were screened and 24 (eight per cohort) were enrolled and completed the study (see Table S1 for details). No enrolled participants withdrew during the study. At least one adverse event was reported for 23 out of the 24 participants (173 events in total). Of the 116 events deemed probably related to study treatment, 115 were considered probably related to the inoculum (i.e. malaria) and one probably related to the Riamet® rescue treatment. There were no events considered probably related to artefenomel; no deaths or serious adverse events occurred during the study (see Table S2 for details). Artefenomel showed an acceptable safety profile. However, at the lower, non-curative 100 and 200 mg doses, adverse events attributable to malaria due to the drug's failure to clear the parasitaemia were common.
PK
The median artefenomel exposure in plasma across volunteers following administration of the three dose levels is shown in Figure 1. Dose normalization indicated that clearance of artefenomel from the 500 mg dose was lower than for the 100 and 200 mg doses. The 100 and 200 mg cohorts had overlaying dose-normalized PK (Table 1), but the 500 mg cohort had slower kinetics (Figure 1). There was a significant (P < 0.001) linear relationship between the log-normalized dose and log-normalized variables (Cmax or AUC0–144), with regression coefficients of 1.51 (95% CI 1.49–1.53) and 1.14 (95% CI 1.11–1.17), respectively (Figure S1A and B). Both relationships were supra-proportional (see the Supplementary data for an overview of included covariates). Similarly, CL/F (where F is relative bioavailability; Figure S1C) decreased with dose in a log-linear fashion with regression coefficient −0.54 (95% CI −0.73 to −0.36). Table 1 lists the non-compartmental parameters for each dose administered. The visual predictive check (Figure S2) suggested that the variability in PK profiles was generally adequately captured by the global, two-compartment model. Table 2 shows the parameter estimates from this PK model.
Figure 1.
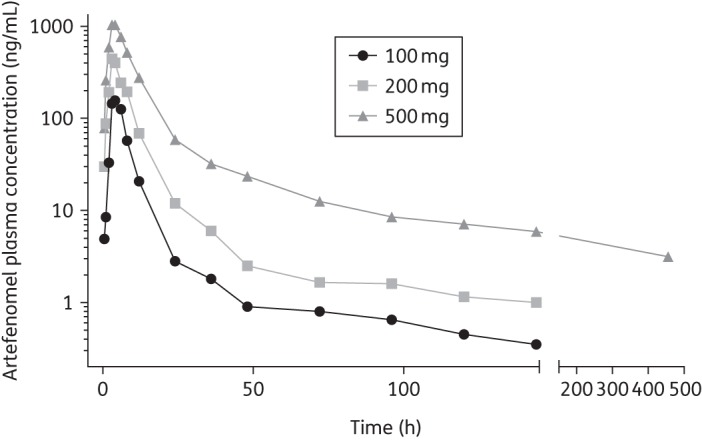
Median artefenomel plasma concentration following administration of 100, 200 or 500 mg at t = 0 (non-normalized; observation was extended only for the 500 mg cohort).
Table 1.
Non-compartmental analysis PK parameter estimates for artefenomel
| Dose (mg) | Estimate | Cmax (ng/mL) | Tmax (h) | AUC144 (h·ng/mL) | t1/2 (h) | AUClast (h·ng/mL) | AUC∞ (h·ng/mL) | CL/F (L/h) |
|---|---|---|---|---|---|---|---|---|
| 100 (cohort 1) | average | 167 | 4 | 1080 | 62 | 1080 | 1128 | 93 |
| geometric mean | 164 | NA | 1056 | 52 | 1056 | 1100 | 91 | |
| % coefficient of variation | 20 | NA | 23 | 65 | 23 | 25 | 25 | |
| 200 (cohort 2) | average | 468 | 4 | 3246 | 63 | 3246 | 3347 | 62 |
| geometric mean | 448 | NA | 3182 | 51 | 3182 | 3286 | 61 | |
| % coefficient of variation | 33 | NA | 21 | 84 | 21 | 21 | 21 | |
| 500 (cohort 3) | average | 1395 | 4 | 11 530 | 306 | 12 908 | 14 292 | 41 |
| geometric mean | 1263 | NA | 10 755 | 260 | 11 979 | 13 239 | 38 | |
| % coefficient of variation | 47 | NA | 40 | 63 | 42 | 43 | 43 |
The 500 mg AUClast was estimated through extrapolation until t = 456 h. NA, not analysed.
Table 2.
Population PK parameters of artefenomel in the human malaria challenge model
| Parameter | Population estimate (SE; % coefficient of variation) | Inter-individual variabilitya (SE) |
|---|---|---|
| Vc/F (L) | 189 (61–32%) | 0.269 (0.271) |
| Vp/F (L) | 1573 (177–11%) | 0.071 (0.08) |
| CL/F (L/h) | 40.9 (3.8–9%) | 0.064 (0.04) |
| Q/F (L/h) | 12.7 (2.0–16%) | not estimated |
| Ka (h−1) | 0.18 (0.023–13%) | not estimated |
| ALAGb (h) | 0.40 (0.03–8%) | 0.001 (0.001) |
| Dose on CL/Fc | 0.55 (0.11–20%) | not estimated |
SE, standard error; Vc, Vp, volume of distribution in the central and peripheral compartments.
aVariance of inter-individual random effects ηi.
bLag phase.
cCL/Fdose = CL/F0 × (dose/500)−0.55, where CL/F0 is the typical value of clearance.
Efficacy
Artefenomel reduced parasitaemia in subjects in an exposure-dependent manner (Figure 2). The 100 mg dose did not lead to a sufficient reduction in parasitaemia and intervention with Riamet® was required at 60 h, so no further PD analyses were undertaken for this cohort. A dose of 200 mg of artefenomel resulted in a short lag (an initial increase in parasitaemia) followed by a decrease in parasitaemia until recrudescence occurred after 60 h. A dose of 500 mg of artefenomel caused an immediate decrease in parasitaemia, falling below the detection level of the qPCR assay (10 parasites/mL). This dose was not curative in four of the eight subjects in this cohort, who experienced recrudescence of parasitaemia between days 6 and 10 after artefenomel treatment; all subjects required rescue treatment with Riamet®. Recrudescence did not occur in the remaining four subjects in the 500 mg-dosed cohort 3.
Figure 2.
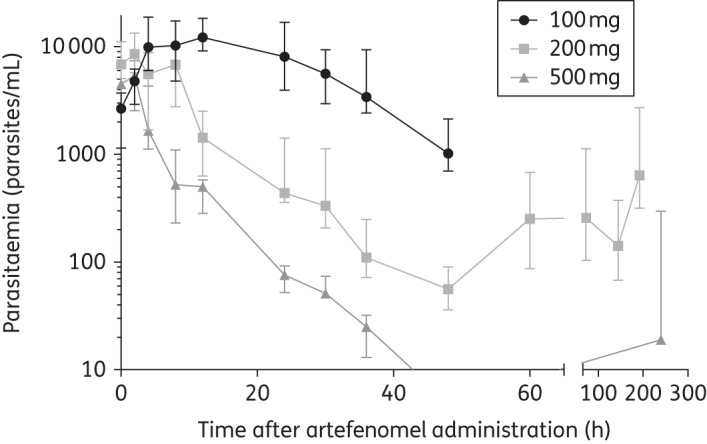
Median parasitaemia following artefenomel administration. Error bars indicate parasitaemia range.
Data from seven of the eight subjects in the 200 mg cohort and from all eight in the 500 mg dose cohort were used to calculate dose-specific PRR and half-life drug clearance estimates. The PRR estimates for the 200 and 500 mg doses were, respectively, 165 (95% CI 124–222) and 10 176 (95% CI 5757–17 986). The corresponding parasite half-lives were 6.5 h (95% CI 6.2–6.9 h) and 3.6 h (95% CI 3.4–3.8 h). There were significant differences between the parasite clearance rates of the 200 and 500 mg doses (P < 0.001), suggesting that the 500 mg dose effected a significantly higher parasite clearance rate. The individual subject PRR values and associated statistics for both the 200 and the 500 mg dose cohort are presented in Table S3 and Figure S3. The drug-induced reductions in parasitaemia were also determined using the WWARN calculator,22 as a sensitivity analysis. The individual and dose-specific PRR and parasite half-life results from the WWARN calculator were similar; details of the analysis and results are presented in Table S4.
The estimated PK/PD parameters are given in Table 3 and individual goodness-of-fit plots shown in Figure 3 for the 200 mg (Figure 3a) and 500 mg (Figure 3b) cohorts. Figure 3 represents observed and modelled exposure (green circles and dotted lines) and observed and modelled parasitaemia (red circles and lines). The exposure as observed corresponded well with the model. For the 200 mg cohort (Figure 3a), parasitaemia remained mostly above the threshold of detection (10 parasites/mL), resulting in a good prediction of the observed nadir of parasitaemia (blue/black vertical, dotted lines). At 500 mg dosing, however, (Figure 3b) parasitaemia dropped below the 10 parasites/mL detection limit for all subjects (pink circles) and it was not possible to assess the model/data fit (except for the participant numbered as ID = 17; Figure 3b) or to time the parasitaemia nadir (the black/blue dotted lines). Figure S4 shows the simulated probability of cure after 28 days for various doses of artefenomel. The simulated expected probability of cure (95% CI) for artefenomel doses of 400, 500 and 800 mg were 0.11 (0.04–0.74), 0.15 (0.06–0.79) and 0.27 (0.13–0.87), respectively. PK/PD modelling using data from all volunteers (Tables S5 and S6) resulted in an estimate of the MIC of 4.1 ng/mL. The 99% and 95% MPCs (MPC99% and MPC95%) were estimated at 60 and 26 ng/mL, respectively, indicating a substantial sensitivity of a small variation in the defined maximal effect resulting in a large shift in the required concentration.
Table 3.
Population PK/PD parameters for artefenomel in the human malaria challenge model
| Parameter | Description | Estimate (SE) | Inter-individual variability (SE; % coefficient of variation) |
|---|---|---|---|
| G (1/h) | parasite growth rate | 0.06 (fixed) | not estimated |
| D (1/h) | maximum parasite kill rate | 0.20 (0.015) | 0.017 (0.03–18%) |
| EC50 (ng/mL) | artefenomel concentration resulting in 50% of the maximum parasite kill rate | 6.19 (1.69) | 0.408 (0.45–110%) |
| H (–) | Hill coefficient (governing the sigmoidicity of the concentration–kill rate relationship) | 2.03 (1.02) | not estimated |
Figure 3.


Individual goodness-of-fits plots for parasitaemia and PK data in 200 mg (a) or 500 mg (b) artefenomel dosing. Red circles represent observed parasitaemia counts and the red line is the corresponding model prediction. Green circles show observed PK profiles and the green dotted line is the corresponding model prediction. The black and blue dashed vertical lines show the time at the lowest parasitaemia value for each subject as determined from observed data and model predictions, respectively. Parasitaemia measurements below the level of detection (violet circles) were set at their maximum value (10 parasites/mL); the actual range is indicated by the shaded area. ID, individual.
Discussion
Our study data confirmed that artefenomel is safe and well tolerated at doses that rapidly reduce parasitaemia. In regard to exposure, we found that the PK of artefenomel was not dose proportional, with decreasing clearance of the drug occurring as the dose was increased. In an earlier human study of artefenomel, dose proportionality was observed for the AUC0,∞ but not for Cmax.14 That study also noted a food effect for exposure, which may be caused by various mechanisms.23 The elimination half-life geometric mean after administration of 500 mg artefenomel was 260 (% coefficient of variation 63) h, whereas those for 100 and 200 mg were 52 (% coefficient of variation 65) and 51 (% coefficient of variation 84) h, respectively, a significant improvement over the ∼1 h half-life of artemisinins.24 Model-based analysis confirmed a two-compartment structure with dose-dependent rates of absorption and clearance. The PRR for the 500 mg dose was determined to be 104 and the parasite clearance half-life was 3.6 h (95% CI 3.4–3.8 h), comparable to the 2.2–2.5 h parasite half-life induced by multiple daily doses of artemisinin.25
The PK/PD model predicts an MIC of 4.1 ng/mL and the graphs in Figure 2 confirm that in most volunteers parasitaemia indeed decreased as long as artefenomel levels exceeded this threshold. Figure 1 shows that at a dose of 500 mg the MIC threshold should, on average, be exceeded for hundreds of hours. However, individual variability in exposure and small variations in initial parasitaemia resulted in recrudescence in four volunteers in this cohort. Figure 3(b) shows that the artefenomel exposure at the final data point was lowest for the four individuals who experienced recrudescence. Since the drug's half-life (slope of the green line) was not markedly different between individuals, the (limited) variation seen at the last data point probably reflects variation in absorption, an issue that may be overcome by improved formulation.
Testing multiple doses greatly enhanced the capacity to construct robust PK/PD models; the 200 mg dose had limited efficacy, but allowed the estimation of model parameters, because parasitaemia remained mostly well above the qPCR detection threshold. The 500 mg dose cohort permitted assessment of how exposure variation related to recrudescence. The PK/PD model suggests that the risk of recrudescence is a function of residual parasitaemia when drug exposure drops below the MIC. Recrudescence appears not to relate to an extended latency period for a small subset of parasites, or other confounding factors, which bodes well for the concept of curing malaria using a single-dosed medicine. This approach also paves the way for accurately testing potential partner drugs in this same model and using the combined PK/PD parameter set to predict successful regimens of combination therapies. Finally, data presented here provide a solid framework for how exposure variability could be improved to attain a predefined cure rate. Patients will typically have around 106–7 parasites/mL, but artefenomel is likely to be used with a partner drug that will help overcome the risk of recrudescence.
Artefenomel is a useful illustrative test case for the newly developed malaria challenge model and its potential to deliver critical data to guide further clinical development. The drug has efficacy similar to that of artemisinins yet has a significantly improved half-life of >24 h.14 This is a substantial improvement over the half-lives of other peroxide antimalarials (arterolane 2–4 h,26 artesunate 20–45 min,27 dihydroartemisinin 0.9–2 h28–30) and represents a major asset for a disease population where compliance is a concern, as reflected in antimalarial target compound profiles (TCPs).9 Artefenomel has previously been shown to be active in clinical malaria, causing a maximal rate of parasite clearance within 36 h following oral administration of 200 mg artefenomel.16
The human challenge model rests on the assumption that drug-mediated killing of parasites in humans is scale invariant. While there is some evidence that parasites can ‘sense’ their densities to help decide on their rate of conversion into gametocytes (previously reviewed31), quorum sensing mechanisms that directly affect parasite growth rates or drug susceptibility have so far not been reported for Plasmodium. The extent of fever, and other non-specific as well as adaptive immune responses by the host do increase in intensity with increasing parasite load and repeat infections and these may affect parasite proliferation rates. Fever may also modulate drug metabolism in some cases.32 Nevertheless, basic PD parameters of TCP1 drugs9 can be represented as a function of the drug's temporal concentration and its potency, and can be compared directly between the challenge model, where volunteers are treated at around 1000 parasites per mL, and malaria patients, where the parasite density is routinely over three orders of magnitude higher. Because a small number of subjects is required, a flexible challenge study with a design guided by Phase I PK data and in vitro/vivo potencies can rapidly generate valuable and accurate human PD parameters that will in turn help to guide (and de-risk) Phase II/III studies.
In summary, the presented study results confirm antimalarial potential of artefenomel for use in a single-exposure combination therapy. A single dose of 500 mg rapidly decreased parasitaemia in all eight subjects and prevented recrudescence in four, while parasitaemia recurred in four subjects between days 6 and 10 after treatment. Therefore, higher doses might be required in combination with a partner drug, if variability in exposure cannot be reduced, to ensure adequate artefenomel minimum plasma concentrations are maintained. Based on the results of this study it is possible to define a narrowed dose range that needs to be tested in further development to identify a combination therapy that meets regulatory and clinical efficacy and safety parameters.
Funding
This study was partly supported by the Wellcome Trust (grant reference number: 095909/Z/11/Z). J. S. M. was supported by a Government of Queensland Clinical Research Fellowship and a National Health and Medical Research Council Practitioner Fellowship.
Transparency declarations
None to declare.
Author contributions
J. S. M., P. O., L. M., P. G. and J. J. M. designed, conducted and oversaw the clinical trial. M. B. modelled and interpreted the results. L. M. was involved in the bioanalytical work. J. S. M., J. J. M. and R. H. v. H. interpreted the results and R. H. v. H. wrote the manuscript (first draft).
Supplementary data
Acknowledgements
We thank Dr T. N. C. Wells, Medicines for Malaria Venture, for critical evaluation and interpretation of the data and discussions for improving the manuscript (prior to submission). We are grateful to the volunteers who consented to participate in this study and the nurses and staff of the QIMR Berghofer, Brisbane, Queensland, Australia. We thank Dr John Maringwa and Dr Eugene Cox from Quantitative Solutions Inc. for PK/PD analyses. We thank Brett McWhinney for performing artefenomel drug assays, Professor Dennis Shanks for serving as Medical Monitor and Dr Silvana Sekuloski, Dr Katharine Trenholme, Dr Suzanne Elliott and Gem Mackenroth for assistance in execution of the study.
References
- 1.WHO. From Malaria Control to Malaria Elimination: A Manual for Elimination Scenario Planning. http://apps.who.int/iris/bitstream/10665/112485/1/9789241507028_eng.pdf.
- 2.Noedl H, Se Y, Schaecher K et al. . Evidence of artemisinin-resistant malaria in western Cambodia. N Engl J Med 2008; 359: 2619–20. [DOI] [PubMed] [Google Scholar]
- 3.Dondorp AM, Nosten F, Yi P et al. . Artemisinin resistance in Plasmodium falciparum malaria. N Engl J Med 2009; 361: 455–67. [DOI] [PMC free article] [PubMed] [Google Scholar]
- 4.Phyo AP, Nkhoma S, Stepniewska K et al. . Emergence of artemisinin-resistant malaria on the western border of Thailand: a longitudinal study. Lancet 2012; 379: 1960–6. [DOI] [PMC free article] [PubMed] [Google Scholar]
- 5.Tun KM, Imwong M, Lwin KM et al. . Spread of artemisinin-resistant Plasmodium falciparum in Myanmar: a cross-sectional survey of the K13 molecular marker. Lancet Infect Dis 2015; 15: 415–21. [DOI] [PMC free article] [PubMed] [Google Scholar]
- 6.Ariey F, Witkowski B, Amaratunga C et al. . A molecular marker of artemisinin-resistant Plasmodium falciparum malaria. Nature 2014; 505: 50–5. [DOI] [PMC free article] [PubMed] [Google Scholar]
- 7.Mbengue A, Bhattacharjee S, Pandharkar T et al. . A molecular mechanism of artemisinin resistance in Plasmodium falciparum malaria. Nature 2015; 520: 683–7. [DOI] [PMC free article] [PubMed] [Google Scholar]
- 8.Burrows J. Microbiology: malaria runs rings round artemisinin. Nature 2015; 520: 628–30. [DOI] [PubMed] [Google Scholar]
- 9.Burrows JN, Hooft van Huijsduijnen R, Möhrle JJ et al. . Designing the next generation of medicines for malaria control and eradication. Malar J 2013; 12: 187. [DOI] [PMC free article] [PubMed] [Google Scholar]
- 10.Snow RW. Global malaria eradication and the importance of Plasmodium falciparum epidemiology in Africa. BMC Med 2015; 13: 23. [DOI] [PMC free article] [PubMed] [Google Scholar]
- 11.Wells TNC, Hooft van Huijsduijnen R, Van Voorhis WC. Malaria medicines: a glass half full? Nat Rev Drug Discov 2015; 14: 424–42. [DOI] [PubMed] [Google Scholar]
- 12.Diagana TT. Supporting malaria elimination with 21st century antimalarial agent drug discovery. Drug Discov Today 2015; 20: 1265–70. [DOI] [PubMed] [Google Scholar]
- 13.Charman SA, Arbe-Barnes S, Bathurst IC et al. . Synthetic ozonide drug candidate OZ439 offers new hope for a single-dose cure of uncomplicated malaria. Proc Natl Acad Sci USA 2011; 108: 4400–5. [DOI] [PMC free article] [PubMed] [Google Scholar]
- 14.Moehrle JJ, Duparc S, Siethoff C et al. . First-in-man safety and pharmacokinetics of synthetic ozonide OZ439 demonstrates an improved exposure profile relative to other peroxide antimalarials. Br J Clin Pharmacol 2013; 75: 524–37. [DOI] [PMC free article] [PubMed] [Google Scholar]
- 15.Wang X, Dong Y, Wittlin S et al. . Comparative antimalarial activities and ADME profiles of ozonides (1,2,4-trioxolanes) OZ277, OZ439, and their 1,2-dioxolane, 1,2,4-trioxane, and 1,2,4,5-tetraoxane isosteres. J Med Chem 2013; 56: 2547–55. [DOI] [PubMed] [Google Scholar]
- 16.Phyo AP, Jittamala P, Nosten FH et al. . Antimalarial activity of artefenomel (OZ439), a novel synthetic antimalarial endoperoxide, in patients with Plasmodium falciparum and Plasmodium vivax malaria: an open-label phase 2 trial. Lancet Infect Dis 2015; 16: 61–9. [DOI] [PMC free article] [PubMed] [Google Scholar]
- 17.McCarthy JS, Sekuloski S, Griffin PM et al. . A pilot randomised trial of induced blood-stage Plasmodium falciparum infections in healthy volunteers for testing efficacy of new antimalarial drugs. PLoS One 2011; 6: e21914. [DOI] [PMC free article] [PubMed] [Google Scholar]
- 18.Marquart L, Baker M, O'Rourke P et al. . Evaluating the pharmacodynamic effect of antimalarial drugs in clinical trials by quantitative polymerase chain reaction. Antimicrob Agents Chemother 2015; 59: 4249–59. [DOI] [PMC free article] [PubMed] [Google Scholar]
- 19.Rockett RJ, Tozer SJ, Peatey C et al. . A real-time, quantitative PCR method using hydrolysis probes for the monitoring of Plasmodium falciparum load in experimentally infected human volunteers. Malar J 2011; 10: 48. [DOI] [PMC free article] [PubMed] [Google Scholar]
- 20.White NJ. The parasite clearance curve. Malar J 2011; 10: 278. [DOI] [PMC free article] [PubMed] [Google Scholar]
- 21.White NJ. Pharmacokinetic and pharmacodynamic considerations in antimalarial dose optimization. Antimicrob Agents Chemother 2013; 57: 5792–807. [DOI] [PMC free article] [PubMed] [Google Scholar]
- 22.Flegg JA, Guerin PJ, White NJ et al. . Standardizing the measurement of parasite clearance in falciparum malaria: the parasite clearance estimator. Malar J 2011; 10: 339. [DOI] [PMC free article] [PubMed] [Google Scholar]
- 23.Lentz KA. Current methods for predicting human food effect. AAPS J 2008; 10: 282–8. [DOI] [PMC free article] [PubMed] [Google Scholar]
- 24.Gordi T, Huong DX, Hai TN et al. . Artemisinin pharmacokinetics and efficacy in uncomplicated-malaria patients treated with two different dosage regimens. Antimicrob Agents Chemother 2002; 46: 1026–31. [DOI] [PMC free article] [PubMed] [Google Scholar]
- 25.Alin MH, Ashton M, Kihamia CM et al. . Clinical efficacy and pharmacokinetics of artemisinin monotherapy and in combination with mefloquine in patients with falciparum malaria. Br J Clin Pharmacol 1996; 41: 587–92. [DOI] [PMC free article] [PubMed] [Google Scholar]
- 26.Gautam A, Ahmed T, Sharma P et al. . Pharmacokinetics and pharmacodynamics of arterolane maleate following multiple oral doses in adult patients with P. falciparum malaria. J Clin Pharmacol 2011; 51: 1519–28. [DOI] [PubMed] [Google Scholar]
- 27.Morris CA, Duparc S, Borghini-Fuhrer I et al. . Review of the clinical pharmacokinetics of artesunate and its active metabolite dihydroartemisinin following intravenous, intramuscular, oral or rectal administration. Malar J 2011; 10: 263. [DOI] [PMC free article] [PubMed] [Google Scholar]
- 28.Hong X, Liu CH, Huang XT et al. . Pharmacokinetics of dihydroartemisinin in Artekin tablets for single and repeated dosing in Chinese healthy volunteers. Biopharm Drug Dispos 2008; 29: 237–44. [DOI] [PubMed] [Google Scholar]
- 29.Le NH, Na-Bangchang K, Le TD et al. . Pharmacokinetics of a single oral dose of dihydroartemisinin in Vietnamese healthy volunteers. Southeast Asian J Trop Med Public Health 1999; 30: 11–6. [PubMed] [Google Scholar]
- 30.Tarning J, Kloprogge F, Piola P et al. . Population pharmacokinetics of artemether and dihydroartemisinin in pregnant women with uncomplicated Plasmodium falciparum malaria in Uganda. Malar J 2012; 11: 293. [DOI] [PMC free article] [PubMed] [Google Scholar]
- 31.Wacker MA, Turnbull LB, Walker LA et al. . Quantification of multiple infections of Plasmodium falciparum in vitro. Malar J 2012; 11: 180. [DOI] [PMC free article] [PubMed] [Google Scholar]
- 32.Kihara T, Toda A, Umesue I et al. . Effect of interleukin 1 β-induced fever on hepatic drug metabolism in rat. Xenobiotica 1998; 28: 559–69. [DOI] [PubMed] [Google Scholar]
Associated Data
This section collects any data citations, data availability statements, or supplementary materials included in this article.