

Abstract
Objectives
Altered brain iron homeostasis with regional iron deficiency has been previously reported in several studies of restless legs syndrome patients. Inconsistencies still exist, however, in the reported iron changes in different brain regions and different restless legs syndrome phenotypes. The purpose of this study was to assess differences in brain iron concentrations compared to healthy controls and their relation to disease severity and periodic limb movements during sleep in idiopathic restless legs syndrome patients.
Methods
Assessment of brain iron was done using quantitative magnetic susceptibility measurement, which has been shown to correlate well with tissue iron content in brain gray matter. Thirty-nine restless legs syndrome patients and 29 age-matched healthy controls were scanned at 7 Tesla. Magnetic susceptibilities in substantia nigra, thalamus, striatum and several iron-rich gray matter regions were quantified and compared with related clinical measures.
Results
Compared to healthy controls, restless legs syndrome patients showed significantly decreased magnetic susceptibility in the thalamus and dentate nucleus. No significant difference was found in the substantia nigra between restless legs syndrome patients and healthy controls, but a significant correlation was observed between magnetic susceptibility in substantia nigra and the periodic limb movements during sleep measure.
Conclusions
Using quantitative magnetic susceptibility as an in vivo indicator of brain iron content, the present study supports the general hypothesis of brain iron deficiency in restless legs syndrome and indicates its possible link to periodic limb movements during sleep.
Keywords: restless legs syndrome, brain iron deficiency, periodic limb movement during sleep, quantitative susceptibility mapping
1. Introduction
Restless legs syndrome is a sensorimotor disorder with a prevalence of 5–10% of the population [1]. It is characterized by unpleasant sensations mainly in the legs and an urge to move during sitting or resting in the later part of the day [2]. The exact pathophysiology of idiopathic RLS is still unclear, but previous studies suggest that an alteration in dopaminergic function and also in iron homeostasis are involved in the disease [3]. A general hypothesis of brain iron deficiency in RLS has been supported by previous CSF, brain autopsy and imaging studies [4–7]. Particularly, two studies of CSF in RLS patients found a decrease in the main iron storage protein (ferritin) along with an increase in transferrin even though the serum ferritin and transferrin levels did not differ significantly from healthy controls [4, 8]. Histological and immunoblot studies using brain autopsy tissues from RLS and controls also showed a decrease in iron and H-ferritin, but no difference in L-ferritin in the substantia nigra [5], in the epithelial cells in choroid plexus and in the brain microvasculature [9]. These autopsy findings indicated the presence of altered iron acquisition and utilization in the RLS brain. In vivo measurements of brain iron concentrations in RLS using MRI relaxometry [6, 7, 10–13], i.e. measuring the MR transverse relaxation rate R2, the effective transverse relaxation rate R2* or R2′(R2′=R2*-R2), and very recently using MR phase imaging [14] have supported the hypothesis of decreased brain iron in RLS.
Despite the commonly accepted general hypothesis of brain iron deficiency in RLS, discrepancies exist in available MR imaging studies on RLS in terms of the affected brain regions and possible changes in different RLS phenotypes. Among all the studies, SN is the most consistently reported region affected by possible iron deficiency in RLS [6, 7, 11–14], together with thalamus [10, 14]. Thus these areas were the primary ones analyzed in this study. The involvement of other brain regions in RLS related tissue iron changes still remains unclear and were therefore included in this study as secondary, exploratory areas of interest, i.e. red nucleus, cerebellar dentate nucleus, caudate nucleus, putamen, globus pallidus and thalamic pulvinar. In addition, brain iron changes in the two main RLS phenotypes, i.e. early-onset versus late-onset RLS, remain quite elusive. In one prior study using R2′ as a brain iron measure [7], lower brain iron content in the SN was found only in early-onset RLS patients but not in late-onset RLS patients. Some later studies, however, reported lower SN iron concentrations in late-onset RLS [11, 12], but not in early-onset RLS, either using R2 [15] or R2′[12]. Moreover, there is one study reporting no change in the MRI based iron index (R2* weighted signal intensity) in RLS [16] and another reporting increased iron index (R2) in early-onset RLS without medical treatment [15]. Besides biological variations, small sample sizes, uncertain differential diagnosis of RLS and controls, and possible treatment-induced brain iron changes [17], such discrepancies may be attributed to the different MRI techniques used for measuring tissue iron contents with different sensitivities and methodological limitations [18]. For example, it is known that R2 based relaxometry is affected by tissue water content that is not related to iron and R2* or R2′ may be contaminated by background field gradients. MR phase or field shift measures are nonlocal, meaning that they are affected by the susceptibility values of surrounding tissue, causing a dependence on subject’s head orientations relative to the magnetic field [19, 20]. In comparison, quantitative measurement of tissue magnetic susceptibility is believed to be a more accurate and probably more specific measure of tissue iron content, especially in gray matter. Recent development of quantitative susceptibility mapping techniques together with the availability of high field MRI have made it possible to directly map, with high spatial resolution (sub-millimeter), the brain tissue magnetic susceptibility [21–26], which has been shown to correlate well with tissue iron concentration in most brain gray matter regions [27–31].
The aim of the present study was to determine regional brain iron concentrations in RLS using quantitative susceptibility mapping (QSM) and to test possible correlations between measured brain tissue magnetic susceptibility and RLS clinical features.
2. Materials and Methods
2.1 Subjects
Thirty-nine consenting subjects with idiopathic RLS and 29 consenting age- and gender-matched healthy control subjects were recruited through the Center for Restless Legs Syndrome at the Johns Hopkins University School of Medicine. Subjects were excluded if they had significant medical or neurological disorders or were taking medications that would disturb sleep or if they had significant sleep disorders other than RLS, e.g. insomnia not related to RLS, narcolepsy, sleep apnea. Since transcranial magnetic stimulation studies were included in this study (reported separately) subjects were also excluded if they did not have a strong hand preference or had significant activities involving training hand movements, e.g. musicians, artists.
All of the RLS and control patients were diagnosed by an expert clinician using the validated structured diagnostic interview (Hopkins Diagnostic Telephone Interview) modified to exclude mimics and meet the updated diagnostic criteria for RLS [32]. All RLS patients were off any medications for RLS at least 10 days prior to admission to the Hopkins Clinical Research Center where they had two consecutive full nights of standard polysomnography following the standards established by the American Academy of Sleep Medicine including 6 channels of EEG and 2 of anterior tibialis EMG for recording periodic leg movements [33]. Sleep breathing was evaluated only on the first night and subjects with sleep disordered breathing rates >15/hour were excluded from the study. Sleep staging was scored using the American Academy of Sleep Medicine criteria [33]. PLMS were scored using the World Association of Sleep Medicine criteria [34]. The final clinical assessment and MRI scan were preformed after the second night of sleep, at least 12 days off any RLS medications. The severity of RLS symptoms was assessed using International Restless Legs Syndrome Score [35, 36]. In addition all subjects had a morning fasting blood sample tested for serum ferritin after the first night in the Clinical Research Center. The Institutional Review Boards at the Johns Hopkins University School of Medicine and Kennedy Krieger Institute approved the protocols. Written informed consent was obtained from all participants before the study.
2.2 MR imaging protocol
All the subjects underwent MRI scans in the morning after the second night sleep study. Due to the circadian rhythm of the disease, patients scanned in the morning were either free of or exhibited only minimum RLS symptoms. In addition, during the MRI scans foam pads and straps were used to restrict head movement of the patients. MRI scans were done using a 7T Achieva scanner (Philips Healthcare, Best, Netherlands) equipped with a 32-channel head coil (Novamedical). MR phase measurements used for QSM calculation were acquired using a 3D single-echo gradient echo sequence with 0.8 mm isotropic resolution, 220×220×140 mm3 field of view, axial slab orientation, repetition time/echo time= 20/12 ms, flip angle 10°, bandwidth 169 Hz/px, coil sensitivity encoding factor of 2.5×1×2, scan time 4′38″.
2.3 Image analysis
MR phase data was used for QSM calculation. First, phase unwrapping was performed using a Laplacian based phase unwrapping method [37]. The unwrapped phase images were then divided by the corresponding echo time to obtain an image of the frequency shift. Subsequently, the background field was removed using the sophisticated harmonic artifact reduction for phase data approach with variable spherical kernel size (V-SHARP) method [28, 38, 39]. For this we used a variable spherical kernel size with a maximum radius of 4 mm and a singular value decomposition threshold of 0.05. After that, dipole inversion was calculated to obtain susceptibility images using a least square with QR factorization-based minimization method [37]. In addition, to compare with a previous iron study in RLS using phase imaging [14], high-pass filtered phase was calculated using similar susceptibility weighted imaging method [40] with a 2D k-space filter of size 18×18 for each axial slice.
For automated image segmentation, all QSM images were coregistered to the QSM atlas created in the Johns Hopkins University using linear and Large Deformation Diffeomorphic Metric Mapping transformation [31]. After that the brain parcellation map was transformed to the subject space and inspected by a neuroradiologist (H.L.). Manual adjustment of the brain segmentation of selected regions of interest was then made after inspection. The central CSF region in the lateral ventricles was selected for each subject as a reference region for susceptibility quantification. Choroid plexus regions that showed obvious hypointensity in the QSM image possibly due to calcium deposition were excluded from the CSF reference region. Quantitative susceptibility values were then referenced to the mean susceptibility values of all the voxels in this reference region. For group comparison and correlation analysis, mean magnetic susceptibility values were calculated in the primary regions related to RLS, i.e. the SN and thalamus. Other secondary ROIs in deep gray matter nuclei in the basal ganglia and central brain including the red nucleus, caudate nucleus, putamen, globus pallidus, pulvinar and dentate nucleus in the cerebellum were also tested for exploratory purposes. Structure volumes were calculated automatically using the known voxel size and the number of voxels in each selected ROI. In each ROI, the mean value of the high-pass filtered phase was also calculated. In addition to the automatically selected ROI, which covers the whole structure in three dimensions, a smaller manually-placed, fixed-shape ROI with 3×3 voxels in the center of the SN was selected (by X.L.) in order to test possible bias and variations associated with the brain structure segmentation based on QSM contrast.
2.4 Statistical analysis
Group differences in the clinical measurements between the healthy control and RLS patients were tested using a two-tailed t-test with unequal variance or Chi-Square as appropriate. Possible group differences in the brain iron content as measured by quantitative magnetic susceptibility values in the primary ROIs related to RLS were first tested using ANCOVA controlling for ROI volume or subject age whichever had a stronger correlation with the magnetic susceptibility measures. Further exploratory tests were conducted in those secondary ROIs using ANCOVA in a similar way, i.e. controlling age or structure volume, with a Bonferroni correction for multiple comparisons. Differences were considered significant with p ≤0.05. The analyses for differences between controls and RLS were repeated after removing those outliers determined by using Rosner’s many outlier test vectorized (Matlab: outlier removal V2) [41]. Pearson correlations between the susceptibility values in SN obtained by using the two different ROI tracing methods, i.e. automated tracing and fixed shape tracing were tested. Similarly, possible group difference between RLS and control and correlation between values obtained using the two tracing methods were tested on SWI high-pass filtered phase. In addition, Pearson partial correlations controlling subject age and ROI volume (for automatically segmented ROI) for the substantia nigra and then all other ROIs were obtained between quantitative magnetic susceptibility and clinical measurements including PLMS from the 2nd night polysomnography, IRLSS at least 11 days off any medication and serum ferritin from the morning of the 2nd day in the clinical research unit.
3. Results
The demographic information and results of clinical testing and disease assessment are summarized in Table 1. Healthy controls and RLS patients recruited in this study did not differ significantly in age (mean ± std in years: 57.9 ± 8.6 vs. 58.4 ± 9.4), gender (female 62% vs. 64%) or serum ferritin (mean ± std in ng/mL: 34.4 ± 22.4 vs. 48.0 ± 32.0). The RLS patients that were enrolled in his study had moderately severe RLS symptoms with IRLSS of 24.9 ± 6.8. Most patients had early-onset RLS (30 patients with age of onset before or at 45 years) with mean age of onset of 32.3 ± 17.0 years.
Table 1.
Demographic and clinical measurements of RLS patients and healthy controls recruited in the present study
| Healthy controls | RLS patients | |
|---|---|---|
| Number of subjects | 29 | 39 |
| Gender (M/F) | 11/18 | 14/25 |
| Age (years), mean ± std | 57.9 ± 8.6 | 58.4 ± 9.4 |
| Age of onset (years), mean ± std | - | 32.3 ± 17.0 |
| Serum ferritin (ng/mL), mean ± std | 34.4 ± 22.4a | 48.0 ± 32.0b |
| IRLSS, mean ± std | - | 24.9 ± 6.8 |
| PLMS (times/hr), mean ± std | 3.3 ± 10.6 | 73.5 ± 63.4*** |
std: standard deviation, IRLSS: international restless legs syndrome scale, PLMS: periodic limb movement during sleep.
Significant difference compared to controls, p<0.001.
Sample size n = 25.
Sample size n = 32.
MR images of a 69-year-old healthy control at the midbrain level including the striatum and pallidum are illustrated in Fig. 1 showing the gradient echo magnitude (Fig. 1a), raw phase data (Fig. 1b), SWI high-pass filtered phase (Fig. 1c) and the frequency map calculated using the V-SHARP method (Fig. 1d). The QSM maps of the same subject at different brain levels are given in Figure 2 together with the outlined, primary and secondary regions of interests. In QSM images, a higher intensity (brighter in Fig. 2) indicates more paramagnetic thus more iron content in those gray matter nuclei. Selected ROIs generated by the automated atlas-based segmentation are shown in Fig. 2a, b, c and the manually-placed fixed-shape segmentation is shown in Fig 2d. With automatically selected ROIs, the mean magnetic susceptibility values were found to correlate stronger with the structure volumes than with subject age in SN, thalamus, globus pallidus, dentate nucleus and pulvinar, while they correlate stronger with subject age in red nucleus, caudate nucleus and putamen. With manually-placed, fixed-shape ROI in SN, susceptibility measures correlated significantly with subject age but as expected not so with structure volume. The SN susceptibility values obtained by the automated tracing and manual-placement, fixed-shape tracing were closely correlated (r=0.82, p<0.001). The comparison of the quantitative susceptibility values between healthy controls and RLS patients revealed a general trend of lower susceptibility in RLS, suggesting lower iron content in all primary and secondary ROIs except globus pallidus in RLS patients (Table 2). The variance in iron content across subjects was also greater for all areas except for the pulvinar. In the primary ROIs, no statistically significant difference was found in SN using either the automated or the fixed-shape tracing, but significantly lower magnetic susceptibility (i.e., lower iron) was found in thalamus (p<0.05) in RLS. In addition, as shown in Fig. 3a, the variance was significantly greater (p<0.01) for RLS than controls for both the SN and the thalamus. Among all the secondary ROIs, significant lower magnetic susceptibility was only found in dentate nucleus (p<0.05) in RLS (Fig. 3b and Table 2). The analyses with outliers removed did not change the significance findings. In comparison, using the SWI high-pass filtered phase no significant difference was found in any selected ROIs and no significant correlation was found between the phase values obtained by the automated tracing and fixed-shape tracing (r=0.08, p>0.1).
FIG. 1.
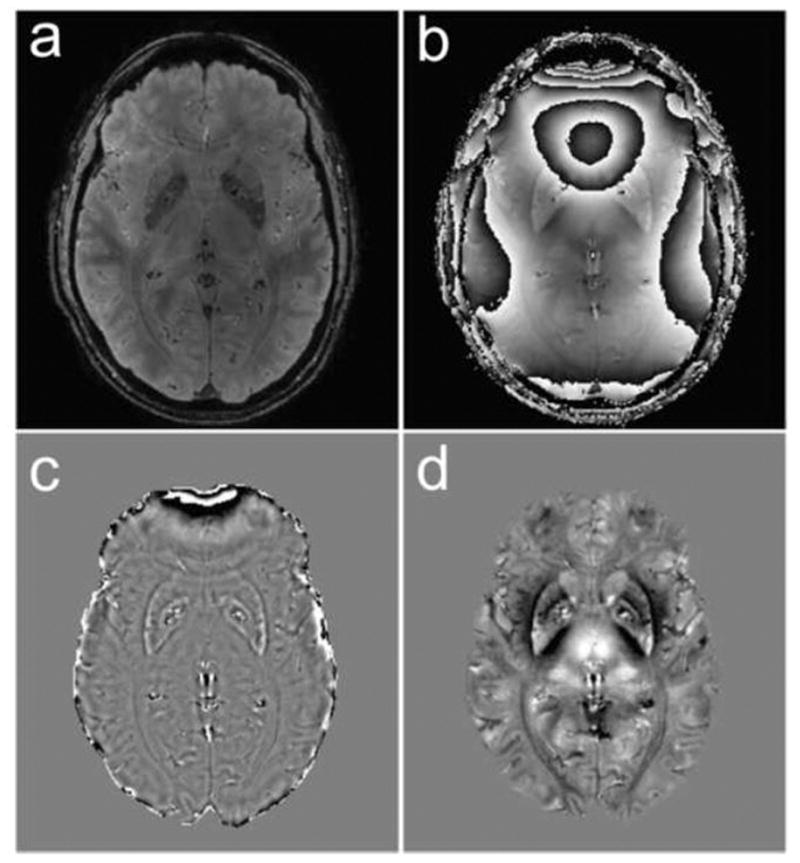
Example image of a 69 years old healthy control showing the gradient echo magnitude (a) and raw phase data with phase wraps (b). High-pass filtered phase image using the SWI method (c) and frequency map obtained by using the V-SHARP method (d). Gray scales are [−1, 1] radian and [−10, 10] Hz in (c) and (d), respectively.
FIG. 2.
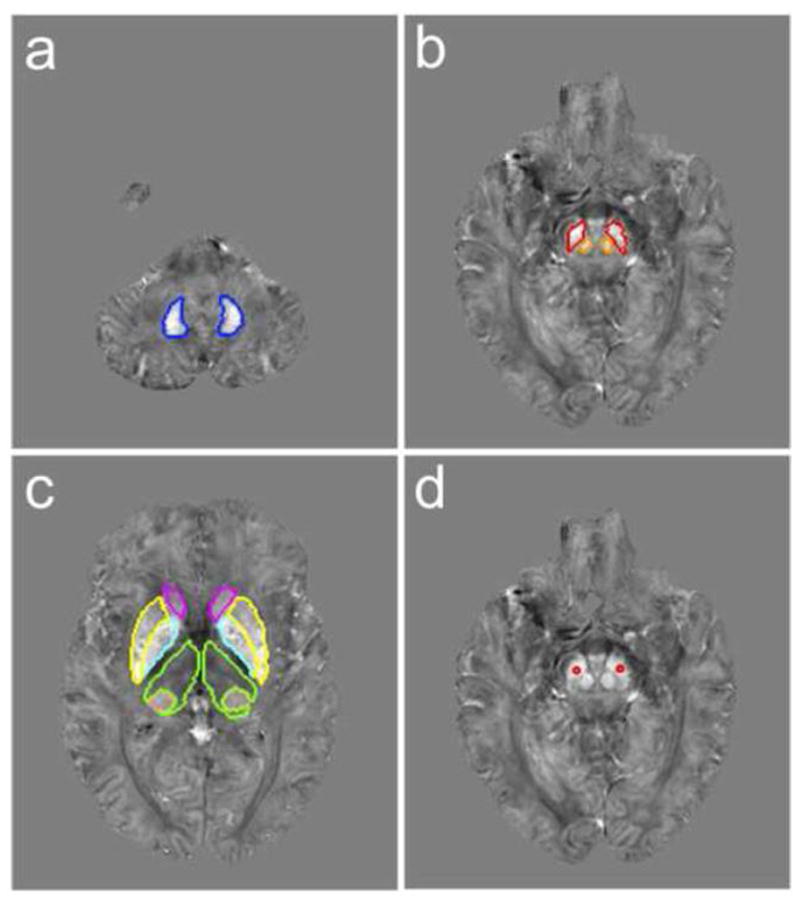
Example axial slices of the QSM image of a 69 years old healthy control showing the automatically selected region of interest (ROI) of (a) dentate nucleus (blue), (b) substantia nigra (red) and red nucleus (orange), (c) caudate nucleus (magenta), putamen (yellow), globus pallidus (cyan), thalamus (green) and pulvinar (pink) and (d) a manually placed fixed shape ROI in the center of substantia nigra (red). All the QSM image slices are shown with a gray scale of −0.15 to 0.15 ppm.
Table 2.
Magnetic susceptibility values in selected region of interest (ROI) in RLS patients and healthy controls
| ROIs | Healthy controls | RLS patients | |
|---|---|---|---|
| Primary | SN | 0.091 ± 0.016 | 0.088 ± 0.025 |
| SNfs | 0.095 ± 0.026 | 0.091 ± 0.029 | |
| Thalamus | −0.031 ± 0.0061 | −0.034 ± 0.0065* | |
| Secondary | RN | 0.073 ± 0.018 | 0.072 ± 0.022 |
| DN | 0.064 ± 0.019 | 0.053 ± 0.022* | |
| CN | 0.023 ± 0.0064 | 0.021 ± 0.013 | |
| PUT | 0.040 ± 0.010 | 0.036 ± 0.017 | |
| GP | 0.084 ± 0.013 | 0.087 ± 0.020 | |
| Pulvinar | 0.023 ± 0.016 | 0.023 ± 0.016 | |
Values are in the format of mean ± standard deviation, in the unit of ppm and relative to the selected CSF reference. Larger negative values and smaller positive values indicate less iron.
SN: substantia nigra, SNfs: substantia nigra with fixed-shape tracing, RN: red nucleus, DN: dentate nucleus, CN: caudate nucleus, PUT: putamen, GP: globus pallidus.
Significant difference as compared to controls with p<0.05.
FIG. 3.

First row (a) shows the box plots and individual data of the quantitative susceptibility values in control and RLS groups in primary ROIs, i.e. substantia nigra (SN), substantia nigra with fixed shape ROI (SNfs) and thalamus. Each dot represents a value measured in one subject. Bottom two rows show similar box plots in red nucleus (RN), dentate (DN), caudate nucleus (CN) putamen (PUT), globus pallidus (GP) and pulvinar. *: p<0.05.
As shown in Table 3, correlation analysis between quantitative susceptibility in selected brain regions and clinical measures demonstrated some weak correlations between serum ferritin and brain iron content as measured by magnetic susceptibility in caudate nucleus (r=0.28, p<0.05) and putamen (r=0.24, p<0.05). No significant correlation was found between susceptibility and IRLSS in any selected regions. Significant negative correlations were, however, observed between the PLMS measure and susceptibility in SN with both the automated tracing method (r=−0.42, p<0.01) and the fixed-shape tracing method (r=−0.55, p<0.001). These correlations with PLMS are significant when correcting for multiple analyses for the 3 primary ROIs (SN, SNfs and Thalamus) and the correlation with PLMS in SNfs is significant even if correcting for all 9 areas tested. See Fig. 4 for correlation with PLMS/hr in SNfs. Based on the observation of such a correlation, group differences between healthy controls and a subgroup of RLS patients (n=11) with severe motor signs (PLMS ≥ 100 times/hour) were further tested and significantly lower susceptibility values were observed in the SN with automated tracing (p<0.05) and fixed-shape tracing (p<0.01) in those RLS patients (Fig. 5). Such a difference was not found in the thalamus or in other secondary ROIs.
Table 3.
Pearson correlation coefficient (r) between tissue magnetic susceptibility values in different brain regions and clinical measurements
| ROIs | Serum ferritina | IRLSSb | PLMSb | |
|---|---|---|---|---|
| Primary | SN | −0.0079 | 0.19 | −0.42** |
| SNfs | 0.034 | 0.21 | −0.55*** | |
| Thalamus | 0.21 | −0.18 | 0.19 | |
| Secondary | RN | −0.042 | −0.0043 | 0.095 |
| DN | −0.27 | 0.19 | −0.11 | |
| CN | 0.28* | 0.31 | 0.11 | |
| PUT | 0.24* | 0.18 | 0.21 | |
| GP | 0.035 | 0.43 | −0.16 | |
| Pulvinar | 0.14 | 0.28 | 0.19 | |
SN: substantia nigra, SNfs: substantia nigra with fixed-shape tracing.
RN: red nucleus, DN: dentate nucleus, CN: caudate nucleus, PUT: putamen, GP: globus pallidus.
IRLSS: international restless legs syndrome scale, PLMS: periodic limb movement during sleep.
Significant correlation with p<0.05.
Significant correlation with p<0.01.
Significant correlation with p< 0.001
Tested in all subjects including healthy controls and RLS patients.
Tested in RLS patients.
FIG. 4.
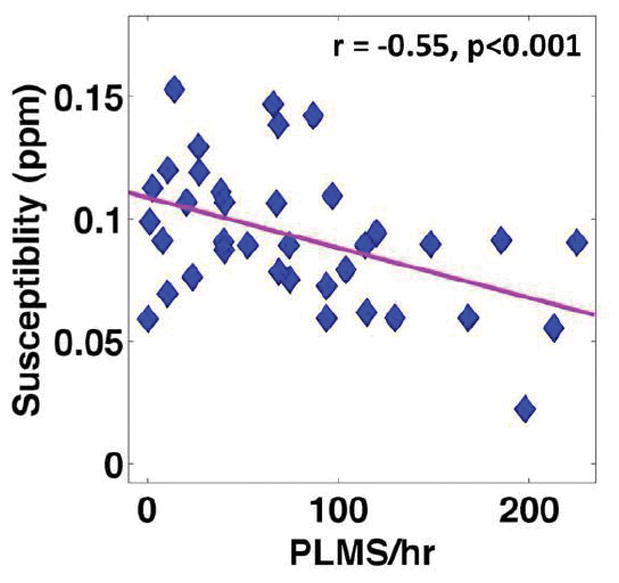
Correlation between magnetic susceptibility measured in the substantia nigra with a fixed shape (SNfs) ROI and PLMS measure in RLS patients.
FIG. 5.

Group comparison of magnetic susceptibility in SN and SN with fixed shape ROI (SNfs) between controls and a subgroup of RLS patients (n=11) with severe motor signs (PLMS ≥ 100 times/hour). * p<0.05, **p<0.01.
4. Discussion
The present study found significantly decreased magnetic susceptibility in the thalamus and dentate nucleus. Though there are previous studies reporting the involvement of both thalamus and cerebellum in the sensory component of RLS [42], this is the first study reporting possible iron insufficiency in the dentate. In addition, we found a decreased magnetic susceptibility in the thalamus in RLS as compared to healthy controls suggesting reduced thalamic iron content, which is consistent with previous studies [10, 14]. Prior studies of RLS patients using various other MR techniques showed thalamic alterations in spectroscopy-determined metabolite levels [43, 44], in functional MRI activation [15] and in resting-state connectivity [45]. The thalamus is central to integrating sensory and motor functions and RLS is a primary sensory disorder with secondary motor phenotype (PLM). Thus changes in the thalamus at various levels would not be surprising.
One major finding of the present study is the possible link between brain iron as measured by magnetic susceptibility in SN and the PLMS, which is the motor sign of RLS. Surprisingly, this is the first study to even evaluate the relation between regional brain iron and PLMS. Significant negative correlations between magnetic susceptibility in SN and PLMS were found using both ROI tracing methods and these were significant even with the Bonferroni correction for multiple comparisons. PLMS is very responsive to dopamine treatment suggesting a major dopamine pathophysiology driving the PLMS [46–48]. Animal studies have demonstrated that low iron in the SN occurs with the increased striatal dopamine activation [49] as seen in RLS [50] presumably leading to over-activation of compensatory mechanisms producing PLMS. Thus the iron status of the SN is expected to associate with the PLMS motor sign of RLS, as it does in this study. It should be noted the mean SN iron concentration for the total RLS group in this study was less than controls, but the difference was significant only for the RLS patients with the more severe PLMS. Thus statistically significant iron deficiency in SN found in other studies [6, 7, 14] may reflect the very wide range of severity of motor features of RLS in this study that may have been missing in prior studies. This is also consistent with the greater variance of SN iron for RLS than controls. Since this is the first report of the PLMS and brain iron relation in the SN the results need to be confirmed in a separate study.
Another possible but unlikely reason for the lack of statistically significant difference in magnetic susceptibility in the SN between RLS patients and healthy controls come from the fact that the SN has heterogeneous iron distribution and a visually ill-defined border that depends on its iron concentration for definition. The iron concentration can change with age and disease and thus so can the visually-definable region of interest [13]. The atlas-based automated segmentation used in this study covered the whole volume for each selected brain structure. Yet since the segmentation was based on QSM contrast, it is prone to possible underestimation or overestimation of the susceptibility measures due to disease related iron content changes especially around the structure edge. This might partly explain some strong correlations between the magnetic susceptibility measures and the ROI volumes seen in certain structures. In comparison, the use of a manually-placed, fixed-shape ROI in the structure center does not have such problem, but of course it ignores the tissue heterogeneity inside the structure. Nevertheless, the significant strong correlation between the SN magnetic susceptibility measures obtained from the automatically selected ROI and the manually-placed fixed-shape ROI and the consistent findings using the two ROI tracing methods seem to suggest that our findings in SN were not affected significantly by the ROI definition method.
In a recent MRI study using phase imaging, Rizzo et al [14] found significant phase shift in the RLS patients in multiple brain structures including the SN, thalamus, putamen and pallidum. However such differences in phase shift were not observed in the present study using a similar high-pass filtered phase measure. Such discrepancy may come from the fact that in the previous study the ROIs were manually drawn on each structure based on the phase contrast (only the darkest portion), while in the current study ROIs were selected based on susceptibility contrast. Due to the nonlocal nature of the phase measurement, brain structures delineated based on phase contrast are likely to deviate from the true anatomy [21]. In addition, the SWI high-pass filtered phase value largely depends on the filter setup and the filter used in the previous study may differ somewhat from what was used here. Overall, quantitative susceptibility used in this study is believed to be a more accurate and reliable measure of local tissue iron content than phase.
The normal peripheral iron status in RLS patients and its lack of strong correlation with brain iron as measured by magnetic susceptibility in this study is not fully unexpected as it is known that most RLS patients have normal serum iron levels despite an iron deficiency status that may exist in the brain. A potential cause may be possible variation in iron transportation to the brain tissue, which is highly regulated by the blood-brain barrier [3]. In addition, no significant correlation was found between brain tissue magnetic susceptibility and IRLSS in this study. Since only two previous RLS studies reported correlations between MRI based brain iron measure with Johns Hopkins RLS severity score [6, 7], this lack of correlation between magnetic susceptibility and IRLSS can be considered consistent with most other RLS imaging studies [11, 12, 14].
As the presence of tissue iron not only changes the relaxation behavior of water protons surrounding iron-containing proteins such as ferritin, but also changes the tissue local magnetic susceptibility and introduces microscopic magnetic field inhomogeneity, different MRI techniques have been developed over the years for assessing non-heme iron content in brain tissue especially iron stored in ferritin or hemosiderin [18]. These include the commonly used relaxometry methods measuring R2, R2* or R2′ [18, 51, 52], mapping of field dependent transverse relaxation rate increase [53, 54], magnetic field correlation [55, 56], phase imaging [40, 57], susceptibility weighted imaging [18, 58], direct saturation imaging [59] and the recently developed QSM [21, 22]. For each measure there have been studies demonstrating its correlation with tissue iron concentrations derived from literature [60] or measured directly [61]. The best-established and validated methods are R2* or R2′ relaxometry, which are sensitive to iron-induced microscopic field inhomogeneity and have been shown to be more sensitive to tissue iron concentration than R2 relaxometry [18, 61]. Yet, R2* and R2′ measurements may be contaminated by possible contributions from the background field inhomogeneity generated by sources that are not related to local tissue iron contents, e.g. from the air-tissue susceptibility difference, which could undermine their specificity as a measure of local tissue iron concentration. The newly developed QSM technique based on MR phase measurements gives an accurate quantification of local relative tissue magnetic susceptibility, for which high sensitivity and specificity to tissue iron content in cerebral gray matter regions have been demonstrated recently [29–31]. In addition, several recent studies of QSM in multiple sclerosis [62] and Parkinson’s disease [63] have shown that QSM may be more sensitive than R2* to detect disease-related extra iron deposition under certain circumstances, e.g. during simultaneous demyelination [64]. Therefore, assessing possible brain iron insufficiency in RLS using QSM may help us better understand the changed iron homeostasis in RLS.
One limitation for current QSM techniques is its relative nature, i.e. an internal tissue reference needs to be selected for a proper interpretation of the quantitative values. In the present study, commonly used CSF regions in the lateral ventricles were selected as internal tissue reference for QSM quantification. Though previous studies have shown that possible changes of CSF iron concentration may be involved in RLS, the overall iron concentration in CSF is as low as 0.8 μM [65], which gives possible magnetic susceptibility change on the order of 10−5 ppm [29]. Thus even an 80% decrease of iron containing ferritin or iron itself in CSF as observed in RLS [4] would only cause changes of magnetic susceptibility at levels of 10−5 ppm, which is far below the inter-subject variance of magnetic susceptibility in most gray matter regions (on the order of 10−2 ppm as seen in this study). Therefore, using CSF region for QSM reference is not expected to give significant bias in our findings for this disease.
The use of ultrahigh field MRI (7 Tesla) allowed us to achieve sub-millimeter spatial resolution and good signal to noise ratio in QSM images. This allowed us to better visualize the heterogeneous iron distribution in different brain structures and to better define substructures such as the pulvinar nucleus in the thalamus. Yet the current study is not without limitations. The tissue iron concentration as determined by MRI reflects an overall estimation of ferritin- or hemosiderin-bound iron [18, 66], but it cannot differentiate iron bound to different isoforms of ferritin, i.e. H-ferritin and L-ferritin. RLS autopsy studies showed dramatic changes in H-ferritin but not in L-ferritin [5]. H-ferritin has been shown to be more abundant than L-ferritin in the cortex and in most regions of the brain [67, 68], with a ratio of H/L isoferritins to be around 2 to 4 in the SN in elderly population [68, 69]. Nonetheless, changes in H-ferritin, no matter how great, will always be against the background of L-ferritin that has minimal change. Therefore, MRI-based iron determinations will have a limited inherent sensitivity for changes in regional brain iron in RLS. In addition, due to the use of a single-echo SWI sequence, calculation of R2* and a quantitative comparison between QSM and R2* as separate brain tissue iron measures were not performed in the present study, which should be done in future studies.
In conclusion, using quantitative magnetic susceptibility as an in vivo indicator of brain iron content, the present study supports the general hypothesis of brain iron deficiency in RLS, indicates a possible primary role for the thalamus in all RLS and for the first time documents the expected link between substantia nigra iron and PLMS.
Highlights.
7T QSM reveals brain iron deficiency in idiopathic RLS patients off treatment
RLS patients showed decreased iron in thalamus and dentate nucleus
Decreased iron in the SN correlated with increased PLMS for RLS
Iron deficiency in SN was observed in RLS with severe PLMS
Acknowledgments
The authors would like to thank Mr. Joseph Gillen, Ms. Terri Brawner, Ms. Kathleen Kahl, Ms. Ivana Kusevic, Dr. Raj Stewart for their assistance with data acquisition. Dr. Peter van Zijl is a paid lecturer for Philips Healthcare and is the inventor of technology that is licensed to Philips. This arrangement has been approved by The Johns Hopkins University in accordance with its Conflict of Interest policies. Dr. Richard P. Allen is a paid consultant for Luitpold Pharmaceuticals. This research was supported by NIH/NIBIB: P41 EB015909 (P.C.M.v.Z.), NIH/NINDS: R01 NS075184 (R.P.A.) and Philips Healthcare (P.C.M.v.Z., X.L.).
Abbreviations
- IRLSS
International Restless Legs Syndrome Score
- PLMS
periodic limb movement during sleep
- QSM
quantitative susceptibility mapping
- RLS
restless legs syndrome
- ROI
region of interest
- SN
substantia nigra
- SWI
susceptibility weighted imaging
Footnotes
Publisher's Disclaimer: This is a PDF file of an unedited manuscript that has been accepted for publication. As a service to our customers we are providing this early version of the manuscript. The manuscript will undergo copyediting, typesetting, and review of the resulting proof before it is published in its final form. Please note that during the production process errors may be discovered which could affect the content, and all legal disclaimers that apply to the journal pertain.
References
- 1.Allen RP, Earley CJ. Restless legs syndrome: a review of clinical and pathophysiologic features. Journal of clinical neurophysiology: official publication of the American Electroencephalographic Society. 2001;18:128–47. doi: 10.1097/00004691-200103000-00004. [DOI] [PubMed] [Google Scholar]
- 2.Earley CJ, Silber MH. Restless legs syndrome: understanding its consequences and the need for better treatment. Sleep medicine. 2010;11:807–15. doi: 10.1016/j.sleep.2010.07.007. [DOI] [PubMed] [Google Scholar]
- 3.Earley CJ, Connor J, Garcia-Borreguero D, Jenner P, Winkelman J, Zee PC, et al. Altered brain iron homeostasis and dopaminergic function in Restless Legs Syndrome (Willis-Ekbom Disease) Sleep Med. 2014;15:1288–301. doi: 10.1016/j.sleep.2014.05.009. [DOI] [PubMed] [Google Scholar]
- 4.Earley CJ, Connor JR, Beard JL, Malecki EA, Epstein DK, Allen RP. Abnormalities in CSF concentrations of ferritin and transferrin in restless legs syndrome. Neurology. 2000;54:1698–700. doi: 10.1212/wnl.54.8.1698. [DOI] [PubMed] [Google Scholar]
- 5.Connor JR, Boyer PJ, Menzies SL, Dellinger B, Allen RP, Ondo WG, et al. Neuropathological examination suggests impaired brain iron acquisition in restless legs syndrome. Neurology. 2003;61:304–9. doi: 10.1212/01.wnl.0000078887.16593.12. [DOI] [PubMed] [Google Scholar]
- 6.Allen RP, Barker PB, Wehrl F, Song HK, Earley CJ. MRI measurement of brain iron in patients with restless legs syndrome. Neurology. 2001;56:263–5. doi: 10.1212/wnl.56.2.263. [DOI] [PubMed] [Google Scholar]
- 7.Earley CJ, Barker PB, Horska A, Allen RP. MRI-determined regional brain iron concentrations in early- and late-onset restless legs syndrome. Sleep medicine. 2006;7:458–61. doi: 10.1016/j.sleep.2005.11.009. [DOI] [PubMed] [Google Scholar]
- 8.Earley CJ, Connor JR, Beard JL, Clardy SL, Allen RP. Ferritin levels in the cerebrospinal fluid and restless legs syndrome: effects of different clinical phenotypes. Sleep. 2005;28:1069–75. doi: 10.1093/sleep/28.9.1069. [DOI] [PubMed] [Google Scholar]
- 9.Connor JR, Ponnuru P, Wang XS, Patton SM, Allen RP, Earley CJ. Profile of altered brain iron acquisition in restless legs syndrome. Brain. 2011;134:959–68. doi: 10.1093/brain/awr012. [DOI] [PMC free article] [PubMed] [Google Scholar]
- 10.Godau J, Klose U, Di Santo A, Schweitzer K, Berg D. Multiregional brain iron deficiency in restless legs syndrome. Movement disorders: official journal of the Movement Disorder Society. 2008;23:1184–7. doi: 10.1002/mds.22070. [DOI] [PubMed] [Google Scholar]
- 11.Astrakas LG, Konitsiotis S, Margariti P, Tsouli S, Tzarouhi L, Argyropoulou MI. T2 relaxometry and fMRI of the brain in late-onset restless legs syndrome. Neurology. 2008;71:911–6. doi: 10.1212/01.wnl.0000325914.50764.a2. [DOI] [PubMed] [Google Scholar]
- 12.Moon HJ, Chang Y, Lee YS, Song HJ, Chang HW, Ku J, et al. T2 relaxometry using 3.0-tesla magnetic resonance imaging of the brain in early- and late-onset restless legs syndrome. J Clin Neurol. 2014;10:197–202. doi: 10.3988/jcn.2014.10.3.197. [DOI] [PMC free article] [PubMed] [Google Scholar]
- 13.Moon HJ, Chang Y, Lee YS, Song H, Chang HW, Ku J, et al. A comparison of MRI tissue relaxometry and ROI methods used to determine regional brain iron concentrations in restless legs syndrome. Med Devices (Auckl) 2015;8:341–50. doi: 10.2147/MDER.S83629. [DOI] [PMC free article] [PubMed] [Google Scholar]
- 14.Rizzo G, Manners D, Testa C, Tonon C, Vetrugno R, Marconi S, et al. Low brain iron content in idiopathic restless legs syndrome patients detected by phase imaging. Movement disorders: official journal of the Movement Disorder Society. 2013;28:1886–90. doi: 10.1002/mds.25576. [DOI] [PubMed] [Google Scholar]
- 15.Margariti PN, Astrakas LG, Tsouli SG, Hadjigeorgiou GM, Konitsiotis S, Argyropoulou MI. Investigation of unmedicated early onset restless legs syndrome by voxel-based morphometry, T2 relaxometry, and functional MR imaging during the night-time hours. AJNRAmerican journal of neuroradiology. 2012;33:667–72. doi: 10.3174/ajnr.A2829. [DOI] [PMC free article] [PubMed] [Google Scholar]
- 16.Knake S, Heverhagen JT, Menzler K, Keil B, Oertel WH, Stiasny-Kolster K. Normal regional brain iron concentration in restless legs syndrome measured by MRI. Nat Sci Sleep. 2010;2:19–22. [PMC free article] [PubMed] [Google Scholar]
- 17.Aguirre P, Urrutia P, Tapia V, Villa M, Paris I, Segura-Aguilar J, et al. The dopamine metabolite aminochrome inhibits mitochondrial complex I and modifies the expression of iron transporters DMT1 and FPN1. Biometals. 2012;25:795–803. doi: 10.1007/s10534-012-9525-y. [DOI] [PubMed] [Google Scholar]
- 18.Haacke EM, Cheng NY, House MJ, Liu Q, Neelavalli J, Ogg RJ, et al. Imaging iron stores in the brain using magnetic resonance imaging. Magn Reson Imaging. 2005;23:1–25. doi: 10.1016/j.mri.2004.10.001. [DOI] [PubMed] [Google Scholar]
- 19.Salomir R, De Senneville BD, Moonen CTW. A fast calculation method for magnetic field inhomogeneity due to an arbitrary distribution of bulk susceptibility. Concepts in Magnetic Resonance Part B-Magnetic Resonance Engineering. 2003;19B:26–34. [Google Scholar]
- 20.Marques JP, Bowtell R. Application of a fourier-based method for rapid calculation of field inhomogeneity due to spatial variation of magnetic susceptibility. Concepts in Magnetic Resonance Part B-Magnetic Resonance Engineering. 2005;25B:65–78. [Google Scholar]
- 21.Wang Y, Liu T. Quantitative susceptibility mapping (QSM): Decoding MRI data for a tissue magnetic biomarker. Magn Reson Med. 2014 doi: 10.1002/mrm.25358. [DOI] [PMC free article] [PubMed] [Google Scholar]
- 22.Liu C, Li W, Tong KA, Yeom KW, Kuzminski S. Susceptibility-weighted imaging and quantitative susceptibility mapping in the brain. J Magn Reson Imaging. 2015;42:23–41. doi: 10.1002/jmri.24768. [DOI] [PMC free article] [PubMed] [Google Scholar]
- 23.Deistung A, Schafer A, Schweser F, Biedermann U, Turner R, Reichenbach JR. Toward in vivo histology: a comparison of quantitative susceptibility mapping (QSM) with magnitude-, phase-, and R2*-imaging at ultra-high magnetic field strength. NeuroImage. 2013;65:299–314. doi: 10.1016/j.neuroimage.2012.09.055. [DOI] [PubMed] [Google Scholar]
- 24.Liu T, Wisnieff C, Lou M, Chen W, Spincemaille P, Wang Y. Nonlinear formulation of the magnetic field to source relationship for robust quantitative susceptibility mapping. Magn Reson Med. 2013;69:467–76. doi: 10.1002/mrm.24272. [DOI] [PubMed] [Google Scholar]
- 25.Schweser F, Sommer K, Deistung A, Reichenbach JR. Quantitative susceptibility mapping for investigating subtle susceptibility variations in the human brain. NeuroImage. 2012;62:2083–100. doi: 10.1016/j.neuroimage.2012.05.067. [DOI] [PubMed] [Google Scholar]
- 26.Bilgic B, Fan AP, Polimeni JR, Cauley SF, Bianciardi M, Adalsteinsson E, et al. Fast quantitative susceptibility mapping with L1-regularization and automatic parameter selection. Magn Reson Med. 2014;72:1444–59. doi: 10.1002/mrm.25029. [DOI] [PMC free article] [PubMed] [Google Scholar]
- 27.Wharton S, Bowtell R. Whole-brain susceptibility mapping at high field: a comparison of multiple- and single-orientation methods. Neuroimage. 2010;53:515–25. doi: 10.1016/j.neuroimage.2010.06.070. [DOI] [PubMed] [Google Scholar]
- 28.Schweser F, Deistung A, Lehr BW, Reichenbach JR. Quantitative imaging of intrinsic magnetic tissue properties using MRI signal phase: an approach to in vivo brain iron metabolism? Neuroimage. 2011;54:2789–807. doi: 10.1016/j.neuroimage.2010.10.070. [DOI] [PubMed] [Google Scholar]
- 29.Langkammer C, Schweser F, Krebs N, Deistung A, Goessler W, Scheurer E, et al. Quantitative susceptibility mapping (QSM) as a means to measure brain iron? A post mortem validation study. NeuroImage. 2012;62:1593–9. doi: 10.1016/j.neuroimage.2012.05.049. [DOI] [PMC free article] [PubMed] [Google Scholar]
- 30.Zheng W, Nichol H, Liu S, Cheng YC, Haacke EM. Measuring iron in the brain using quantitative susceptibility mapping and X-ray fluorescence imaging. NeuroImage. 2013;78:68–74. doi: 10.1016/j.neuroimage.2013.04.022. [DOI] [PMC free article] [PubMed] [Google Scholar]
- 31.Lim IA, Faria AV, Li X, Hsu JT, Airan RD, Mori S, et al. Human brain atlas for automated region of interest selection in quantitative susceptibility mapping: application to determine iron content in deep gray matter structures. NeuroImage. 2013;82:449–69. doi: 10.1016/j.neuroimage.2013.05.127. [DOI] [PMC free article] [PubMed] [Google Scholar]
- 32.Allen RP, Picchietti DL, Garcia-Borreguero D, Ondo WG, Walters AS, Winkelman JW, et al. Restless legs syndrome/Willis-Ekbom disease diagnostic criteria: updated International Restless Legs Syndrome Study Group (IRLSSG) consensus criteria--history, rationale, description, and significance. Sleep Med. 2014;15:860–73. doi: 10.1016/j.sleep.2014.03.025. [DOI] [PubMed] [Google Scholar]
- 33.Berry RB, Gamaldo CE, Harding SM, Brooks R, Lloyd RM, Vaughn BV, et al. AASM Scoring Manual Version 2.2 Updates: New Chapters for Scoring Infant Sleep Staging and Home Sleep Apnea Testing. J Clin Sleep Med. 2015;11:1253–4. doi: 10.5664/jcsm.5176. [DOI] [PMC free article] [PubMed] [Google Scholar]
- 34.Zucconi M, Ferri R, Allen R, Baier PC, Bruni O, Chokroverty S, et al. The official World Association of Sleep Medicine (WASM) standards for recording and scoring periodic leg movements in sleep (PLMS) and wakefulness (PLMW) developed in collaboration with a task force from the International Restless Legs Syndrome Study Group (IRLSSG) Sleep Med. 2006;7:175–83. doi: 10.1016/j.sleep.2006.01.001. [DOI] [PubMed] [Google Scholar]
- 35.Walters AS, LeBrocq C, Dhar A, Hening W, Rosen R, Allen RP, et al. Validation of the International Restless Legs Syndrome Study Group rating scale for restless legs syndrome. Sleep Med. 2003;4:121–32. doi: 10.1016/s1389-9457(02)00258-7. [DOI] [PubMed] [Google Scholar]
- 36.Abetz L, Arbuckle R, Allen RP, Garcia-Borreguero D, Hening W, Walters AS, et al. The reliability, validity and responsiveness of the International Restless Legs Syndrome Study Group rating scale and subscales in a clinical-trial setting. Sleep Med. 2006;7:340–9. doi: 10.1016/j.sleep.2005.12.011. [DOI] [PubMed] [Google Scholar]
- 37.Li W, Wu B, Liu C. Quantitative susceptibility mapping of human brain reflects spatial variation in tissue composition. Neuroimage. 2011;55:1645–56. doi: 10.1016/j.neuroimage.2010.11.088. [DOI] [PMC free article] [PubMed] [Google Scholar]
- 38.Wu B, Li W, Guidon A, Liu C. Whole brain susceptibility mapping using compressed sensing. Magnetic resonance in medicine: official journal of the Society of Magnetic Resonance in Medicine/Society of Magnetic Resonance in Medicine. 2012;67:137–47. doi: 10.1002/mrm.23000. [DOI] [PMC free article] [PubMed] [Google Scholar]
- 39.Li W, Avram AV, Wu B, Xiao X, Liu C. Integrated Laplacian-based phase unwrapping and background phase removal for quantitative susceptibility mapping. NMR in biomedicine. 2014;27:219–27. doi: 10.1002/nbm.3056. [DOI] [PMC free article] [PubMed] [Google Scholar]
- 40.Ogg RJ, Langston JW, Haacke EM, Steen RG, Taylor JS. The correlation between phase shifts in gradient-echo MR images and regional brain iron concentration. Magn Reson Imaging. 1999;17:1141–8. doi: 10.1016/s0730-725x(99)00017-x. [DOI] [PubMed] [Google Scholar]
- 41.Rosner B. Percentage Points for a Generalized Esd Many-Outlier Procedure. Technometrics. 1983;25:165–72. [Google Scholar]
- 42.Bucher SF, Seelos KC, Oertel WH, Reiser M, Trenkwalder C. Cerebral generators involved in the pathogenesis of the restless legs syndrome. Annals of Neurology. 1997;41:639–45. doi: 10.1002/ana.410410513. [DOI] [PubMed] [Google Scholar]
- 43.Rizzo G, Tonon C, Testa C, Manners D, Vetrugno R, Pizza F, et al. Abnormal medial thalamic metabolism in patients with idiopathic restless legs syndrome. Brain. 2012;135:3712–20. doi: 10.1093/brain/aws266. [DOI] [PubMed] [Google Scholar]
- 44.Allen RP, Barker PB, Horska A, Earley CJ. Thalamic glutamate/glutamine in restless legs syndrome: increased and related to disturbed sleep. Neurology. 2013;80:2028–34. doi: 10.1212/WNL.0b013e318294b3f6. [DOI] [PMC free article] [PubMed] [Google Scholar]
- 45.Ku J, Cho YW, Lee YS, Moon HJ, Chang H, Earley CJ, et al. Functional connectivity alternation of the thalamus in restless legs syndrome patients during the asymptomatic period: a resting-state connectivity study using functional magnetic resonance imaging. Sleep Med. 2014;15:289–94. doi: 10.1016/j.sleep.2013.09.030. [DOI] [PubMed] [Google Scholar]
- 46.Kaplan PW, Allen RP, Buchholz DW, Walters JK. A Double-Blind, Placebo-Controlled Study of the Treatment of Periodic Limb Movements in Sleep Using Carbidopa/Levodopa and Propoxyphene. Sleep. 1993;16:717–23. doi: 10.1093/sleep/16.8.717. [DOI] [PubMed] [Google Scholar]
- 47.Allen R, Becker PM, Bogan R, Schmidt M, Kushida CA, Fry JM, et al. Ropinirole decreases periodic leg movements and improves sleep parameters in patients with restless legs syndrome. Sleep. 2004;27:907–14. doi: 10.1093/sleep/27.5.907. [DOI] [PubMed] [Google Scholar]
- 48.Partinen M, Hirvonen K, Jama L, Alakuijala A, Hublin C, Tamminen I, et al. Efficacy and safety of pramipexole in idiopathic restless legs syndrome: a polysomnographic dose-finding study--the PRELUDE study. Sleep Med. 2006;7:407–17. doi: 10.1016/j.sleep.2006.03.011. [DOI] [PubMed] [Google Scholar]
- 49.Unger EL, Bianco LE, Jones BC, Allen RP, Earley CJ. Low brain iron effects and reversibility on striatal dopamine dynamics. Experimental neurology. 2014 doi: 10.1016/j.expneurol.2014.06.023. [DOI] [PMC free article] [PubMed] [Google Scholar]
- 50.Earley CJ, Kuwabara H, Wong DF, Gamaldo C, Salas RE, Brasic JR, et al. Increased synaptic dopamine in the putamen in restless legs syndrome. Sleep. 2013;36:51–7. doi: 10.5665/sleep.2300. [DOI] [PMC free article] [PubMed] [Google Scholar]
- 51.Schenck JF. Imaging of brain iron by magnetic resonance: T2 relaxation at different field strengths. J Neurol Sci. 1995;134(Suppl):10–8. doi: 10.1016/0022-510x(95)00203-e. [DOI] [PubMed] [Google Scholar]
- 52.Graham JM, Paley MN, Grunewald RA, Hoggard N, Griffiths PD. Brain iron deposition in Parkinson’s disease imaged using the PRIME magnetic resonance sequence. Brain. 2000;123(Pt 12):2423–31. doi: 10.1093/brain/123.12.2423. [DOI] [PubMed] [Google Scholar]
- 53.Bartzokis G, Aravagiri M, Oldendorf WH, Mintz J, Marder SR. Field dependent transverse relaxation rate increase may be a specific measure of tissue iron stores. Magn Reson Med. 1993;29:459–64. doi: 10.1002/mrm.1910290406. [DOI] [PubMed] [Google Scholar]
- 54.Bartzokis G, Tishler TA. MRI evaluation of basal ganglia ferritin iron and neurotoxicity in Alzheimer’s and Huntingon’s disease. Cellular and molecular biology (Noisy-le-Grand, France) 2000;46:821–33. [PubMed] [Google Scholar]
- 55.Jensen JH, Chandra R, Ramani A, Lu H, Johnson G, Lee SP, et al. Magnetic field correlation imaging. Magn Reson Med. 2006;55:1350–61. doi: 10.1002/mrm.20907. [DOI] [PubMed] [Google Scholar]
- 56.Jensen JH, Szulc K, Hu C, Ramani A, Lu H, Xuan L, et al. Magnetic field correlation as a measure of iron-generated magnetic field inhomogeneities in the brain. Magn Reson Med. 2009;61:481–5. doi: 10.1002/mrm.21823. [DOI] [PMC free article] [PubMed] [Google Scholar]
- 57.Hammond KE, Metcalf M, Carvajal L, Okuda DT, Srinivasan R, Vigneron D, et al. Quantitative in vivo magnetic resonance imaging of multiple sclerosis at 7 Tesla with sensitivity to iron. Annals of Neurology. 2008;64:707–13. doi: 10.1002/ana.21582. [DOI] [PubMed] [Google Scholar]
- 58.Haacke EM, Xu Y, Cheng YC, Reichenbach JR. Susceptibility weighted imaging (SWI) Magnetic resonance in medicine: official journal of the Society of Magnetic Resonance in Medicine/Society of Magnetic Resonance in Medicine. 2004;52:612–8. doi: 10.1002/mrm.20198. [DOI] [PubMed] [Google Scholar]
- 59.Smith SA, Bulte JW, van Zijl PC. Direct saturation MRI: theory and application to imaging brain iron. Magn Reson Med. 2009;62:384–93. doi: 10.1002/mrm.21980. [DOI] [PMC free article] [PubMed] [Google Scholar]
- 60.Hallgren B, Sourander P. The effect of age on the non-haemin iron in the human brain. J Neurochem. 1958;3:41–51. doi: 10.1111/j.1471-4159.1958.tb12607.x. [DOI] [PubMed] [Google Scholar]
- 61.Langkammer C, Krebs N, Goessler W, Scheurer E, Ebner F, Yen K, et al. Quantitative MR imaging of brain iron: a postmortem validation study. Radiology. 2010;257:455–62. doi: 10.1148/radiol.10100495. [DOI] [PubMed] [Google Scholar]
- 62.Langkammer C, Liu T, Khalil M, Enzinger C, Jehna M, Fuchs S, et al. Quantitative susceptibility mapping in multiple sclerosis. Radiology. 2013;267:551–9. doi: 10.1148/radiol.12120707. [DOI] [PMC free article] [PubMed] [Google Scholar]
- 63.Du G, Liu T, Lewis MM, Kong L, Wang Y, Connor J, et al. Quantitative susceptibility mapping of the midbrain in Parkinson’s disease. Mov Disord. 2015 doi: 10.1002/mds.26417. [DOI] [PMC free article] [PubMed] [Google Scholar]
- 64.Li X, Harrison DM, Liu H, Jones CK, Oh J, Calabresi PA, et al. Magnetic susceptibility contrast variations in multiple sclerosis lesions. J Magn Reson Imaging. 2016;43:463–73. doi: 10.1002/jmri.24976. [DOI] [PMC free article] [PubMed] [Google Scholar]
- 65.Schenck JF. Magnetic resonance imaging of brain iron. J Neurol Sci. 2003;207:99–102. doi: 10.1016/s0022-510x(02)00431-8. [DOI] [PubMed] [Google Scholar]
- 66.Schenck JF, Zimmerman EA. High-field magnetic resonance imaging of brain iron: birth of a biomarker? NMR Biomed. 2004;17:433–45. doi: 10.1002/nbm.922. [DOI] [PubMed] [Google Scholar]
- 67.Dedman DJ, Treffry A, Candy JM, Taylor GA, Morris CM, Bloxham CA, et al. Iron and aluminium in relation to brain ferritin in normal individuals and Alzheimer’s-disease and chronic renal-dialysis patients. Biochem J. 1992;287(Pt 2):509–14. doi: 10.1042/bj2870509. [DOI] [PMC free article] [PubMed] [Google Scholar]
- 68.Connor JR, Snyder BS, Arosio P, Loeffler DA, LeWitt P. A quantitative analysis of isoferritins in select regions of aged, parkinsonian, and Alzheimer’s diseased brains. J Neurochem. 1995;65:717–24. doi: 10.1046/j.1471-4159.1995.65020717.x. [DOI] [PubMed] [Google Scholar]
- 69.Koziorowski D, Friedman A, Arosio P, Santambrogio P, Dziewulska D. ELISA reveals a difference in the structure of substantia nigra ferritin in Parkinson’s disease and incidental Lewy body compared to control. Parkinsonism Relat Disord. 2007;13:214–8. doi: 10.1016/j.parkreldis.2006.10.002. [DOI] [PubMed] [Google Scholar]