

Abstract
Genetic variants within the BUD13-APOA5 gene region are known to be associated with high-density lipoprotein cholesterol (HDL-C) and triglyceride (TG) levels. Recent studies suggest that single-nucleotide polymorphisms (SNPs) within this region affect HDL-C response to statin-fibrate combination therapy and low-density lipoprotein cholesterol (LDL-C) response to statin therapy. We hypothesized that SNPs within the BUD13-APOA5 region are associated with TG, HDL-C, and LDL-C response to statin therapy.
We examined 1520 observations for 1086 patients from the Personalized Medicine Research Project, a large biorepository at the Marshfield Clinic Research Foundation, who had received statin therapy and been previously genotyped for polymorphisms in the 11q23 chromosomal region.
A significant differential response to statin therapy was observed for three SNPs. The minor allele at rs11605293 significantly attenuated TG-lowering response to pravastatin (P=1.59E-04) while the minor allele at rs12806755 was associated with a similar response to lovastatin (P=1.92E-04). Genotypes at rs947990 significantly attenuated LDL-C reduction to atorvastatin therapy (P=6.68E-04) with some patients with the minor allele having LDL-C increase following therapy. No SNPs within the BUD13-APOA5 region were associated with a significant effect on HDL-C reduction in response to statin therapy.
In conclusion, this study suggests that common SNPs within the BUD13-APOA5 can affect TG and LDL-C response to statin therapy in a North American population.
Keywords: pharmacogenetics, statin response, genetic association, triglycerides, HDL-C, LDL‐C
Introduction
Statin therapy is the major treatment for low-density lipoprotein cholesterol (LDL-C) reduction, and the only treatment that has been shown to clearly improve cardiovascular outcomes.1 Statins have additional positive effects on reducing triglycerides (TG), increasing high-density lipoprotein cholesterol (HDL-C), and reducing inflammation. Multiple studies have examined the effect of common single-nucleotide polymorphisms (SNPs) on LDL-C statin response. SNPs within the APOE gene have been shown to affect LDL-C response to statins in multiple studies,2 while GWAS studies had variable results.3-5 A number of studies examined genes in the metabolic and absorption pathways of statins,6,7 but not the SNPs effect on TG and HDL-C response to statins. The APOA5 gene has been previously associated with HDL-C and TG levels in multiple studies, and recently rare variants within this gene were associated with early coronary events.8 We have previously shown that SNPs in the BUD13-APOA5 region affect HDL-C response to fibrate-statin combination therapy.9,10 A recent study by Hubacek et al11 showed that SNPs within the APOA5 gene region had an effect on LDL-C response to statins. In this study, we examined the association between common genetic variants in the APOA5-BUD13 gene region and change in LDL-C, HDL-C, and TG levels in response to statin therapy in the context of a longitudinal population study.
Methods
Ethics Statement
The study was reviewed and approved by Marshfield Clinic Research Foundation's (MCRF) Institutional Review Board. Participants originally provided informed consent to join the Personalized Medicine Research Project biorepository.
Study Population
Subjects were selected from the Personalized Medicine Research Project (PMRP), a central Wisconsin adult population-based, biorepository of stored DNA, plasma, and serum from >20,000 participants with linked electronic medical records extending an average of >30 years. The PMRP is housed at MCRF and has been previously described.12,13 This cohort is highly stable and homogeneous, consisting of predominately white Americans of Northwestern European ancestry (>98%; see Supplemental Table 1 for definition of ethno-racial distributions in the study population). PMRP has been successfully used in previous mapping efforts of common diseases.14-16
The subset of PMRP individuals selected for the study were >50 years-of-age, not previously diagnosed with type 1 diabetes, had received at least one first-time prescription for a statin, fibrate, and/or niacin over the time period between 2003-2012, and had dual observations for pre- and post- prescription lipid levels. The pre-prescription lipid level was required to be within 90 days before the prescription, and the post-prescription lipid test had to be within 365 days after the first-time prescription (Fig. 1). Some patients included may have met this definition for multiple statin exposures during the temporal observational window, albeit with exposure to only one lipid lowering agent at a time. Data from 1086 subjects were included in the study. However, since >77% of observations were attributable to statin exposures, exposures to other agents including fibrates, niacins, or statins in combination with another agent, were excluded from analyses reported in this study.
Figure 1. Selection of Subjects.

Selection of observations
Lipid and drug observations made on each individual were collected for analysis. For subjects prescribed drugs from more than one drug group over time, multiple lipid observations were selected, but only one observation was chosen for each drug group—the observation corresponding to the first time the particular statin drug was prescribed. Lipids investigated were triglyceride concentration (TG), HDL-C, and LDL-C concentrations (Supplemental Table 1). The study investigated lipid response to statins individually in the absence of other statins, niacins, or fenofibrates. Descriptive statistics for the three lipids were calculated for the pre-statin and post-statin laboratory test results (see Supplemental Table 1). We excluded observations if two drug groups were newly prescribed on the same date, since determination of impact on lipid response for each drug individually was preempted. Observations were also excluded if a different new prescription was given between the pre- and post-test, because the new prescription would make it impossible to associate the percentage of lipid change to a specific drug. (See Supplemental Table 2 for the observation selection rules.) An example illustrating the application of these rules is demonstrated in Supplemental Figure 1. Observations were abstracted from Marshfield Clinic electronic medical records collected from November 1, 2003 through October 21, 2012. The selected observations include first-time prescriptions from October 20, 2003 through August 27, 2012.
Data were collected on relevant covariates including body mass index (BMI), smoking status (current, former, never), and type 2 diabetes status. Age was recorded at the time of the first prescription for a particular drug, whereas the other covariates represent the more recent data at the time of data abstraction. A total of 1086 subjects contributed observations (first-time drug prescription, pre- and post-lipid test result), for a total of 1520 observations. More than 77% of the observations were for statins, which is the focus of this investigation. The prevalence of mixed dyslipidemia within drug groups varied. Overall, 25.5% of observations were made on individuals having mixed dyslipidemia, defined as males having TG ≥ 150 mg/dL and HDL<40 mg/dL when tested at the same time, and females having TG ≥ 150 mg/dL and HDL<50 mg/dL when tested at the same time.
The number of days for the post-test lipid levels from the first prescription time ranged from 1 to 364 days, with a median of 92.5 days. Median TG, LDL-C, and HDL-C levels at the pre-test were 136, 108, and 46 mg/dL, respectively. In comparison, post-test median values were 128, 96, and 46 mg/dL, respectively (Supplemental Table 1).
Genotyping and SNP selection
All study participants were genotyped on the Illumina 660W QUAD-W high density SNP array. Individuals were randomized to avoid batch effects. Genotyping procedures, quality control, and results were previously described.14 The SNP array provides good coverage of the common allelic architecture across the genome. Genotype data were linked to electronic medical record information including laboratory values, prescription medications, and diagnostic codes within the Biomedical Informatics Research Center at MCRF.
Taking a targeted approach, the BUD13-APOA5 gene region on chr 11q23 was selected for interrogation based on previous lipid level associations and drug response results. The BUD13-APOA5 region in hg19 coordinates spans the following coordinates—Chr11: 116158912-117128271. All 204 SNPs available on the Illumina 660W-QUAD array within this region were evaluated (Supplemental Table 3). Blinded to phenotype data, quality control checks were performed on the genotype data to ensure that (1) only subjects with ≥90% call rate were used in the analysis, (2) SNPs were filtered to have a minor allele frequency ≥1%, and (3) a call rate of >95% was required for each SNP. In addition, deviation from Hardy-Weinberg equilibrium was tested using Weir's exact test, showing no evidence of systematic deviation (all P >0.001). No samples were excluded on the basis of these quality control measures. One SNP (rs11556024) was excluded for failure to genotype in most samples, leaving 203 SNPs for analysis.
Analyses
Selection of subjects and observations and specific analyses were performed using SAS® software (Version 9.3© 2013 SAS Institute Inc, Cary, NC, USA). Genetic association analyses were performed using the PLINK software package, Version V1.07.17 Data were analyzed separately by statin type, so that each subject contributed to only one set of observations (first prescription and pre-/post-lipid measurements). Linear regression was performed using PLINK and SAS to test for association between genotypes and percent change in lipid levels following the drug. The permutation routine performed in PLINK permutes the endpoint against each SNP in the absence of covariates. The epithelial membrane protein (EMP) 1 is the nominal, permuted P-value from this routine, and the EMP2 value is the family-wise permuted P-value accounting for all SNPs in the region.
The regression model was adjusted for age, BMI, smoking status, race, gender, type 2 diabetes status, and time on the drug (the number of days between the first prescription date and the post-lipid test date). SNP association results were plotted across the region to generate positional plots for the topmost associated SNPs (P <0.001) using SNAP.9
The effect and distribution of lipid response were visualized through boxplots generated in SAS relating change in lipid levels to genotypes for the most highly associated SNPs in the region. To assess these association data for multiple independent signals, pairwise linkage disequilibrium (LD) levels among the top SNPs (linear regression P <0.001) were characterized through PLINK for this study and compared to LD values within the HapMap CEU population. Both D' and r2 values were calculated.18
As the study examined multiple SNPs and three lipids, there was a multiple testing burden that might produce spurious results, using only nominal P-values. Hence, PLINK was used to generate experiment-wise P-values, correcting for multiple testing through 10,000 permutation runs on all data for the top individual SNPs.
Results
Population characteristics and statin exposures are summarized in Supplemental Table 1. Among the 1086 subjects included in the study 53% were female, 9% were current smokers, 43% were former smokers, 23% had a diagnosis of type 2 diabetes mellitus, 98.7% were white, 1% Asian, and 0.3% reported their racial/ethnic origin as ‘other’. The reported BMI ranged from 13.3 to 76.3 kg/m2, averaging 30.4 kg/m2. The large majority of BMI measurements were taken within 5 years of the drug/lipid observations. Age at observations ranged from 47 to 96 years, with an average of 70 years.
Baseline analyses were run to test top SNPs for association with baseline levels of any of the lipids, and no association could be demonstrated (Table 1). Sanger Genevar eQTL tool was run on the top SNPs, and none of them exhibited significant association with mRNA expression level in the HapMap CEU cell lines.
TABLE 1. SNPS Tested for Association with Baseline Levels of Lipids.
| TG pre | TG post | LDL pre | LDL post | HDL pre | HDL post | |
|---|---|---|---|---|---|---|
| mean | 169.2681 | 152.8675 | 113.5754 | 100.4513 | 47.42479 | 47.75692 |
| SD* | 119.6753 | 111.2141 | 39.37626 | 34.71163 | 14.27476 | 13.88466 |
Data normalcy was examined in two ways. A permutation test was done to obtain P-values in a nonparametric manner (this is done in the absence of adjustments for covariates since PLINK does not support adjustment by covariate). Therefore, an additional adjusted analysis was performed using curves. The % change in the three lipids was plotted to assess ‘best fit’ to normal distributions. Plots demonstrate that there is no notable departure from a normal distribution (Supplemental Figure 2).
Using linear regression to test the association between percent lipid change with statin prescription and individual SNP genotype, we identified two associations with P <0.001 and experiment-wise significance (Table 2). Results for the positional association were generated for all SNPs evaluated and are displayed in Supplemental Fig. 3a-c. For TG change, rs11605293, intergenic, and approximately 180kb upstream to BUD13 was associated with attenuated response to TG lowering with pravastatin (P=1.59E-04), and rs12806755, intergenic, and approximately 460kb upstream to BUD13 was associated with attenuated response to TG lowering to lovastatin (P=1.92E-04). In both cases, triglyceride levels actually increased in correlation with copies of the minor allele. Adjusted by age, BMI, gender, race, smoking, type 2 diabetes, and time on drug, there was actually an increase in TG with the addition of each T allele at rs11605293 with pravastatin treatment (Fig. 2a). Similar effects were observed for rs12806755 on TG levels with lovastatin, where the addition of each C allele significantly increased TG instead of the expected decrease (Fig. 2b). Using the permutation testing on the entire dataset to adjust for multiple testing, rs11605293 and rs12806755 had empirical experiment-wise P-values of 0.07 (non-significant) and 0.007, respectively.
TABLE 2. Linear Regression Results for Significant Results.
The three SNPs that exhibit experiment-wise statistical significance are reported. The allele listed corresponds to the frequencies and effect sizes. Effect sizes are the beta coefficients from the linear regression. Asymptotic results are presented for both unadjusted and adjusted regression models. The covariates used in the adjustment are: age, BMI, gender, race, smoking, type 2 diabetes, and the time on the drug. To validate the use of limiting distributions for the asymptotic results, a permutation test was also performed using 10,000 iterations. The nominal permuted P-value is listed under EMP1, while the experiment-wise permuted P-value is listed under EMP2.
| Chr. 11q SNPs | Gene | Drug | Lipid | Minor allele | Unadjusted | Unadjusted 10,000 permutations | Adjusted | ||||||
|---|---|---|---|---|---|---|---|---|---|---|---|---|---|
| Allele | HapMap CEU freq. | Freq for lipid/ drug | No. chr. obs. | Effect Size (beta for % change in mg/dL) | P-value | EMP1 | EMP2 | Effect Size (beta for % change in mg/dL) | P-value | ||||
| rs11605293 | BUD13 | Pravastatin | TG | T | 0.094 | 0.095 | 232 | 0.3659 | 0.000136 | 0.0012 | 0.0699 | 0.3827 | 0.000159 |
| rs12806755 | RPL15P15 / BUD13 | Lovastatin | TG | C | 0.049 | 0.091 | 230 | 0.3059 | 3.9E-05 | 0.0003 | 0.00699 | 0.2905 | 0.000192 |
| rs947990 | BUD13 | Atorvastatin | LDL | A | 0.093 | 0.138 | 698 | 0.1445 | 0.000151 | 0.0001 | 0.0277 | 0.1286 | 0.000668 |
SNP, single-nucleotide polymorphism; BMI, body mass index; EMP1, nominal permuted P-value ; EMP2, experiment-wise permuted P-value; TG, triglyceride; LDL, low-density lipoprotein
Figure 2.
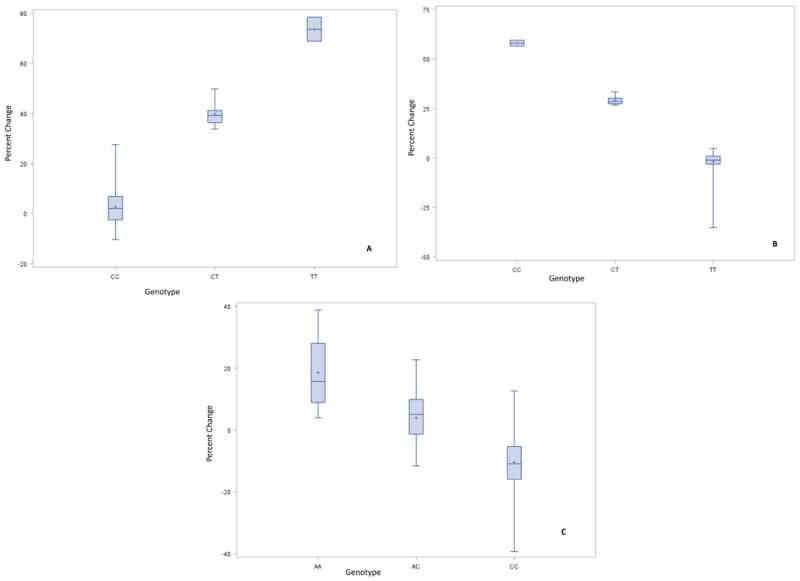
(A) % Change in TG by rs11605293 Genotype for Pravastatin Treatment. (B) % Change in TG by rs12806755 Genotype for Lovastatin Treatment. (C) % Change in LDL by rs947990 Genotype for Atorvastatin Treatment. (adjusted for age, BMI, gender, race, smoking, diabetes2, and time on drug.)
Genotypes at rs947990 were correlated with LDL-C response to treatment with atorvastatin (P=6.68E-04). Permutation testing showed a significant experiment-wise P-value of 0.028 (Fig. 2c). This SNP is approximately 60kb downstream from BUD13. Again, the minor allele (A allele) was coupled with an increase of LDL-C levels, rather than the expected decrease in LDL-C levels (Fig. 2c). Pairwise LD patterns specific to the top SNPs described above are shown in Supplemental Table 4. No significant associations were identified for HDL-C that persisted after permutation testing.
Discussion
In this study we have identified SNPs in the APOA5-BUD13 region that are associated with lipid response to statins. The region of interest was defined to be the 230kbp from (hg38) Chr11:116,639,775-116,869,775, which covers 100kbp centromeric to the 3′ end of BUD13, through the 5′ end of APOA4. Within this region, there are 25 SNPs in the National Human Genome Research Institute catalog of published genome-wide association studies. Using SNAP from the Broad Institute,9 pairwise LD algorithms were run to investigate the rˆ2 values between our three reported SNPs (rs11605293, rs12806755, and rs947990) and each of the previously GWAS-associated 25 SNPs in the catalog. Only two pairs of SNPs exhibited rˆ2 values exceeding 0.20. The top two findings with the highest levels of LD between our SNPs and the previously-reported GWAS-significant SNPs are with rs947990 (Supplemental Table 5). Notably, genome-wide significance was reported by Kim et al. for rs11216126 in a large study of HDL levels in East Asian individuals.10
We have specifically chosen this chromosomal region because SNPs and rare genetic variants in this region have been previously shown to affect triglycerides and HDL-C response to fibrate and fibrate-statin combination therapy levels.11,19,20 The same region was also shown in large genome-wide association studies to be associated with baseline triglyceride and HDL-C levels. One limitation of our study—inherent in the sample set—is that previous use of other drug groups (statins, fibrates, niacin) prior to initiating the drug under investigation was not accounted for in the analyses. However, validation was done to ensure that no simultaneous exposure to multiple treatments was included. Thus, the baseline ‘pre’ measurement for a subsequent statin prescribed to a subject treated with multiple drugs may reflect the level established by exposure to a different drug. Further, whether a drug group was the first drug tried with that individual or a subsequent drug was not factored into the analysis. That said, we believe the genetic association signals from this study represent interesting findings, deserving of additional interrogation.
All statins have a small degree of triglyceride reduction effect including pravastatin and lovastatin.21 By lowering cholesterol availability in the cell, there are less apolipoprotein particles produced in the liver and available for chylomicrons and very low-density lipoprotein production. The result of this is lower measurable plasma TG levels. In our study, the rs11605293 attenuated TG reduction in response to pravastatin, and in many individuals TG levels actually increased in correlation with copies of the minor allele. A similar pattern was observed for rs12806755 and lovastatin. Of note, these SNPs had no effect on LDL-C reduction. A possible mechanism by which this region affects TG reduction by statins could be related to a regulatory effect these SNPs may have on APOA5 expression, as these SNPs are clearly upstream of this gene. However, SNPs outside of the APOA5 region and promoters such as ZNF259 have been shown in prior studies to affect the response to statin-fibrate therapy.11,19,20 It is possible that these SNPs affect APOA5 response to statins and, thus, the availability of TGs to be incorporated into lipoproteins such as low-density lipoprotein, very low-density lipoprotein, and chylomicrons.
Common SNPs within the APOA5 promoter were previously shown to affect LDL-C lowering in individuals receiving statin therapy.11 In our study, the rs947990 minor allele was associated with lack of response, or a paradoxical response, with LDL-C increase to statins in some individuals who carry the minor allele. It is not clear how this SNP affects LDL-C response to statins, but this again can be related to an indirect regulatory effect on APOA5, as has been suggested previously by Hubacek et al.11
In summary we have shown that common genetic variations within the BUD13-APOA5 gene region can affect TG and LDL-C levels in response to statins. Further studies are needed to confirm the importance of this region to lipid response to statins.
Supplementary Material
Supplemental Figure 1: Selection of Lipid Measurements
Example schematic (not drawn to scale) of the timing of the selection of triglyceride (TG) observations for a subject. Note that observation 1 uses the post TG result in the preferred 14-90 day range rather than the second choice post TG result in the 1-13 day range. No observation is selected for drug group 9 despite a pre/post pair of TG tests within range because there was a new prescription before the post TG test. Nor is there an observation for drug group 3 because there was no pre TG test within the 90 days prior to the prescription. Observation 2 uses the pre‐TG test closest to the date of prescription and the later of the two post TG tests that were equally close (±15 days) to day 35.
Supplemental Figure 2: Normalcy Evaluation: The % change in the three lipid (HDL, LDL, TG) was plotted and to assess ‘best fit’ to normal distributions. Plots demonstrate that there is no notable departure from a normal distribution.
Supplemental Figure 3: Positional association plot for TG response to (A) pravastatin, (B) lovastatin, and (C) positional association plot for LDL-C response to atorvastatin.
Acknowledgments
The authors wish to express their deepest gratitude to the PMRP bio-repository participants, generous donors to the Marshfield Clinic, and managers, Marshfield Core Laboratory staff, and the Center for Inherited Disease Research (CIDR) for the original lab work. We thank Crystal Jacobs and Rob Strenn for the initial data abstraction, Terrie Kitchner for IRB paperwork and coordination, Marlene Stueland for administration, Dr. Aaron Miller and Dr. Tonia Carter for their support with SAS software, and Dr. Ingrid Glurich and Marie Fleisner for editorial assistance in preparing and submitting the manuscript.
This study was supported by Marshfield Clinic Research Foundation, generous donors to Marshfield Clinic, and the Clinical and Translational Science Award (CTSA) program, previously through the National Center for Research Resources (NCRR) grant 1UL1RR025011 and the National Center for Advancing Translational Sciences (NCATS) grant 9U54TR000021, and now by the NCATS grant UL1TR000427. The content is solely the responsibility of the authors and does not necessarily represent the official views of the NIH.
Footnotes
Conflict of interest statement: The authors report no conflict of interest.
References
- 1.Eckel RH, Jakicic JM, Ard JD, et al. 2013 AHA/ACC guideline on lifestyle managementto reduce cardiovascular risk: a report of the American College of Cardiology/ American/Heart Association Task Force on Practice Guidelines. Circulation. 2014;129:S76–S99. doi: 10.1161/01.cir.0000437740.48606.d1. [DOI] [PubMed] [Google Scholar]
- 2.Meqa JL, Morrow DA, Brown A, et al. Identification of genetic variants associated with response to statin therapy. Arterioscler Thromb Vasc Biol. 2009;29:1310–15. doi: 10.1161/ATVBAHA.109.188474. [DOI] [PubMed] [Google Scholar]
- 3.Barber MJ, Mangravite LM, Hyde CL, et al. Genome-wide association of lipid-lowering response to statins in combined study populations. PLoS ONE. 2010;5:e9763. doi: 10.1371/journal.pone.0009763. [DOI] [PMC free article] [PubMed] [Google Scholar]
- 4.Thompson JF, Hyde CL, Wood LS, et al. Comprehensive whole-genome and candidate gene analysis for response to statin therapy in the Treating to New Targets (TNT) cohort. Circ Cardiovasc Genet. 2009;2:173–181. doi: 10.1161/CIRCGENETICS.108.818062. [DOI] [PubMed] [Google Scholar]
- 5.Postmus I, Trompet S, Deshmukh HA, et al. Pharmacogenetic meta-analysis of genome-wide association studies of LDL cholesterol response to statins. Nat Commun. 2014;5:5068. doi: 10.1038/ncomms6068. 28. [DOI] [PMC free article] [PubMed] [Google Scholar]
- 6.Chasman DI, Posada D, Subrahmanyan L, et al. Pharmacogenetic study of statin therapy and cholesterol reduction. JAMA. 2004;291:2821–2827. doi: 10.1001/jama.291.23.2821. [DOI] [PubMed] [Google Scholar]
- 7.Gryn SE, Hegele RA. Pharmacogenomics, lipid disorders, and treatment options. Clin Pharmacol Ther. 2014;96:36–47. doi: 10.1038/clpt.2014.82. [DOI] [PubMed] [Google Scholar]
- 8.Do R, Stitziel NO, Won HH, et al. Exome sequencing indentifies rare LDLR and APOA5 alleles conferring risk for myocardial infarction. Nature. 2015;518:102–106. doi: 10.1038/nature13917. [DOI] [PMC free article] [PubMed] [Google Scholar]
- 9.Johnson AD, Handsaker RE, Pulit S, et al. SNAP: a web-based tool for identification and annotation of proxy SNPs using HapMap. Bioinformatics. 2008;2:2938–2939. doi: 10.1093/bioinformatics/btn564. [DOI] [PMC free article] [PubMed] [Google Scholar]
- 10.Kim YJ, Go MJ, Hu C, et al. Large-scale genome-wide association studies in East Asians identify new genetic loci influencing metabolic traits. Nat Genet. 2011;43:990–995. doi: 10.1038/ng.939. [DOI] [PubMed] [Google Scholar]
- 11.Hubacek JA, Adamkova V, Prusikova M, et al. Impact of apolipoprotein A5 variants on statin treatment efficacy. Pharmacogenomics. 2009;10:945–950. doi: 10.2217/pgs.09.17. [DOI] [PubMed] [Google Scholar]
- 12.McCarty CA, Wilke RA, Giampietro PF, et al. Marshfield Clinic Personalized Medicine Research Project (PMRP): design, methods and recruitment for a large population-based biobank. Personalized Medicine. 2005;2:49–79. doi: 10.1517/17410541.2.1.49. [DOI] [PubMed] [Google Scholar]
- 13.McCarty CA, Mukesh BN, Giampietro PF, et al. Healthy People 2010 disease prevalence in the Marshfield Clinic Personalized Medicine Research Project cohort: opportunities for public health genomic research. Personalized Medicine. 2007;4:183–190. doi: 10.2217/17410541.4.2.183. [DOI] [PubMed] [Google Scholar]
- 14.Pendergrass SA, Verma SS, Holzinger ER, et al. Next-generation analysis of cataracts: determining knowledge driven gene-gene interactions using Biofilter, and gene-environment interactions using the PhenX Toolkit. Pac Symp Biocomput. 2013:147–158. [PMC free article] [PubMed] [Google Scholar]
- 15.Hebbring SJ, Slager SL, Epperla N, et al. Genetic evidence of PTPN22 effects on chronic lymphocytic leukemia. Blood. 2013;121:237–238. doi: 10.1182/blood-2012-08-450221. [DOI] [PMC free article] [PubMed] [Google Scholar]
- 16.Hebbring SJ, Schrodi SJ, Ye Z, et al. A PheWAS approach in studying HLA-DRB1*1501. Genes Immun. 2013;14:187–191. doi: 10.1038/gene.2013.2. [DOI] [PMC free article] [PubMed] [Google Scholar]
- 17.Purcell S, Neale B, Todd-Brown K, et al. PLINK: a toolset for whole-genome association and population-based linkage analysis. Am J Hum Genet. 2007;81:559–575. doi: 10.1086/519795. [DOI] [PMC free article] [PubMed] [Google Scholar]
- 18.Barrett JC, Fry B, Maller J, et al. Haploview: analysis and visualization of LD and haplotype maps. Bioinformatics. 2005;21:263–265. doi: 10.1093/bioinformatics/bth457. [DOI] [PubMed] [Google Scholar]
- 19.Brautbar A, Covarrubias D, Belmont J, et al. Variants in the APOA5 gene region and the response to combination therapy with statins and fenofibric acid in a randomized clinical trial of individuals with mixed dyslipidemia. Atherosclerosis. 2011;219:737–742. doi: 10.1016/j.atherosclerosis.2011.08.015. [DOI] [PMC free article] [PubMed] [Google Scholar]
- 20.Brautbar A, Barbalic M, Chen F, et al. Rare APOA5 promoter variants associated with paradoxical HDL cholesterol decrease in response to fenofibric acid therapy. J Lipid Res. 2013;54:1980–1987. doi: 10.1194/jlr.M034132. [DOI] [PMC free article] [PubMed] [Google Scholar]
- 21.Jones PH, Davidson MH, Stein EA, et al. Comparison of the efficacy and safety of rosuvastatin versus atorvastatin, simvastatin, and pravastatin across doses (STELLAR* Trial) Am J Cardiol. 2003;92:152–160. doi: 10.1016/s0002-9149(03)00530-7. [DOI] [PubMed] [Google Scholar]
Associated Data
This section collects any data citations, data availability statements, or supplementary materials included in this article.
Supplementary Materials
Supplemental Figure 1: Selection of Lipid Measurements
Example schematic (not drawn to scale) of the timing of the selection of triglyceride (TG) observations for a subject. Note that observation 1 uses the post TG result in the preferred 14-90 day range rather than the second choice post TG result in the 1-13 day range. No observation is selected for drug group 9 despite a pre/post pair of TG tests within range because there was a new prescription before the post TG test. Nor is there an observation for drug group 3 because there was no pre TG test within the 90 days prior to the prescription. Observation 2 uses the pre‐TG test closest to the date of prescription and the later of the two post TG tests that were equally close (±15 days) to day 35.
Supplemental Figure 2: Normalcy Evaluation: The % change in the three lipid (HDL, LDL, TG) was plotted and to assess ‘best fit’ to normal distributions. Plots demonstrate that there is no notable departure from a normal distribution.
Supplemental Figure 3: Positional association plot for TG response to (A) pravastatin, (B) lovastatin, and (C) positional association plot for LDL-C response to atorvastatin.