Abstract
Chronic inflammation results in increased production of reactive oxygen species (ROS), which can oxidize cellular molecules including lipids and DNA. Our laboratory has shown that 3-(2-deoxy-β-D-erythro-pentofuranosyl) pyrimido[1,2-α]purin-10(3H)-one (M1dG) is the most abundant DNA adduct formed from the lipid peroxidation product, malondialdehyde, or the DNA peroxidation product, base propenal. M1dG is mutagenic in bacterial and mammalian cells and is repaired via the nucleotide excision repair system. Here, we report that M1dG levels in intact DNA were increased from basal levels of 1 adduct per 108 nucleotides to 2 adducts per 106 nucleotides following adenine propenal treatment of RKO, HEK293, or HepG2 cells. We also found that M1dG in genomic DNA was oxidized in a time-dependent fashion to a single product, 6-oxo-M1dG (to ~5 adducts per 107 nucleotides), and that this oxidation correlated with a decline in M1dG levels. Investigations in RAW264.7 macrophages indicate the presence of high basal levels of M1dG (1 adduct per 106 nucleotides) and the endogenous formation of 6-oxo-M1dG. This is the first report of the production of 6-oxo-M1dG in genomic DNA in intact cells, and it has significant implications for understanding the role of inflammation in DNA damage, mutagenesis, and repair.
Graphical abstract

INTRODUCTION
Inflammation is a complex biological process that is a contributing factor in the progression of many diseases, including cancer.1–3 During inflammatory signaling, an array of reactive oxygen species (ROS) is generated by activated leukocytes.4 These ROS are capable of inducing cellular damage through their reaction with biomolecules. For example, oxidation of polyunsaturated fatty acids or the DNA backbone results in the generation of the reactive electrophiles malondialdehyde (MDA) or base propenal, respectively (Figure 1).5–8 These electrophiles may function as a connection between chronic inflammation and the generation of DNA damage that may result in genetic mutations.9
Figure 1.
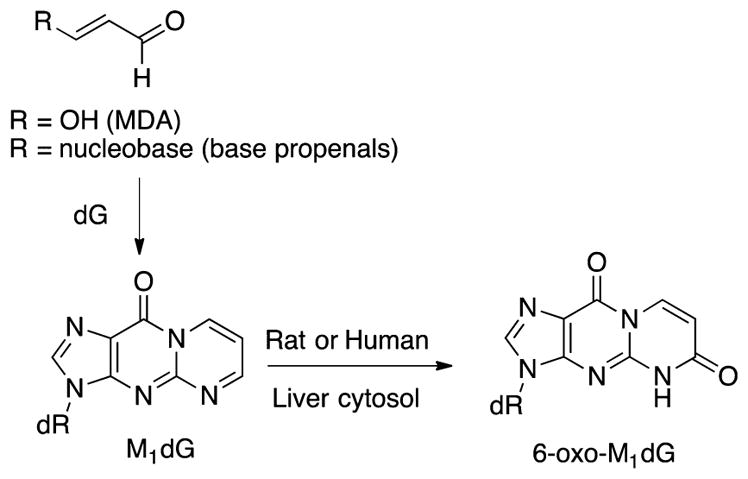
Formation of M1dG from MDA and base propenal and the oxidation of M1dG to 6-oxo-M1dG.
Our laboratory and others have demonstrated that base propenals, as well as MDA, react with DNA to generate a variety of adducts, including the most abundant species, 3-(2-deoxy-β-D-erythro-pentofuranosyl)pyrimido[1,2-α]purin-10(3H)-one (M1dG) (Figure 1).8,10–15 M1dG has been extensively studied and shown to be mutagenic through the induction of base-pair substitutions and frameshift mutations. 5,14,16,17 It has also been detected in the genomic DNA of healthy and disease-bearing individuals, with adduct levels reaching as high as 6500 per cell.5,18–22 We recently reported that M1dG is rapidly removed from plasma in vivo after intravenous administration to rats.23 This fast disappearance of M1dG from the plasma suggested that it was distributed to tissue, thereby increasing the likelihood of its biotransformation. Further studies showed that, after its removal from DNA by nucleotide excision repair (NER), free M1dG is enzymatically oxidized by xanthine oxidase and aldehyde oxidase to form a single metabolite, 6-oxo-M1dG (Figure 1).23 This oxidation of M1dG at the mononucleoside level suggested the possibility that the lesion may also be enzymatically oxidized while present in genomic DNA.
In this study, we report that nuclear extracts isolated from the human colon carcinoma cell line RKO can enzymatically oxidize an oligonucleotide bearing M1dG. Treatment of several distinct cell types, including human embryonic kidney (HEK293), human liver carcinoma (HepG2), and RKO cells, with adenine propenal resulted in the generation of M1dG in genomic DNA and its subsequent oxidation to 6-oxo-M1dG in the genome. These results provide the first demonstration of the oxidation of M1dG to 6-oxo-M1dG in genomic DNA, and they suggest that M1dG is oxidized faster than it is removed by NER. The discovery of M1dG oxidation to 6-oxo-M1dG in genomic DNA provides the foundation upon which to further elucidate the cellular consequences of this oxidized lesion in DNA.
METHODS
General
All chemicals were obtained from commercial sources and used without further purification unless otherwise noted. Anhydrous solvents were purchased from Sigma-Aldrich, St. Louis, MO. All 1H and 13C NMR spectra were referenced to internal tetramethylsilane (TMS) at 0.0 ppm. The spin multiplicities are indicated by the symbols s (singlet), d (doublet), dd (doublet of doublets), t (triplet), q (quartet), m (multiplet), and br (broad). Reactions were monitored by thin-layer chromatography (TLC). Column chromatography was performed using commercial silica gel and eluted with the indicated solvent system. Yields refer to chromatographically and spectroscopically (1H and 13C NMR) homogeneous materials.
Preparation of Adenine Propenal
Adenine propenal was prepared as previously described.7 Briefly, to adenine (100 mg, 0.740 mmol) suspended in anhydrous dimethylformamide (3 mL) was added NaOMe (40 μL, 25 wt %). The mixture was stirred for 1 h and then cooled to –40 °C. Propynal (500 μL, 2.960 mmol) was added, and stirring was continued at –40 °C for 1 h, after which the reaction was allowed to warm to room temperature and neutralized with NH4Cl. The precipitated product was collected and recrystallized from boiling water. Yield 48 mg, 35%. 1H NMR (DMSO-d6): δ (ppm) 7.17 (dd, J1 = 7.88 Hz, J2 = 14.4 Hz, 1H), 7.55 (br s, 2H), 8.27 (s, 1H), 8.35 (d, J = 14.4 Hz, 1H), 8.63 (s, 1H), 9.67 (d, J = 7.88 Hz, 1H).
Preparation of RKO Cellular Extracts
RKO cells (10 × 106 cells/plate, 150 mm in diameter, total of five plates) were grown in RPMI 1640 medium with 10% fetal bovine serum at 37 °C with 5% CO2. The cells were harvested and washed twice with cold PBS. Cells were then lysed for 30 min on ice in a hypotonic lysis buffer containing 10 mM HEPES/KOH, pH 7.9, 1.5 mM MgCl2, 10 mM KCl, 0.5% octylphenoxy poly(ethyleneoxy)ethanol (IGEPAL), and protease and phosphatase inhibitors (1:500). The nuclei were isolated by centrifugation, and the pellet was washed with hypotonic buffer and lysed in 50 mM HEPES, 150 mM NaCl, 1% IGEPAL, and protease and phosphatase inhibitors. The pellet was passed through a 27 gauge needle and sonicated. The samples were then centrifuged at 1000g for 10 min, and the supernatant was used in subsequent assays as the nuclear extract.
Preparation of Oligonucleotides Containing M1dG
Single- or double-stranded oligonucleotides (500 μM) in 10 mM potassium phosphate buffer, pH 7, were treated with 2 mM adenine propenal for 24 h. The oligonucleotides were then ethanol precipitated and resuspended in pH 7 phosphate buffer. An aliquot was digested to confirm the presence of M1dG. Briefly, 500 units of DNase I in 15 mM MgCl2 and 10 mM MOPS buffer (pH 7.9) was added to the DNA in solution. This mixture was allowed to incubate for 1.5 h followed by the addition of nuclease P1 (15 units) and 1 mM ZnCl2 followed by a 2.5 h incubation period. Alkaline phosphatase (50 units) and phoshodiesterase I (8 units) were added, and the mixture was incubated for 15 h. Ice-cold ethanol was added to the mixture followed by centrifugation (9391g for 10 min). The supernatants were removed and evaporated using a TurboVap LV evaporator, giving a residue that was dissolved in water. Liquid chromatography-tandem mass spectrometry (LC-MS/MS) was then performed to confirm the presence of M1dG. Mobile phase solvents consisting of 0.1% formic acid in water (solvent A) and 0.1% formic acid in a 1:1 methanol/acetonitrile mixture (solvent B) at a flow rate of 0.4 mL/min were used to elute the digested nucleosides. The 5 min gradient consisted of the following: 0–0.01 min, 5% B; 0.01–0.50 min, 5% B; 0.5–3.50 min, 60% B; 3.50–3.51 min, 98% B; 3.51–5.00 min, 98% B. Mass analysis of the eluting nucleosides was performed on a 3200 Q TRAP mass spectrometer (AB Sciex Systems) equipped with an electrospray ionization source with detection in positive ion mode. M1dG was detected with selected reaction monitoring with the following transition, m/z 304 → 188, corresponding to the cleavage of the glycosidic bond and neutral loss of the deoxyribose moiety (–116 Da), with the positive charge remaining on the base.
Incubation of M1dG Oligo with RKO Cellular Extracts
Once the presence of M1dG had been established, oligonucleotides containing M1dG were incubated with RKO nuclear extract (2 mg/mL) for 2 h at 37 °C. Following incubation, the reaction was quenched with cold ethanol, and the DNA was precipitated and washed several times to eliminate any traces of the nuclear extract. The oligonucleotide was then digested and analyzed by LC-MS/MS as described above. 6-Oxo-M1dG was detected with selected reaction monitoring with the following transition, m/z 320 → 204, corresponding to the cleavage of the glycosidic bond and neutral loss of the deoxyribose moiety (–116 Da), with the positive charge remaining on the base.
Cell Culture and Treatment of Cells with Adenine Propenal
In these experiments, RKO, HEK293, or HepG2 cells (5 × 10⁶) were grown in RPMI 1640 medium with 10% fetal bovine serum at 37 °C with 5% CO2 on plates 150 mm in diameter (five plates were used for each treatment). After 24 h, the medium was removed, and fresh medium without serum but containing adenine propenal (400 μM) was added. Then the cells were incubated for 0, 15, 30, 60, 180, or 360 min to determine a time point at which M1dG had reached a maximum without the formation of 6-oxo-M1dG. Following incubation, the cells were harvested and washed twice with cold PBS. The cells were lysed in a 1 mL solution containing 250 mM sucrose, 1 mM EDTA, 20 mM HEPES (pH 7), and 0.2% protease inhibitor cocktail. The cells were then passed 10 times through a 26 gauge needle. The nuclei were pelleted at 1000g at 4 °C for 5 min. The nuclei were washed with 3 × 500 μL of a solution containing 10 mM HEPES buffer (pH 7), 1.5 mM MgCl2, 10 mM KCl, 0.5% IGEPAL, and 0.2% protease inhibitor cocktail for 30 min on ice. The nuclei were then resuspended in a buffer comprising 10 mM MOPS-NaOH, pH 7.9, 0.1 mM deferoxamine, and 5 mM EDTA, pH 8.0. The mixture was vortexed to allow lysis of the nuclear membrane, followed by the addition of RNase A and RNase T1. The mixture was incubated at 37 °C for 15 min followed by the addition of proteinase K and incubation at 37 °C for 3 h with mixing every 30 min. Following this incubation, a solution comprising 40 mM MOPS buffer, pH 8.0, 4.5 M NaI, 20 mM EDTA, and 0.1 mM deferoxamine was added. This was followed by the addition of isopropanol to precipitate the DNA. The DNA was collected by centrifugation and washed with 75% EtOH twice. The DNA was then reprecipitated with 3 M sodium acetate and isopropanol, washed with 75% EtOH and dissolved in DNase-free water. The DNA concentration was determined using a Nanodrop spectrophotometer at the Vanderbilt Technologies for Advanced Genomics (VANTAGE) Core. Internal standards, [15N5]-6-oxo-M1dG and [15N2,13C]-M1dG (5 or 10 pmol), were then added to the mixtures, and the DNA was digested and analyzed by LC-MS/MS as described above. In order to further validate the levels of M1dG and 6-oxo-M1dG, steps were taken to ensure that there were no analyte peak contributions from the internal standards (Supporting Information Figure S1). Also, collision-induced dissociation fragments were obtained for peaks corresponding to M1dG and 6-oxo-M1dG to confirm their identities (Supporting Information Figures S2 and S3).
Oxidation of M1dG to 6-Oxo-M1dG in Genomic DNA
RKO, HEK293, and HepG2 cells were cultured as described above. However, prior to treatment with adenine propenal, the cells were synchronized in serum-free medium for 24 h and maintained in serum-free medium to prevent incorporation from nucleoside pools during DNA synthesis. Adenine propenal was added for the appropriate times as determined above for each cell type. The experiment then proceeded as described above, and the DNA was isolated from the nuclei at 0, 1, 2, 3, 6, 9, 12, and 24 h time points. The amount of adducts was quantified by LC-MS/MS.
Oxidation of M1dG to 6-Oxo-M1dG in Genomic DNA in RAW264.7 Macrophages
In these experiments, RAW264.7 macrophages (5 × 10⁶) were grown in DMEM + Glutamax medium (Invitrogen) with 10% fetal bovine serum at 37 °C with 5% CO2 on 10 × 150 mm plates (five plates were used for each treatment). After 24 h of incubation, the medium containing fetal bovine serum was replaced with serum-free medium for 24 h. The cells were then harvested at times 0 and 24 h. DNA was isolated from the nuclei and analyzed by LC-MS/MS as described above.
Statistical Analysis
Statistical analyses and generation of graphs were performed using GraphPad Prism 6.0c (GraphPad Software, San Diego, CA). Differences in adduct levels between controls and treatments in triplicate experiments were determined using a one-way ANOVA and Tukey posthoc analysis. Differences were considered to be significant at p < 0.05.
RESULTS
Oxidation of M1dG in Oligonucleotides
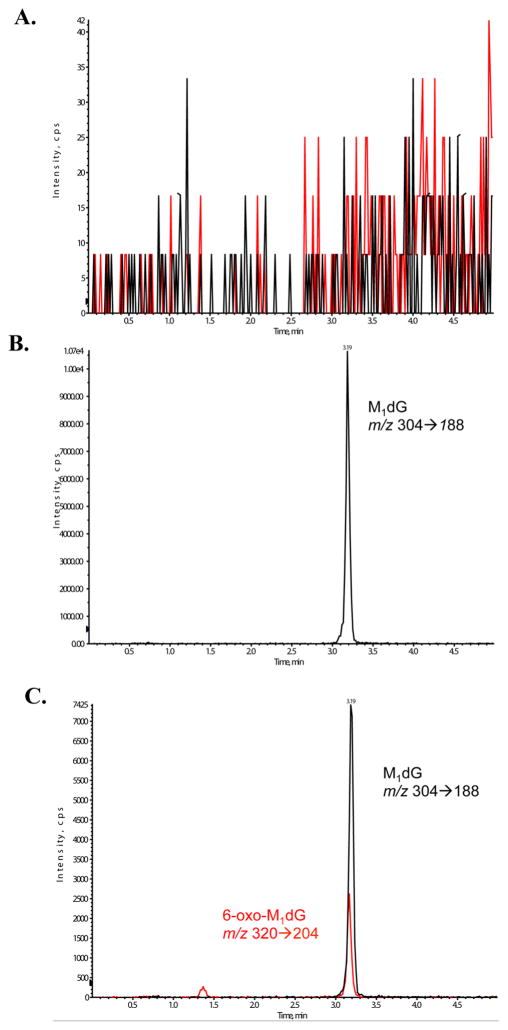
Our recent finding that the free M1dG nucleoside is oxidized by cytosolic xanthine oxidase23 to 6-oxo-M1dG suggested the possibility that the oxidation of M1dG may occur while present in nuclear DNA. To explore this possibility, single- or double-stranded oligonucleotides were treated with adenine propenal to generate M1dG. Figure 2A highlights a representative LC-MS/MS chromatogram showing selected reaction monitoring (SRM) for both M1dG and 6-oxo-M1dG from a digested double-stranded oligonucleotide prior to any treatment. This chromatogram demonstrates that there are no analyte impurities that could contribute to the signals of M1dG and 6-oxo-M1dG in subsequent analyses. Following adenine propenal treatment, the oligonucleotides were precipitated and enzymatically digested to confirm the presence of M1dG by LC-MS/MS, as depicted in a representative chromatogram in Figure 2B. Additionally, internal standards, [15N5]-6-oxo-M1dG and [15N2,13C]-M1dG, were assessed to ensure that they did not have analyte impurities that could bias the levels observed in the analyses (Supporting Information Figure S1).
Figure 2.
(A) Representative LC-MS/MS chromatogram showing selected reaction monitoring (SRM) for both M1dG (black) and 6-oxo-M1dG (red) from a digested double-stranded oligonucleotide in the absence of adenine propenal treatment. (B) Representative LC-MS/MS chromatogram showing SRM of M1dG from a digested double-stranded oligonucleotide after treatment with adenine propenal. M1dG (black) was detected with the following transition, m/z 304 →188, corresponding to the cleavage of the glycosidic bond and neutral loss of the deoxyribose moiety (–116 Da). No 6-oxo-M1dG was detected. (C) Representative LC-MS/MS chromatogram showing SRM of M1dG and 6-oxo-M1dG of a digested double-stranded oligonucleotide after treatment with adenine propenal and RKO nuclear extract. Visible are peaks for M1dG (black) and 6-oxo-M1dG (red). 6-Oxo-M1dG (red) was detected with the following transition, m/z 320 → 204, corresponding to the cleavage of the glycosidic bond and neutral loss of the deoxyribose moiety (–116 Da).
Once the presence of M1dG was confirmed, the oligonucleotide was incubated with RKO nuclear extract and digested. LC-MS/MS data presented in Figure 2C demonstrate that RKO nuclear extracts are able to transform M1dG to 6-oxo-M1dG when present in an oligonucleotide. Quantification of this conversion in Figure 3 indicated that it was more efficient in single-stranded DNA (40%) compared to that in double-stranded DNA (20%). The oxidation of M1dG was not inhibited by the xanthine oxidase inhibitor allopurinol (data not shown), an observation that contrasts with oxidation of the mononucleoside M1dG in rat or human liver cytosol. Additionally, as shown in Figure 3, the oxidation of M1dG in DNA is enzymatic, as evidenced by an ablation of activity following heat denaturation of the nuclear extract.
Figure 3.
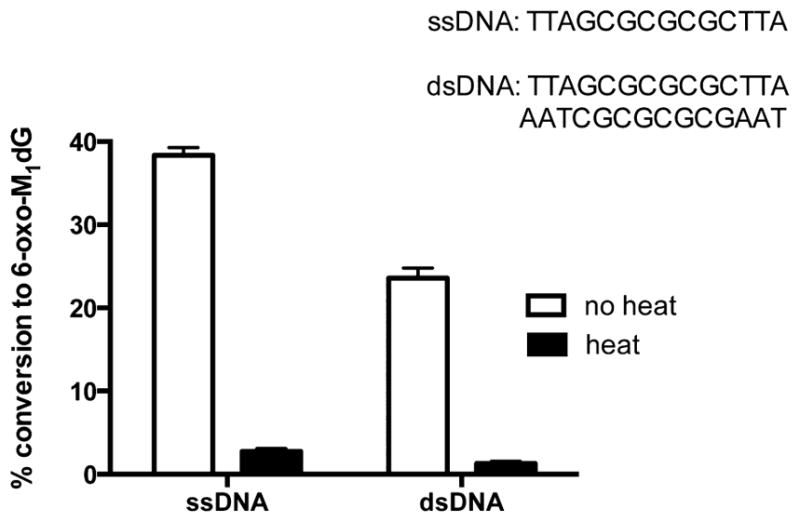
Quantification of the conversion of M1dG in a single-stranded (ss) or double-stranded (ds) oligonucleotide to 6-oxo-M1dG by a control (no heat) or denatured (heat) RKO nuclear extract. Data represent the mean ± SD of triplicate determinations.
M1dG Is Oxidized in Nuclear DNA in Cells
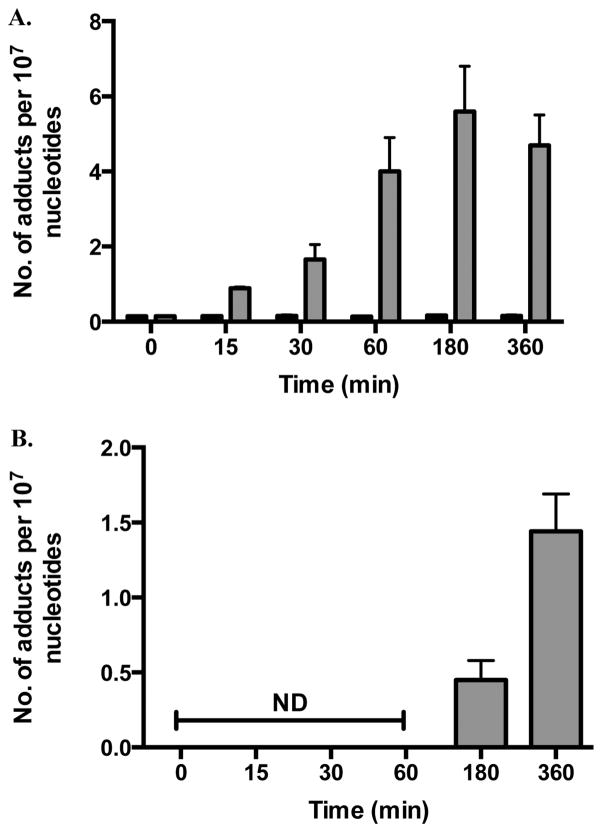
Since M1dG was enzymatically oxidized in oligonucleotides by nuclear extracts, experiments were conducted to investigate if this oxidation was possible with M1dG in the genomic DNA of intact cells. The colon cancer cell line, RKO, was treated with adenine propenal (400 μM) for various periods of time to increase intracellular M1dG levels. DNA was then isolated from the nucleus and analyzed by LC-MS/MS for M1dG and 6-oxo-M1dG. As shown in Figure 4A, M1dG was detected in the genome of RKO cells following treatment with adenine propenal. An oxidation product was also observed and identified as 6-oxo-M1dG (Figure 4B). The levels of M1dG steadily increased from <1 to 6 adducts per 107 nucleotides over 3 h and then decreased by the 6 h time point (Figure 4A). This decrease in the levels of M1dG was accompanied by an equivalent increase in the levels of 6-oxo-M1dG (Figure 4B). To further verify the identity of the peaks in the cellular samples, CID spectra of peaks corresponding to M1dG and 6-oxo-M1dG were obtained (Supporting Information Figures S2 and S3). The fragmentation pattern was consistent with the structures for M1dG and 6-oxo-M1dG.
Figure 4.
M1dG and 6-oxo-M1dG levels in RKO cells after treatment with adenine propenal (400 μM) for the indicated times. Data are shown for vehicle-treated (black) and adenine propenal-treated (gray) cells and indicate levels of M1dG (A) and 6-oxo-M1dG (B) in the nucleus. Data represent the mean ± SD of triplicate determinations.
M1dG Disappearance via Oxidation and Repair
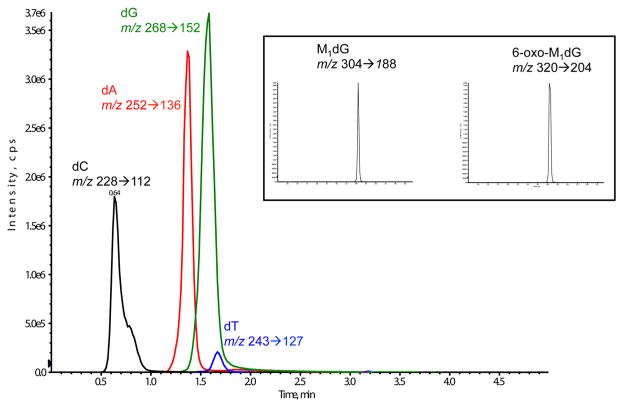
The data presented in Figure 4A,B provide initial insight into the fate of M1dG by oxidation versus NER. Previous reports have suggested that M1dG is removed from DNA via NER based on the observation that M1dG is more mutagenic in NER-deficient cells.16,24 The results presented here, however, suggest that M1dG is more rapidly oxidized to 6-oxo-M1dG than repaired by NER. To test this hypothesis, RKO cells were synchronized by serum starvation, which arrests them in the G0/G1 phase of the cell cycle. By preventing the transition into S phase, incorporation from nucleoside pools during DNA synthesis does not occur.25–27 The cells were then treated with adenine propenal for 1 h, after which the medium was removed, and adenine propenal-free medium was added. Cells were harvested at various time points, and adduct levels were determined. The 1 h treatment time was chosen because M1dG reached maximal levels without the formation of 6-oxo-M1dG at this time point (Figure 4A). Consequently, this experiment allowed for a quantitative measure of the time course of disappearance of M1dG. The results in Figure 5A show that M1dG decreased from a maximum of 8 adducts per 107 nucleotides to 2 adducts per 107 nucleotides over 24 h. This was accompanied by an equivalent increase in the oxidized product, 6-oxo-M1dG, beginning after 3 h of incubation following adenine propenal treatment (Figure 5B). A representative LC-MS/MS chromatogram obtained by analysis of the nuclear DNA of adenine propenal-treated cells is shown in Figure 6. The four natural nucleosides were observed in addition to M1dG and 6-oxo-M1dG.
Figure 5.
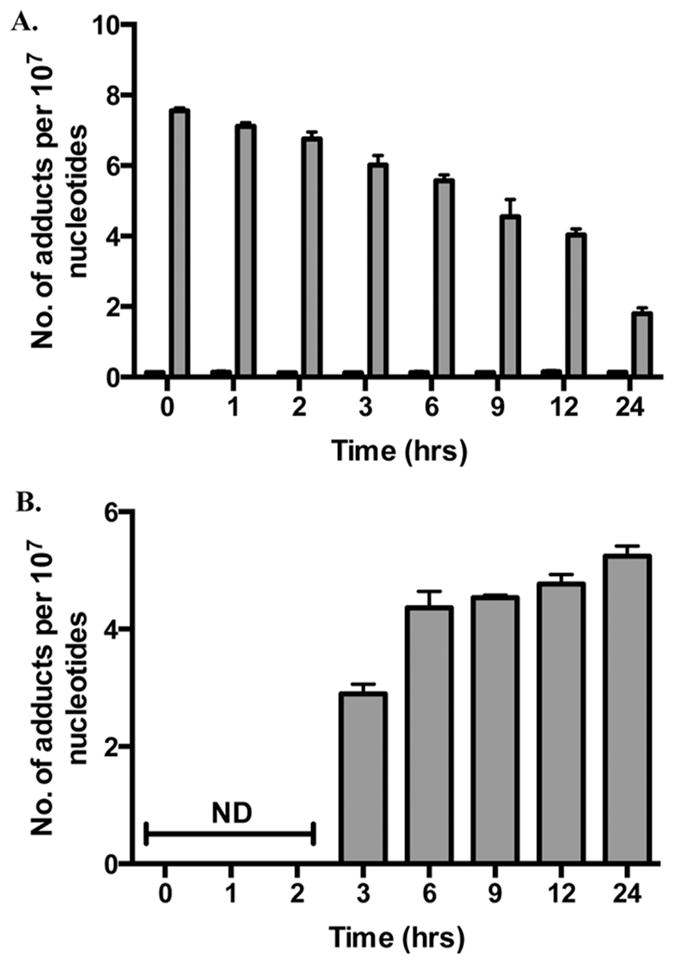
M1dG and 6-oxo-M1dG levels in synchronized RKO cells after treatment with adenine propenal for 1 h followed by incubation for the indicated times. Data are shown for vehicle treated (black) and adenine propenal-treated (gray) cells and indicate levels of M1dG (A) and 6-oxo-M1dG (B) in the nucleus. Data represent the mean ± SD of triplicate determinations. The data shows that during the first 3 h following adenine propenal treatment M1dG levels declined by approximately 10%, whereas a 73% decline was observed between the 3 and 24 h time points. An almost equivalent (80%) increase in the levels of 6-oxo-M1dG was seen between the 3 and 24 h time points.
Figure 6.
Representative LC-MS/MS chromatogram showing SRM of natural nucleosides as well as M1dG and 6-oxo-M1dG from digested nuclear DNA following treatment with 400 μM adenine propenal in RKO cells. Nucleosides were detected following the loss of the deoxyribose sugar.
M1dG Oxidation Occurs in the Nuclear DNA of Numerous Cell Lines
To determine if M1dG oxidation occurs in other cell types, 6-oxo-M1dG levels in synchronized, adenine propenal-treated HEK293 and HepG2 cells were measured. M1dG was oxidized in both cell lines, with measurable 6-oxo-M1dG appearing at 3 h and increasing for up to 24 h. The data in Figure 7A show that M1dG decreased from a maximum of 12 adducts per 107 nucleotides to 3 adducts per 107 nucleotides over 24 h in the HEK293 cells. This was accompanied by an increase in the level of 6-oxo-M1dG, beginning after 3 h following adenine propenal treatment to a maximum of 10 adducts per 107 nucleotides at 24 h (Figure 7B). M1dG levels were initially higher in the treated HepG2 cells (Figure 8A), beginning at 20 adducts per 107 nucleotides and decreasing to 5 adducts per 107 over 24 h. Similar to the RKO and HEK293 cells, 6-oxo-M1dG was detected after 3 h following adenine propenal treatment and reached 6 adducts per 107 at 24 h (Figure 8B).
Figure 7.
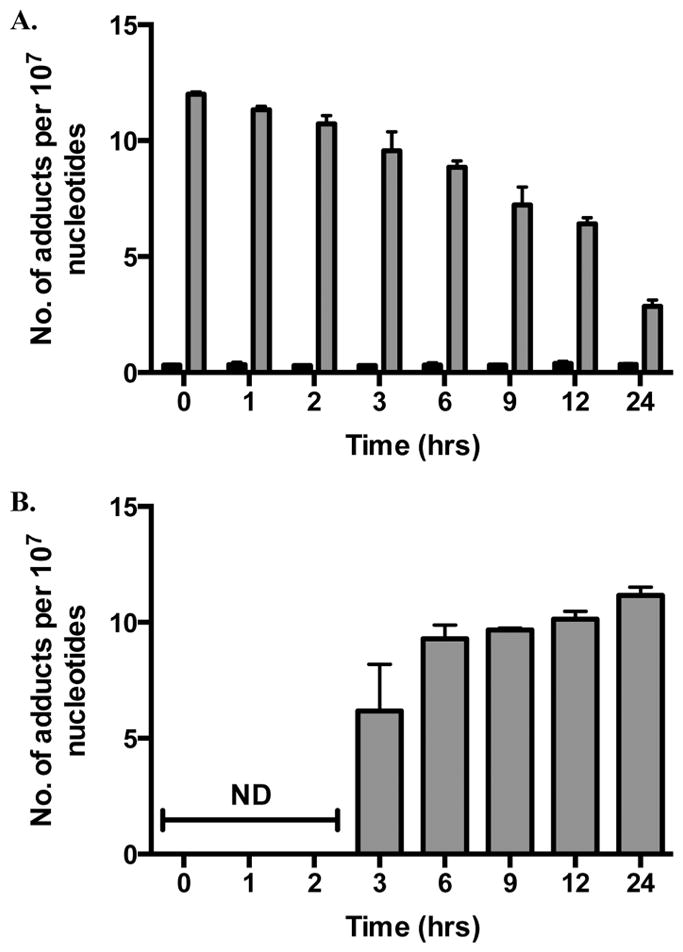
M1dG and 6-oxo-M1dG levels in synchronized HEK293 cells after treatment with adenine propenal for 1 h followed by incubation for the indicated times. Data are shown for vehicle-treated (black) and adenine propenal-treated (gray) cells and indicate levels of M1dG (A) and 6-oxo-M1dG (B) in the nucleus. Data represent the mean ± SD of triplicate determinations. The data shows that during the first 3 h following adenine propenal treatment M1dG levels declined by approximately 20%, whereas a 73% decline was observed between the 3 and 24 h time points. An almost equivalent (80%) increase in the levels of 6-oxo-M1dG was seen between the 3 and 24 h time points.
Figure 8.
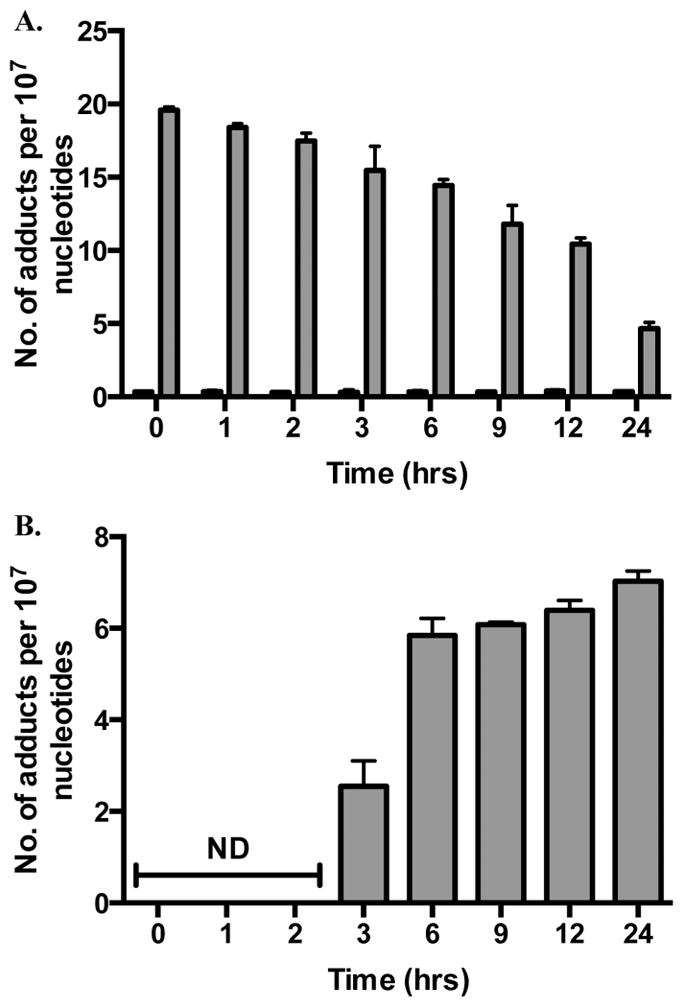
M1dG and 6-oxo-M1dG levels in synchronized HepG2 cells after treatment with adenine propenal for 1 h followed by incubation for the indicated times. Data are shown for vehicle-treated (black) and adenine propenal-treated (gray) cells and indicate levels of M1dG (A) and 6-oxo-M1dG (B) in the nucleus. Data represent the mean ± SD of triplicate determinations. The data shows that during the first 3 h following adenine propenal treatment M1dG levels declined by approximately 21%, whereas a 73% decline was observed between the 3 and 24 h time points. However, only half of the loss of M1dG was accounted for by the formation of 6-oxo-M1dG.
6-Oxo-M1dG in RAW264.7 Macrophages
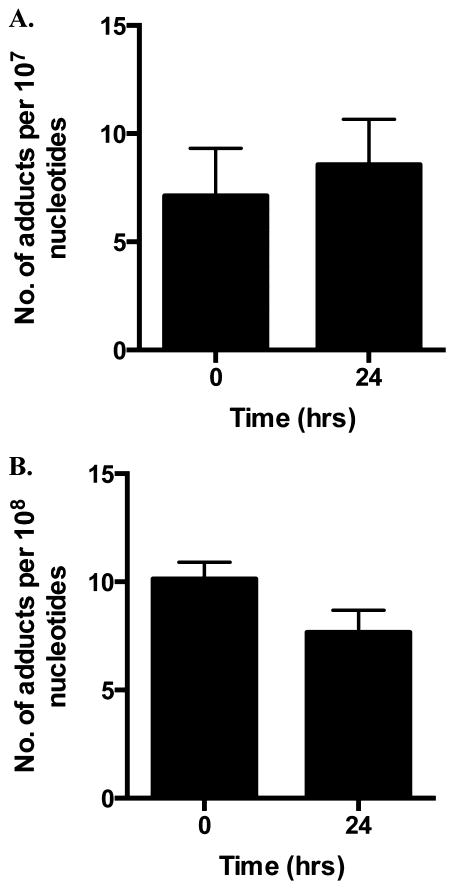
In the investigations discussed above, M1dG and 6-oxo-M1dG were measured in genomic DNA following treatment with adenine propenal. To determine the levels of these adducts in an endogenous setting, DNA from RAW264.7 macrophages was isolated and analyzed. The RAW264.7 macrophage cell line is a well-studied system for investigating inflammation and associated metabolic processes.28–30 We found that the basal levels of M1dG in the nuclear DNA of RAW264.7 macrophages (~1 adduct per 106 nucleotides) were higher by almost 2 orders of magnitude than those seen in the RKO, HEK, or HepG2 cells (Figure 9A). Indeed, nuclear M1dG levels in untreated RAW264.7 cells approached those reached following adenine propenal treatment of the other cell lines. Interestingly, 6-oxo-M1dG (1 adduct per 107 nucleotides) was readily detected in RAW264.7 cell nuclear DNA, whereas it was not detected in the other cell lines in the absence of adenine propenal treatment (Figure 9B).
Figure 9.
Endogenous M1dG and 6-oxo-M1dG levels in synchronized RAW264.7 macrophages measured after culture for the indicated times without adenine propenal treatment. Data indicate levels of M1dG (A) and 6-oxo-M1dG (B) in the nucleus. Levels of M1dG and 6-oxo-M1dG remained constant and did not change over the 24 h incubation. Data represent the mean ± SD of triplicate determinations.
DISCUSSION
Improving our understanding of the metabolism of DNA adducts resulting from lipid and/or DNA peroxidation is critical, as these adducts can lead to increased susceptibility to cancer initiation and progression. One such adduct is M1dG. An endogenous lesion detectable in the genomic DNA of humans and rodents, M1dG is associated with a variety of disease states.18–20,31–33 M1dG is repaired by NER, and the free nucleotide is oxidized to 6-oxo-M1dG by cytosolic xanthine oxidase and aldehyde oxidase.23,34 The discovery of the oxidative metabolism of M1dG inspired this study in which we have investigated the oxidation of M1dG in genomic DNA.
As an initial foray into the oxidation of M1dG in genomic DNA, in vitro experiments were conducted using oligonucleotides incubated with RKO nuclear extracts. M1dG formation was induced in the oligonucleotides by treatment with adenine propenal, the most reactive base propenal. The data demonstrate that, indeed, M1dG in an oligonucleotide is oxidized enzymatically in RKO nuclear extracts. Moreover, oxidation is not inhibited by allopurinol, an inhibitor of xanthine oxidase, contrasting with results observed at the mononucleoside level. More importantly, the fact that almost all activity was removed by heat denaturation denotes that the oxidation is enzyme-catalyzed. This was an important result, as it provided the foundation to explore the oxidation of M1dG in the genomic DNA of intact cells. In these experiments, RKO, HEK293, and HepG2 cells were treated with adenine propenal in order to increase the basal levels of M1dG and to investigate its oxidation to 6-oxo-M1dG. Our results show, for the first time, that M1dG is oxidized to 6-oxo-M1dG in the genomic DNA of intact cells.
In these investigations, the cells were synchronized by serum starvation in order to ensure no incorporation of 6-oxo-M1dG from nucleoside pools. This experimental design established a mechanism to monitor the disappearance of M1dG and formation of 6-oxo-M1dG. M1dG is believed to be removed from DNA by NER because it is more mutagenic in NER-deficient than wild-type cells24,35 and because propanodeoxyguanosine (PdG), a structural analogue of M1dG, is repaired by NER complexes both in vitro and in vivo.36 Consequently, these experiments allow for a quantitative measure of the removal of M1dG by NER and its oxidation to 6-oxo-M1dG. During the first 3 h following adenine propenal treatment, no 6-oxo-M1dG was detected; however, a decline of 10% (RKO cells) and 20% (HEK 293 cells) in the level of M1dG was observed. It is possible that this quantity of adduct was repaired by NER or, alternatively, that any 6-oxo-M1dG formed during this time period was below the limits of detection of the assay. The data also show that for both RKO and HEK293 cells the decline in M1dG (approximately 73%) between 3 and 24 h was accounted for by an almost equivalent increase (approximately 80%) in the amount of 6-oxo-M1dG for that same time period. In HepG2 cells, there was a 21% decline in the level of M1dG during the first 3 h following adenine propenal treatment. However, between 3 and 24 h, only half of the decline of M1dG was accounted for by the formation of 6-oxo-M1dG, suggesting that, in HepG2 cells, NER-dependent removal of M1dG might be relatively more important than oxidation. It should also be noted that treatment of HepG2 cells with adenine propenal resulted in a greater amount of M1dG compared to that in the other two cell lines.
As a complement to the treatment of cells with adenine propenal, endogenous levels of M1dG and 6-oxo-M1dG were investigated in RAW264.7 macrophages, a well-studied system for investigating inflammatory signaling and oxidative stress.28–30 It is important to note that M1dG levels were not high basally in any of the other cell lines and that 6-oxo-M1dG could not be measured in the absence of adenine propenal treatment. Since the RAW264.7 macrophages are naturally exposed to higher levels of ROS, we hypothesized that they would possess higher M1dG basal levels and, more importantly, 6-oxo-M1dG. In support of this hypothesis, M1dG levels in the nucleus of RAW264.7 cells were found to be higher basally than those in RKO, HEK293, or HepG2 cells exposed to adenine propenal. The most interesting result in the RAW264.7 macrophages was that M1dG was oxidized to 6-oxo-M1dG endogenously in the nucleus. This is an important finding, as it means that exogenous adenine propenal was not required in the RAW264.7 macrophages to generate high levels of M1dG and that lower levels of genomic M1dG were susceptible to oxidation.
The studies described in this article demonstrate, for the first time, the oxidation of M1dG to 6-oxo-M1dG in genomic DNA. Our laboratory has shown that 6-oxo-M1dG is produced endogenously in rodents and is excreted in the urine and feces.37 In that study, it was assumed that the excreted 6-oxo-M1dG was derived exclusively from oxidation of the free M1dG nucleoside following NER. However, the present data suggest another possibility, namely, that excreted 6-oxo-M1dG is formed in DNA and subsequently repaired to yield the adduct. There is precedent for the oxidation of M1dG in DNA. A recent report showed that the DNA repair enzyme AlkB, an α-ketoglutarate/Fe(II)-dependent dioxygenase, was capable of oxidizing M1dG in DNA in vitro to a series of hydroxylated derivatives, ultimately leading to deoxyguanosine.38 However, 6-oxo-M1dG was not among the profile of products, and none of the hydroxylated derivatives identified in that study was observed in the investigations conducted here. Thus, 6-oxo-M1dG formation likely occurs through the action of a different enzyme and/or mechanism.
The possibility exists that formation of 6-oxo-M1dG plays an important role in the deleterious consequences on cellular health attributed to M1dG. The previously observed in vivo mutagenic impact of M1dG may actually be due to 6-oxo-M1dG, as data shown in this study indicate that M1dG is oxidized at a faster rate than its removal by NER. Alternatively, 6-oxo-M1dG might be a detoxication product of M1dG. Consequently, it is evident that to completely appreciate the mutagenic impact of M1dG it is first important to understand the implications of its conversion to 6-oxo-M1dG as well as its subcellular levels.
Supplementary Material
Acknowledgments
Funding
This work was supported by a research grant from the National Institutes of Health, R37 CA0878819 (L.J.M.).
The authors are grateful to Carol Rouzer for critical reading and editing of this manuscript.
ABBREVIATIONS
- M1dG
3-(2-deoxy-β-D-erythro-pentofuranosyl)pyrimido[1,2-α]purin-10(3H)-one
- 6-oxo-M1dG
3-(2-deoxy-β-D-erythro-pentofuranosyl) pyrimido[1,2-f ]purine-6,10(3H,5H)-dione
- MDA
malondialdehyde
- LC-MS/MS
liquid chromatography-tandem mass spectrometry
- SRM
selected reaction monitoring
- NER
nucleotide excision repair
- ROS
reactive oxygen species
- HEK293
human embryonic kidney cells
- HepG2
human liver carcinoma cells
- RAW 264.7 cells
mouse macrophage cells
- RKO cells
human colon cancer cells
Footnotes
Notes
The authors declare no competing financial interest.
The Supporting Information is available free of charge on the ACS Publications website at DOI: 10.1021/acs.chemrestox. 5b00340.
- Representative LC-MS/MS chromatograms of [13C,15N]-M1dG and [15N5]-6-oxo-M1dG internal standards and representative collision-induced dissociation (CID) fragmentation spectra of M1dG and 6-oxo-M1dG observed from a cellular sample (PDF)
References
- 1.Coussens LM, Werb Z. Inflammation and cancer. Nature. 2002;420:860–867. doi: 10.1038/nature01322. [DOI] [PMC free article] [PubMed] [Google Scholar]
- 2.Elinav E, Nowarski R, Thaiss CA, Hu B, Jin C, Flavell RA. Inflammation-induced cancer: crosstalk between tumours, immune cells and microorganisms. Nat Rev Cancer. 2013;13:759–771. doi: 10.1038/nrc3611. [DOI] [PubMed] [Google Scholar]
- 3.Karin M. NF-kappaB as a critical link between inflammation and cancer. Cold Spring Harbor Perspect Biol. 2009;1:a000141. doi: 10.1101/cshperspect.a000141. [DOI] [PMC free article] [PubMed] [Google Scholar]
- 4.Taghizadeh K, McFaline JL, Pang B, Sullivan M, Dong M, Plummer E, Dedon PC. Quantification of DNA damage products resulting from deamination, oxidation and reaction with products of lipid peroxidation by liquid chromatography isotope dilution tandem mass spectrometry. Nat Protoc. 2008;3:1287–1298. doi: 10.1038/nprot.2008.119. [DOI] [PMC free article] [PubMed] [Google Scholar]
- 5.Marnett LJ. Oxyradicals and DNA damage. Carcinogenesis. 2000;21:361–370. doi: 10.1093/carcin/21.3.361. [DOI] [PubMed] [Google Scholar]
- 6.Bigey P, Pratviel G, Meunier B. Cleavage of double-stranded DNA by ‘metalloporphyrin-linker-oligonucleotide’ molecules: influence of the linker. Nucleic Acids Res. 1995;23:3894–3900. doi: 10.1093/nar/23.19.3894. [DOI] [PMC free article] [PubMed] [Google Scholar]
- 7.Johnson F, Pillai KM, Grollman AP, Tseng L, Takeshita M. Synthesis and biological activity of a new class of cytotoxic agents: N-(3-oxoprop-1-enyl)-substituted pyrimidines and purines. J Med Chem. 1984;27:954–958. doi: 10.1021/jm00374a004. [DOI] [PubMed] [Google Scholar]
- 8.Plastaras JP, Riggins JN, Otteneder M, Marnett LJ. Reactivity and mutagenicity of endogenous DNA oxopropenylating agents: base propenals, malondialdehyde, and N(epsilon)-oxopropenyllysine. Chem Res Toxicol. 2000;13:1235–1242. doi: 10.1021/tx0001631. [DOI] [PubMed] [Google Scholar]
- 9.Mukai FH, Goldstein BD. Mutagenicity of malonaldehyde, a decomposition product of peroxidized polyunsaturated fatty acids. Science. 1976;191:868–869. doi: 10.1126/science.766187. [DOI] [PubMed] [Google Scholar]
- 10.Plastaras JP, Dedon PC, Marnett LJ. Effects of DNA structure on oxopropenylation by the endogenous mutagens malondialdehyde and base propenal. Biochemistry. 2002;41:5033–5042. doi: 10.1021/bi0113059. [DOI] [PubMed] [Google Scholar]
- 11.Grollman AP, Takeshita M, Pillai KM, Johnson F. Origin and cytotoxic properties of base propenals derived from DNA. Cancer Res. 1985;45:1127–1131. [PubMed] [Google Scholar]
- 12.Marnett LJ. Lipid peroxidation-DNA damage by malondialdehyde. Mutat Res, Fundam Mol Mech Mutagen. 1999;424:83–95. doi: 10.1016/s0027-5107(99)00010-x. [DOI] [PubMed] [Google Scholar]
- 13.Basu AK, O’Hara SM, Valladier P, Stone K, Mols O, Marnett LJ. Identification of adducts formed by reaction of guanine nucleosides with malondialdehyde and structurally related aldehydes. Chem Res Toxicol. 1988;1:53–59. doi: 10.1021/tx00001a010. [DOI] [PubMed] [Google Scholar]
- 14.Dedon PC, Plastaras JP, Rouzer CA, Marnett LJ. Indirect mutagenesis by oxidative DNA damage: formation of the pyrimidopurinone adduct of deoxyguanosine by base propenal. Proc Natl Acad Sci U S A. 1998;95:11113–11116. doi: 10.1073/pnas.95.19.11113. [DOI] [PMC free article] [PubMed] [Google Scholar]
- 15.Zhou X, Taghizadeh K, Dedon PC. Chemical and biological evidence for base propenals as the major source of the endogenous M1dG adduct in cellular DNA. J Biol Chem. 2005;280:25377–25382. doi: 10.1074/jbc.M503079200. [DOI] [PubMed] [Google Scholar]
- 16.VanderVeen LA, Hashim MF, Shyr Y, Marnett LJ. Induction of frameshift and base pair substitution mutations by the major DNA adduct of the endogenous carcinogen malondialdehyde. Proc Natl Acad Sci U S A. 2003;100:14247–14252. doi: 10.1073/pnas.2332176100. [DOI] [PMC free article] [PubMed] [Google Scholar]
- 17.Fink SP, Reddy GR, Marnett LJ. Mutagenicity in Escherichia coli of the major DNA adduct derived from the endogenous mutagen malondialdehyde. Proc Natl Acad Sci U S A. 1997;94:8652–8657. doi: 10.1073/pnas.94.16.8652. [DOI] [PMC free article] [PubMed] [Google Scholar]
- 18.Ma B, Villalta PW, Balbo S, Stepanov I. Analysis of a malondialdehyde-deoxyguanosine adduct in human leukocyte DNA by liquid chromatography nanoelectrospray-high-resolution tandem mass spectrometry. Chem Res Toxicol. 2014;27:1829–1836. doi: 10.1021/tx5002699. [DOI] [PMC free article] [PubMed] [Google Scholar]
- 19.Jeong YC, Walker NJ, Burgin DE, Kissling G, Gupta M, Kupper L, Birnbaum LS, Swenberg JA. Accumulation of M1dG DNA adducts after chronic exposure to PCBs, but not from acute exposure to polychlorinated aromatic hydrocarbons. Free Radical Biol Med. 2008;45:585–591. doi: 10.1016/j.freeradbiomed.2008.04.043. [DOI] [PMC free article] [PubMed] [Google Scholar]
- 20.Singh R, Leuratti C, Josyula S, Sipowicz MA, Diwan BA, Kasprzak KS, Schut HA, Marnett LJ, Anderson LM, Shuker DE. Lobe-specific increases in malondialdehyde DNA adduct formation in the livers of mice following infection with Helicobacter hepaticus. Carcinogenesis. 2001;22:1281–1287. doi: 10.1093/carcin/22.8.1281. [DOI] [PubMed] [Google Scholar]
- 21.Leuratti C, Singh R, Lagneau C, Farmer PB, Plastaras JP, Marnett LJ, Shuker DE. Determination of malondialdehyde-induced DNA damage in human tissues using an immunoslot blot assay. Carcinogenesis. 1998;19:1919–1924. doi: 10.1093/carcin/19.11.1919. [DOI] [PubMed] [Google Scholar]
- 22.Wang M, Dhingra K, Hittelman WN, Liehr JG, de Andrade M, Li D. Lipid peroxidation-induced putative malondialdehyde-DNA adducts in human breast tissues. Cancer Epidemiol Biomarkers Prev. 1996;5:705–710. [PubMed] [Google Scholar]
- 23.Otteneder MB, Knutson CG, Daniels JS, Hashim M, Crews BC, Remmel RP, Wang H, Rizzo C, Marnett LJ. In vivo oxidative metabolism of a major peroxidation-derived DNA adduct, M1dG. Proc Natl Acad Sci U S A. 2006;103:6665–6669. doi: 10.1073/pnas.0602017103. [DOI] [PMC free article] [PubMed] [Google Scholar]
- 24.Hashim MF, Riggins JN, Schnetz-Boutaud N, Voehler M, Stone MP, Marnett LJ. In vitro bypass of malondialdehyde-deoxyguanosine adducts: differential base selection during extension by the Klenow fragment of DNA polymerase I is the critical determinant of replication outcome. Biochemistry. 2004;43:11828–11835. doi: 10.1021/bi049360f. [DOI] [PubMed] [Google Scholar]
- 25.Rosner M, Schipany K, Hengstschlager M. Merging high-quality biochemical fractionation with a refined flow cytometry approach to monitor nucleocytoplasmic protein expression throughout the unperturbed mammalian cell cycle. Nat Protoc. 2013;8:602–626. doi: 10.1038/nprot.2013.011. [DOI] [PubMed] [Google Scholar]
- 26.Rosner M, Hengstschlager M. mTOR protein localization is cell cycle-regulated. Cell Cycle. 2011;10:3608–3610. doi: 10.4161/cc.10.20.17855. [DOI] [PubMed] [Google Scholar]
- 27.Campisi J, Morreo G, Pardee AB. Kinetics of G1 transit following brief starvation for serum factors. Exp Cell Res. 1984;152:459–466. doi: 10.1016/0014-4827(84)90647-5. [DOI] [PubMed] [Google Scholar]
- 28.Dennis EA, Deems RA, Harkewicz R, Quehenberger O, Brown HA, Milne SB, Myers DS, Glass CK, Hardiman G, Reichart D, Merrill AH, Jr, Sullards MC, Wang E, Murphy RC, Raetz CR, Garrett TA, Guan Z, Ryan AC, Russell DW, McDonald JG, Thompson BM, Shaw WA, Sud M, Zhao Y, Gupta S, Maurya MR, Fahy E, Subramaniam S. A mouse macrophage lipidome. J Biol Chem. 2010;285:39976–39985. doi: 10.1074/jbc.M110.182915. [DOI] [PMC free article] [PubMed] [Google Scholar]
- 29.Raschke WC, Baird S, Ralph P, Nakoinz I. Functional macrophage cell lines transformed by Abelson leukemia virus. Cell. 1978;15:261–267. doi: 10.1016/0092-8674(78)90101-0. [DOI] [PubMed] [Google Scholar]
- 30.Jiang W, Reich CF, III, Pisetsky DS. Mechanisms of activation of the RAW264.7 macrophage cell line by transfected mammalian DNA. Cell Immunol. 2004;229:31–40. doi: 10.1016/j.cellimm.2004.06.003. [DOI] [PubMed] [Google Scholar]
- 31.Kadlubar FF, Anderson KE, Haussermann S, Lang NP, Barone GW, Thompson PA, MacLeod SL, Chou MW, Mikhailova M, Plastaras J, Marnett LJ, Nair J, Velic I, Bartsch H. Comparison of DNA adduct levels associated with oxidative stress in human pancreas. Mutat Res, Fundam Mol Mech Mutagen. 1998;405:125–133. doi: 10.1016/s0027-5107(98)00129-8. [DOI] [PubMed] [Google Scholar]
- 32.Chaudhary AK, Nokubo M, Reddy GR, Yeola SN, Morrow JD, Blair IA, Marnett LJ. Detection of endogenous malondialdehyde-deoxyguanosine adducts in human liver. Science. 1994;265:1580–1582. doi: 10.1126/science.8079172. [DOI] [PubMed] [Google Scholar]
- 33.Rouzer CA, Chaudhary AK, Nokubo M, Ferguson DM, Reddy GR, Blair IA, Marnett LJ. Analysis of the malondialdehyde-2′-deoxyguanosine adduct pyrimidopurinone in human leukocyte DNA by gas chromatography/electron capture/negative chemical ionization/mass spectrometry. Chem Res Toxicol. 1997;10:181–188. doi: 10.1021/tx9601216. [DOI] [PubMed] [Google Scholar]
- 34.Knutson CG, Wang H, Rizzo CJ, Marnett LJ. Metabolism and elimination of the endogenous DNA adduct, 3-(2-deoxy-beta-D-erythropentofuranosyl)-pyrimido[1,2-alpha]purine-10(3H)-one, in the rat. J Biol Chem. 2007;282:36257–36264. doi: 10.1074/jbc.M706814200. [DOI] [PubMed] [Google Scholar]
- 35.Dedon PC, Plastaras JP, Rouzer CA, Marnett LJ. Indirect mutagenesis by oxidative DNA damage: formation of the pyrimidopurinone adduct of deoxyguanosine by base propenal. Proc Natl Acad Sci U S A. 1998;95:11113–11116. doi: 10.1073/pnas.95.19.11113. [DOI] [PMC free article] [PubMed] [Google Scholar]
- 36.Johnson KA, Fink SP, Marnett LJ. Repair of propanodeoxyguanosine by nucleotide excision repair in vivo and in vitro. J Biol Chem. 1997;272:11434–11438. doi: 10.1074/jbc.272.17.11434. [DOI] [PubMed] [Google Scholar]
- 37.Akingbade D, Kingsley PJ, Shuck SC, Cooper T, Carnahan R, Szekely J, Marnett LJ. Selection of monoclonal antibodies against 6-oxo-M(1)dG and their use in an LC-MS/MS assay for the presence of 6-oxo-M(1)dG in vivo. Chem Res Toxicol. 2012;25:454–461. doi: 10.1021/tx200494h. [DOI] [PMC free article] [PubMed] [Google Scholar]
- 38.Singh V, Fedeles BI, Li D, Delaney JC, Kozekov ID, Kozekova A, Marnett LJ, Rizzo CJ, Essigmann JM. Mechanism of repair of acrolein- and malondialdehyde-derived exocyclic guanine adducts by the alpha-ketoglutarate/Fe(II) dioxygenase AlkB. Chem Res Toxicol. 2014;27:1619–1631. doi: 10.1021/tx5002817. [DOI] [PMC free article] [PubMed] [Google Scholar]
Associated Data
This section collects any data citations, data availability statements, or supplementary materials included in this article.


