Abstract
This paper presents the evaluation of novel electrodes for surface electromyography (sEMG) measurements. The electrodes are based on the mixture of carbon powder, quaternary salt, and viscoelastic polymeric adhesive (carbon/salt/adhesive or simply CSA), which when combined, provide the unique advantages of having longer (theoretically infinite) shelf life and potentially lower cost than Ag/AgCl hydrogel electrodes, consistent with FLEXcon’s Patent #8 673 184. The 20 subjects were recruited to collect simultaneous recordings of sEMG signals using Ag/AgCl and CSA electrodes, side-by-side on triceps brachii, tibial anterior muscles, biceps brachii, and quadriceps femoris. Although CSA sEMG electrodes showed higher electrode-skin contact impedance for the frequency range of 4 Hz–2 kHz, no significant differences were found in the signals’ amplitude between the two electrodes either during relaxation or contraction stages. Furthermore, correlations of the computed linear envelopes (>0.91), rms value envelopes (>0.91), and power spectral densities (>0.95) of the signals were found to be high between the two media. Detected ON- and OFF-times of contraction were also highly correlated (>0.9) and interchangeable (ON-time: bias = −0.02, variance = 0.11; OFF-time: bias = −0.04, variance = 0.23) between the two media. However, CSA sEMG electrodes exhibited a significantly better response to noise (38.3 ± 10.6 dB versus 32.7 ± 15.6 dB) and motion artifacts (24.1 ± 12.1 dB versus 16.6 ± 8.52 dB), and a significantly lower spectral deformation (1.32 ± 0.2 versus 1.46 ± 0.4). Ag/AgCl electrodes showed a significantly more peaked and sensitive response to EMG amplitude (67.9 ± 13.9 dB versus 65.4 ± 14.6 dB). Given no significant differences in many of the measures described earlier and the fact that CSA electrodes have an infinite shelf-life are potentially lower cost, and are more resistant to motion artifacts, the new electrodes provide an attractive alternative to Ag/AgCl electrodes for sEMG measurements.
Keywords: Carbon/salt/adhesive electrodes, dry electrodes, Ag/AgCl hydrogel electrodes, surface electromyography
We developed and tested new EMG electrodes that do not require hydrogel. The electrode is composed of carbon/salt/adhesive (CSA). We compared the performance of CSA to the standard Ag/AgCl electrodes subjected to various muscle contractions and relaxation movements. We found no significant differences in the signals' amplitude, activation times and dynamics between two media during all muscle movements. Moreover, the CSA electrodes were found to be more resistant to noise and motion artifact contamination, and with lower spectral distortion than Ag/AgCl electrodes. CSA electrodes are potentially a suitable surrogate for Ag/AgCl electrodes for EMG with the added benefits of an infinite shelf-life and potentially lower cost.
I. Introduction
Orthophedics, rehabilitation, sports medicine, stress assessment and neurology are some of the many fields where electromyography (EMG) measurements are employed. EMG aims to measure muscle activity by assessing the electrical activity elicited during muscle contraction. EMG measurements can be acquired directly on the muscle fibers through needle electrodes, but most EMG signals are collected by the use of superficial electrodes applied on the skin, corresponding to the part of the muscle that is of interest. This type of EMG measure is normally called surface electromyography (sEMG).
The current industry gold standard for sEMG is the Silver/Silver Chloride (Ag/AgCl) wet (hydrogel) electrode. These electrodes consist of a layer of silver chloride, often in the form of a paste-like hydrogel surrounding a silver disc. While the hydrogel layer significantly improves the signal quality by effectively lowering the impedance that exists at the electrode-skin interface, it also degrades with time as it dehydrates, producing high impedance. This leads to a loss of signal quality [1] and an increased incidence of motion artifacts and noise. Ag/AgCl electrodes have a number of other disadvantages: they need to be carefully packaged to ensure prolonged retention of the hydrogel layer; they are limited to short-term use because they are known to cause irritation to the skin with prolonged use, especially after their removal [2]; they are also relatively expensive since silver is an expensive commodity.
FLEXcon has developed a novel electrode that does not require a hydrogel layer, to address the issue of dehydration with most of the current industry gold standard electrodes. The new dry electrodes are designed by combining a viscoelastic polymeric adhesive [3] with carbon black powder and a quaternary salt. This mixture is potentially much more economical than Ag/AgCl. We recently demonstrated and detailed the fabrication process of our new Carbon/Salt/Adhesive (CSA) electrodes and compared their performance to the standard Ag/AgCl electrodes’ when acquiring electrocardiographic morphologies [4].
The purpose of this study was to assess the surface electromyography (sEMG) measuring capabilities of the newly-developed CSA electrodes compared to traditional Ag/AgCl electrodes. First, a brief description of the fabrication of the CSA sEMG electrodes is provided. Then the experimental protocol is explained. The experimental protocol, which covered measurements on muscles of various sizes, was meant to compare the impedance of CSA and Ag/AgCl EMG electrodes, evaluate how well the CSA electrodes can replicate Ag/AgCl electrodes for the task of sEMG signal collection, and evaluate the quality of sEMG signals obtained using each media. Measures related to sEMG signals, like “linear envelope” estimation, RMS value, on and off contraction times, and power spectral density were used to evaluate the interchangeability of EMG signals acquired with CSA and Ag/AgCl electrodes. Quality assessment, noise power, motion-artifact corruption, sensitivity to EMG activity and distortion were evaluated using previously-reported and validated indices.
II. Methods and Procedures
A. CSA Electrode Fabrication
To create the testable CSA sEMG electrodes, the conductive base layer, the adhesive, and the bridge were prepared beforehand. Details about preparation of those components are provided below. After that, a description of the CSA electrode assembly process is included.
1). Conductive Base Layer
A polyethylene foam carrier is coated with an electrically conductive material consisting of a polymeric binder loaded with conductive fillers. The conductive coating consists of 50% polymeric binder and 50% conductive filler based on the total solids weight of the mixture. The wet coating is prepared by weighing out the desired amounts of each component and smoothly blending them together for about 10 minutes until a uniform appearance is obtained. The wet mixture is then coated onto the carrier using a #60 Mayer rod, and then placed into a 71.1 °C oven for 10 minutes to dry. The electrical conductivity of the dried coating is easily checked by measuring its surface resistance to confirm that approximately 150 Ohms per square area has been achieved.
2). Adhesive
A releasable carrier is coated with a doped adhesive such as an acrylic pressure sensitive type loaded with conductive carbon filler & a quaternary ammonium salt. The wet adhesive mixture is prepared by weighing out the desired amounts of each component and smoothly blending together for about 10 minutes until a uniform appearance is obtained. The resulting wet mixture is then coated onto a release liner using a # 18 gap drawdown blade and then placed into a 71.1 °C air flow oven for 10 minutes to dry. The dried adhesive is covered with a second liner to facilitate easy handling.
3). Bridge
A releasable carrier is coated with an electrically-conductive material such as a polymeric binder loaded with conductive fillers. The conductive coating consists of 50% polymeric binder and 50% conductive filler based on the total solids weight of the mixture. The wet coating mixture is prepared by weighing out the desired amounts of each component and smoothly blending together for about 10 minutes until a uniform appearance is obtained. The wet mixture is then coated onto the carrier using a #60 Mayer rod, and then placed into a 71.1 °C oven for 10 minutes to dry. The electrical conductivity of the dried coating is easily checked by measuring surface resistance to confirm that approximately 150 Ohms per square area has been achieved. Discs of the conductive bridge (3/ diameter) coating/carrier are cut out using a die punch.
4). Electrode Assembly and Activation
A 2 mm round die is used to punch holes in the base layer material every 1-1/ . The bottom half of an electrode snap is inserted through the hole from the side with the conductive coating. The top half of the snap is assembled to the bottom half using sufficient pressure so that the snap halves are securely mated. After removing one release carrier from the adhesive, the adhesive layer is laminated to the conductive base layer so that it covers the bottom halves of the electrode snaps. The remaining release carrier is removed. The discs of conductive bridge coating/carrier are applied to the adhesive with the bridge against the adhesive so that each snap is covered by a bridge. The bridge’s release carrier is removed. The lamination is then applied to a release carrier to facilitate easy handling. The lamination is trimmed into 1-1/
 electrodes to complete the process. After the CSA electrodes are fabricated, they are activated by electrophoresis [5]. This produces multiple isolated Z direction (out of plane) conductive pathways in the adhesive. The resulting test electrodes were used for all testing described.
B. Electrode-Skin Contact Impedance Measurements
CSA-EMG electrodes were used to carry out electrode-skin impedance measurements and were compared to Ag/AgCl EMG electrodes (GS28 Solid Gel - Foam Electrode - 7/ X 1-1/
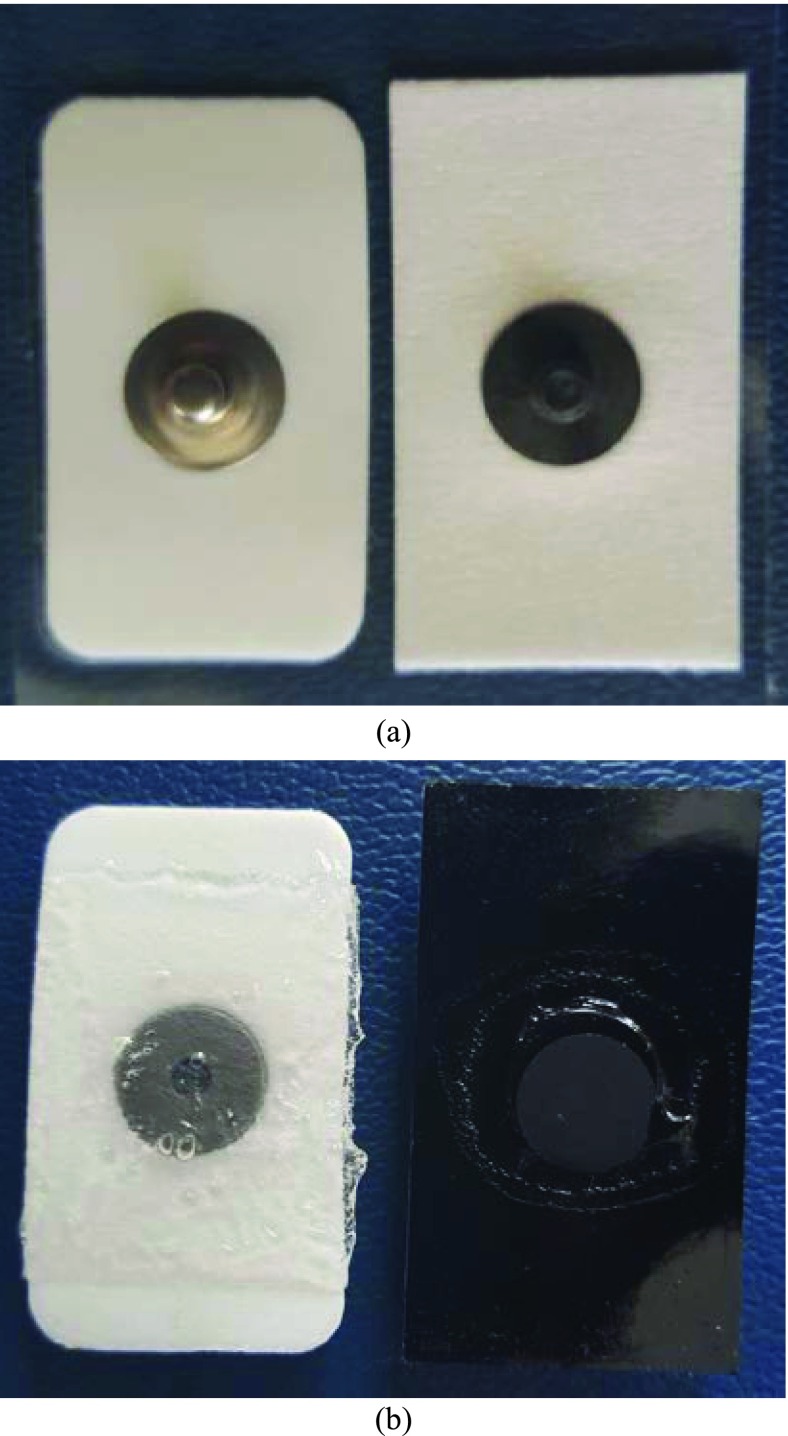
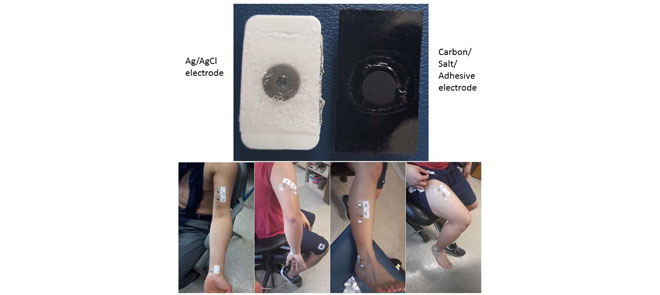
 , low impedance, disposable Ag/AgCl sensors). Fig. 1 shows the Ag/AgCl and CSA electrodes used in this study. The skin of the test subject was cleaned before each measurement by wiping with a 2%-alcohol impregnated cotton pad, which was allowed to evaporate before applying the electrodes. Two CSA electrodes were mounted on the left forearm, one on the palm side of the wrist, and the second 5 cm apart from the first but situated towards the elbow. These electrodes were connected to a Hioki IM3570 impedance analyzer, and each measurement was the result of averaging 20 measurements. The signal voltage amplitude was set to 1 V and the frequency range from 4 to 2 KHz. N = 7 pairs of CSA electrodes were used. Once the testing of CSA electrodes were completed, we performed the same experiments as described above using only one pair of Ag/AgCl electrodes. To keep skin properties as constant as possible, all measurements were performed in a single day.
FIGURE 1.
Connector and contact sides of Ag/AgCl (left) and CSA (right) sEMG electrodes. (a) Connection side; (b) Contact side.
C. Protocol
N = 20 subjects were enrolled to take part in this test. The experiments were carried out in a quiet, comfortable room (ambient temperature 26-27 °C, relative humidity between 30-50%). To ensure accurate comparison between the electrodes, simultaneous measurements were recorded. To do this, CSA and Ag/AgCl (GS28) electrodes were placed side-by-side. sEMG measurements are largely dependent on location, since proximity to the muscle has a great effect on signal strength. Hence, to eliminate any benefit from being on either side, the CSA and the Ag/AgCl electrodes were assigned a lateral position (left or right on the same muscle) that alternated from subject to subject. This should have reduced any error resulting from one of the side-by-side positions having a stronger sEMG signal than the other.
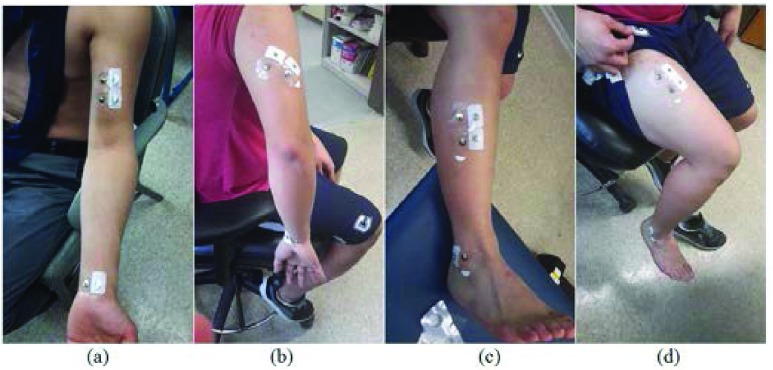
We had subjects lift a weight of 3 lb. (1.36 kg) for testing triceps brachii and tibialis anterior muscles. For biceps brachii and quadriceps femoris, they used a weight of 6 lb. (2.72 kg). These weights were chosen considering the size of the muscles and to ensure effective stress on the muscle during contraction time. Before performing every test, we made sure that the locations chosen for the electrodes were devoid of hair and had been wiped with alcohol and then allowed to dry. If the subject presented thick or abundant hair, they were provided with a disposable razor and asked to shave the hair from the site where the electrodes were placed. Fig. 2 shows the areas where the electrodes were placed, for each muscle. The electrodes were placed with the subjects in resting condition. Surface EMG measurements of the biceps brachii, triceps brachii (long head), tibialis anterior, and quadriceps femoris (rectus femoris) were recorded while subjects performed four muscle contraction maneuvers during the experiment, one for each muscle. These specific muscles were chosen based on their variance in size. It has been observed that muscles of varying sizes will produce sEMG signals of varying amplitudes.
FIGURE 2.
Sample images of where the electrodes were placed for each muscle-contraction test. Note that the electrodes presented in these images were not the ones that were used for the actual tests. (a) Biceps brachii; (b) Triceps brachii (long head); (c) Tibialis anterior; (d) Quadriceps femoris (rectus femoris).
EMG signals were acquired using a dual-channel bioelectric amplifier (Nikon Kohden) and digitized through an ADInstruments analog-to-digital converter, with a sampling frequency of 1 kHz, and we used compatible PowerLab software.
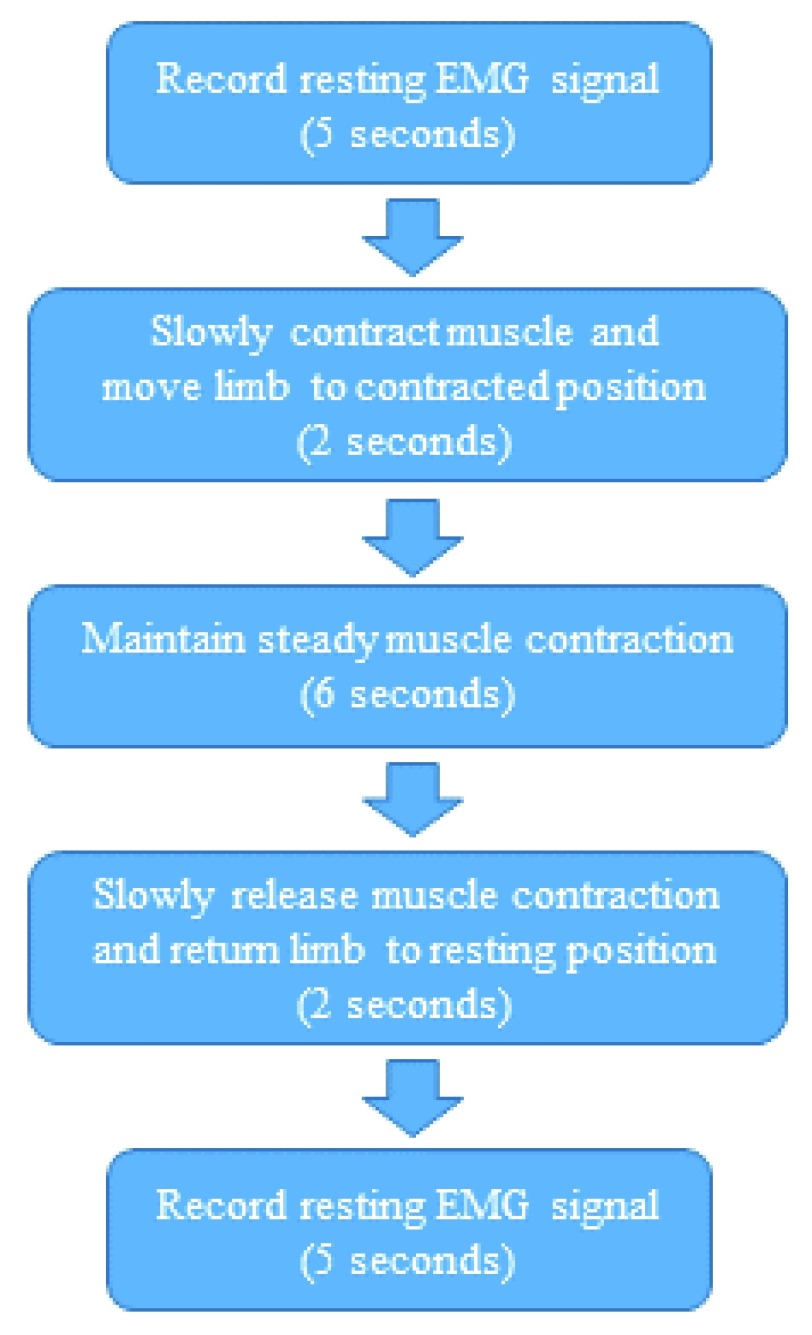
The completion order of the four maneuvers should not influence the results, so for this study they were performed in an arbitrary numerical order that we assigned. While different motions and weights were involved for each muscle, the same time limit for each maneuver was followed for EMG signal recording (Fig. 3). The contraction maneuvers were kept as clear of motion artifacts as possible by allowing the subject 2 seconds to perform the required movement. Subjects practiced the maneuvers prior to every test until they felt comfortable with the procedure. This was important given the time constraint for the movements in the tests. A visual tool with timing signals was used to guide the subjects throughout the tests.
FIGURE 3.
Time frame for movements while recording EMG signal.
Subjects were asked to perform these maneuvers: 1) to contract their biceps, bringing the elbow to a 90 degree angle, with the forearm in supination; 2) to contract their triceps and extend their elbow joint so that the weight was suspended backwards; 3) to contract their tibialis anterior muscle and lift the weight off the floor without extension of the great toe; and 4) to lift their leg up (extend their knee) to procure contraction of the quadriceps. The protocol was approved by the Institutional Review Board of the University of Connecticut.
D. Signal Processing
In the acquisition device the sEMG signals were filtered using an analog bandpass filter (5-300 Hz) and a Notch filter at 60 Hz. We also processed the signals offline to quantify their quality and to compare the performance of the CSA EMG electrodes to the Ag/AgCl EMG electrodes. Several time- and frequency-domain indices of correlation and the sEMG signals’ quality were computed. In the time domain, the linear envelope of each sEMG signal was computed using rectification and a low pass filter (7th-order Chebyshev with the cut-off frequency = 16.66 Hz), and an RMS approach was also applied. From the linear envelope, on and off contraction times were estimated.
For frequency domain analysis, the power spectral density (PSD) of each sEMG signal was calculated using Welch’s periodogram method with 50% data overlap. A Blackman window (length of 256 data points) was applied to each segment and the Fast Fourier Transform (FFT) was calculated for each windowed segment. Finally, the power spectra of the segments were averaged. An FFT segment size of 1024 data points was used. PSD correlation was computed between CSA and Ag/AgCl signals. Time- and frequency-domain correlations, along with the interchangeability of on- and off-time measures, were intended to prove whether or not CSA electrodes are able to match the functionality of Ag/AgCl electrodes in the task of sEMG signal collection.
To measure quality of the collected sEMG signals, signal-to-noise (SN) ratio (SNR), signal-to-motion (SM) ratio, the spectrum maximum-to-minimum drop in power (DP ratio) density and the power spectrum deformation ( ratio) indices were computed. All computations, including the statistical analyses of these indices, are explained below.
1). Time Domain Measures
a: Linear Envelope
sEMG signals are rectified (by taking their absolute value), low-pass filtered at 10 Hz, and down-sampled to 41.66 Hz (a rate that is closer to motion frequencies) to get a linear envelope. The resulting envelope is an estimate of the standard deviation of the sEMG signal, which is in turn a measure of the muscles’ power. The Pearson’s correlation between CSA and Ag/AgCl electrodes’ sEMG envelopes was computed, for each muscle and in the overall, to test the similarity between the two simultaneously-acquired signals. Correlation gives us an index of similarity, independent of the amplitude of the signals which were collected with the two types of electrodes side by side.
b: Amplitude
Mean value of the linear envelope was computed as an amplitude estimation of sEMG signals. This index was computed for relaxation and contraction stages, to evaluate the statistical differences in amplitude between the signals obtained using CSA and Ag/AgCl electrodes.
c: RMS Value
The sEMG signals were divided into multiple windows of 25 ms [6]. RMS values were computed from the signals before rectification since the values have both negative and positive values. As with the linear envelope, the Pearson’s correlation between CSA and Ag/AgCl electrodes’ sEMG RMS values was computed, for each muscle and in the overall.
d: on- and off-Time
Muscles’ on and off contraction times were estimated using the linear envelope of sEMG signals. On and off detection is based on determining the times at which the envelope of the signal exceeds a threshold. In this study the threshold was calculated by:
 |
Where  and
and  are the mean and standard deviation of the linear envelope during a period of inactivity, and J is a constant. J was fixed to 3 [7] and it was required that the mean of the points in a sliding window of 25 ms exceed the threshold to label a point as an on- or off-time [8]. This approach provides a suitable on- and off-time detection. Agreement between the on and off estimations using CSA and Ag/AgCl sEMG signals was evaluated using Bland and Altman analysis and the Pearson’s correlation.
2). Frequency Domain Measures
a: PSD Correlation
The raw sEMG data were used to perform frequency domain analysis. To test the similarity between CSA and Ag/AgCl sEMG signals in the frequency domain, the Pearson’s correlation coefficient of PSD representations was computed.
b: SN Ratio
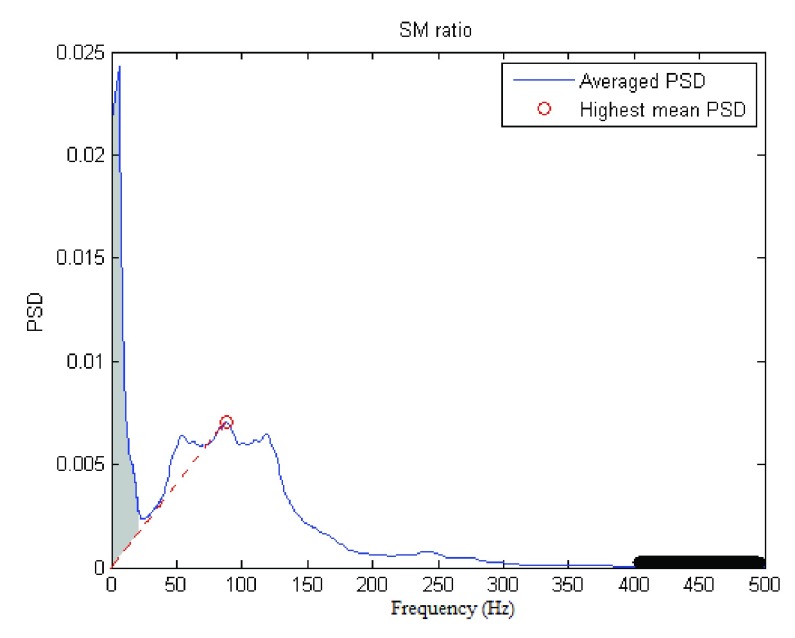
This index takes into account all kinds of noisy disturbances as well as low signal levels. In this case, noise is defined as any signal of unrecognizable source present in the high-frequency range of the PSD [9]. For the SN ratio calculation we assumed that noise had a constant power density over the frequency region of interest in sEMG recordings and that no muscular activity-related power was present above 400 Hz (upper 20% of the frequency range). So, first, the power for the frequency range above 400 Hz was calculated. The predicted total power of the noise is this power summed over the whole frequency range. The SN ratio was then calculated as the ratio of the total sEMG power to the total power of the noise.
c: SM Ratio
For this study, motion artifacts are defined as low-frequency fluctuations of the signal induced by mechanical alteration of the electrode-skin interface. Use of the SM ratio is based mainly on two assumptions: 1) the frequency of motion-induced artifacts of the signal stays well below 20 Hz, and 2) the shape of the non-contaminated sEMG power spectrum is fairly linear between 0 and 20 Hz [10]. As a consequence, the motion artifacts’ spectral power will be mixed in with the true signal dynamics at frequencies between 0 to 20 Hz. According to Sinderby et al., the motion artifacts’ power (grey area in Fig. 4) can be reasonably estimated by summing the PSD area below 20 Hz that exceeds a straight line between the origin and the highest mean power density. The highest mean power density (the red dot in the averaged spectral plot of Fig. 4) was defined as the largest mean spectral value within a window length of 12.7 Hz starting from 35 Hz to 500 Hz. Finally, the sum of the area under the PSD for all frequencies divided by motion artifact power was computed to obtain the SM ratio.
FIGURE 4.
Illustration of SM ratio and SN ratio estimation. Gray area corresponds to motion artifact. Power on the thick black line (upper 20% of the range) is considered noise.
d: DP Ratio
The spectrum maximum-to-minimum drop in power (DP ratio) was obtained by computing the quotient between the highest and lowest mean PSD values. The mean PSD is obtained by averaging a spectral window length of 12.7 Hz (13 consecutive points). The DP ratio is an indicator of whether the spectral frequency contents of interests are adequately peaked and is sensitive to the signal’s amplitude and can detect the absence of sEMG activity. DP ratio is not sensitive to power below 35 Hz (in contrast to the SN ratio) and will not provide falsely high values because of the power induced by motion artifacts. A higher DP ratio is desirable.
 Ratio: The spectral deformation is computed in terms of spectral moments, as follows:
 |
where
 |
 ratio is sensitive to changes in symmetry and peaking of the PSD and to additive disturbances in the high- and low-frequency regions [9]. This index identifies all dynamics of spectral changes except those caused by pure translations along the frequency axis. In this manner it adapts to myoelectric changes due to muscle fatigue but not to additive disturbances. The feature is also sensitive to motion artifacts, which give an excess of low-frequency power. A lower
  is desirable.
The SN, SM and DP ratios are presented in decibels, and the  ratio is unitless. These four indices obtained for CSA and Ag/AgCl electrodes were compared for each muscle and in the overall, by testing for statistically significant differences, to check whether there is an electrode media that collects the signal with lower noise power, lower motion-artifact corruption, more sensitivity to EMG activity and lower distortion, respectively. Quality indices were computed using a myoelectric signal processing toolbox developed by Chan and Green [11].
III. Results
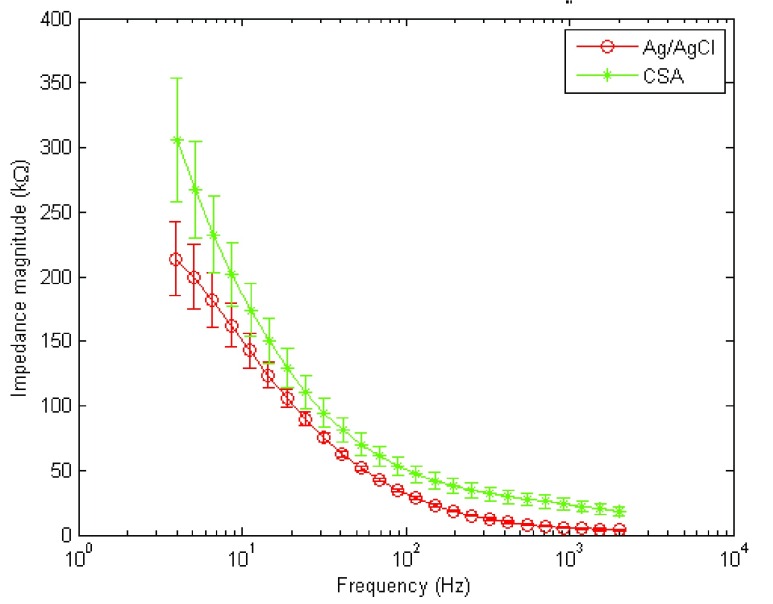
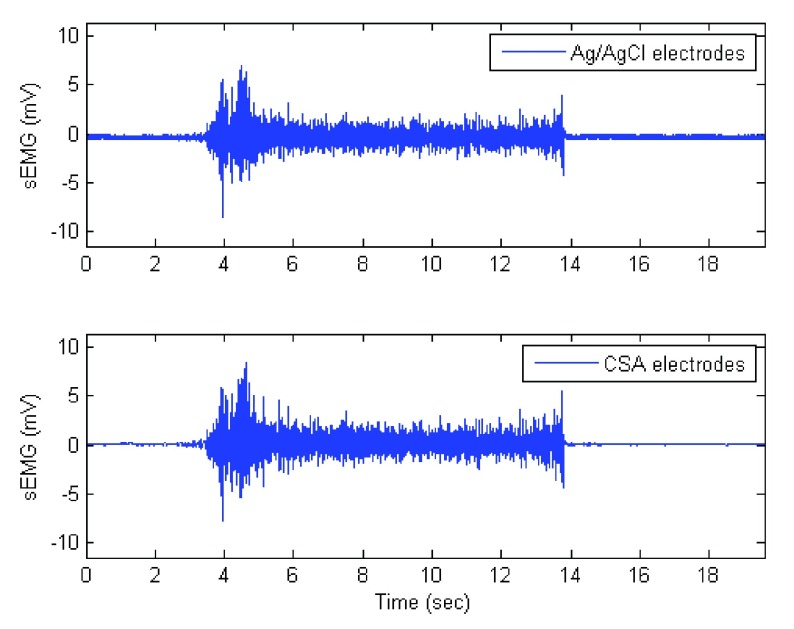
Results for electrode-skin contact measurements are presented in Fig. 5. Ag/AgCl sEMG electrodes exhibited lower impedance compared to CSA sEMG electrodes throughout the range of frequencies of interest (4 Hz to 2 kHz). Representative sEMG signals acquired with Ag/AgCl and CSA electrodes are shown in Fig. 6. It is clearly evident that on the Fig. 6 (biceps of a given subject), the CSA electrodes exhibited a lower noise level than Ag/AgCl during the relaxation phases of the signal while both types of electrodes exhibited similar signal amplitude during the contraction phase.
FIGURE 5.
Electrode-skin contact impedance measurements for CSA and Ag/AgCl electrodes.
FIGURE 6.
Sample sEMG measures using Ag/AgCl (top) and CSA electrodes (bottom).
Table 1 contains the results for our interchangeability analysis. No significant differences in amplitude were found between CSA and Ag/AgCl sEMG signals either for relaxation or for contraction stages, for any muscle or in the overall which combines all four types of muscles denoted in Table 1. The CSA electrodes exhibited lower amplitude for most of the muscles during muscle relaxation, with the exception of the Tibialis, and higher amplitude during the contraction time for all the muscles. The differences in the relaxation and contraction amplitudes are also present in the overall comparison (gathering results for all muscles together), but they are not found to be statistically significant.
TABLE 1. Results for Evaluation of Signals’ Interchangeability.
| Index | Stage | Biceps | Triceps | Tibialis | Quadriceps | Overall |
|---|---|---|---|---|---|---|
| Amplitude Ag/AgCl (V) | Relaxation | 0.16 ± 0.17 | 0.42 ± 0.27 | 0.064 ± 0.101 | 0.072 ± 0.068 | 0.18 ± 0.22 |
| Contraction | 0.99 ± 0.42 | 1.47 ± 0.53 | 0.98 ± 0.7 | 0.72 ± 0.36 | 1.04 ± 0.58 | |
| Amplitude CSA (V) | Relaxation | 0.17 ± 0.26 | 0.48 ± 0.46 | 0.06 ± 0.11 | 0.051 ± 0.041 | 0.19 ± 0.31 |
| Contraction | 0.99 ± 0.38 | 1.48 ± 0.66 | 1.01 ± 0.68 | 0.71 ± 0.31 | 1.05 ± 0.59 | |
| Contraction time correlation | on | 0.95 | 0.96 | 0.96 | 0.97 | 0.96 |
| off | 0.96 | 0.98 | 0.91 | 0.90 | 0.94 | |
| Envelope correlation | 0.91 ± 0.07 | 0.92 ± 0.038 | 0.95 ± 0.029 | 0.93 ± 0.05 | 0.93 ± 0.052 | |
| RMS correlation | 0.91 ± 0.06 | 0.91 ± 0.038 | 0.95 ± 0.029 | 0.93 ± 0.05 | 0.93 ± 0.05 | |
| PSD correlation | 0.98 ± 0.02 | 0.95 ± 0.034 | 0.95 ± 0.046 | 0.97 ± 0.04 | 0.96 ± 0.04 | |
Values are expressed as mean ± standard deviation.
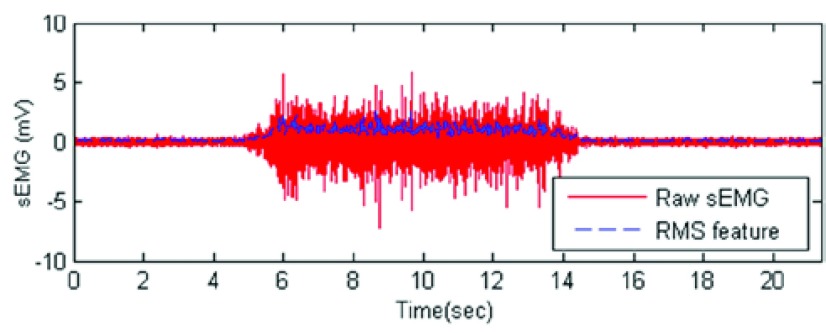
The linear envelope, the RMS value envelope, and the sEMG PSD were highly correlated. The linear envelope and RMS value envelope exhibited a correlation higher than 0.91 for all muscle. Lower correlation was found for the smaller muscles (biceps and triceps), and a stronger correlation was found for the bigger muscles (tibialis and quadriceps). The PSD of the sEMG signals achieved a correlation higher than 0.95 for all the muscles. Fig. 7 shows the RMS value envelope for a given subject.
FIGURE 7.
RMS value envelope estimation for a given signal.
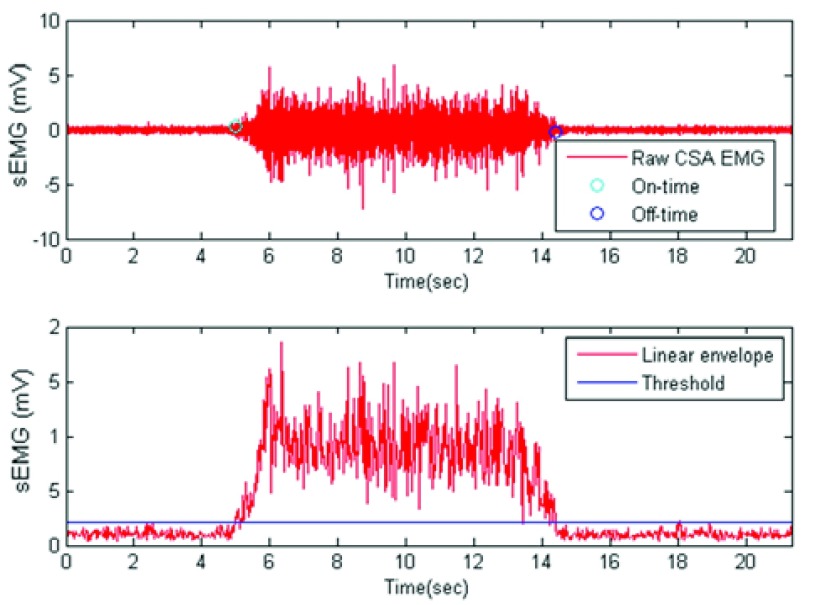
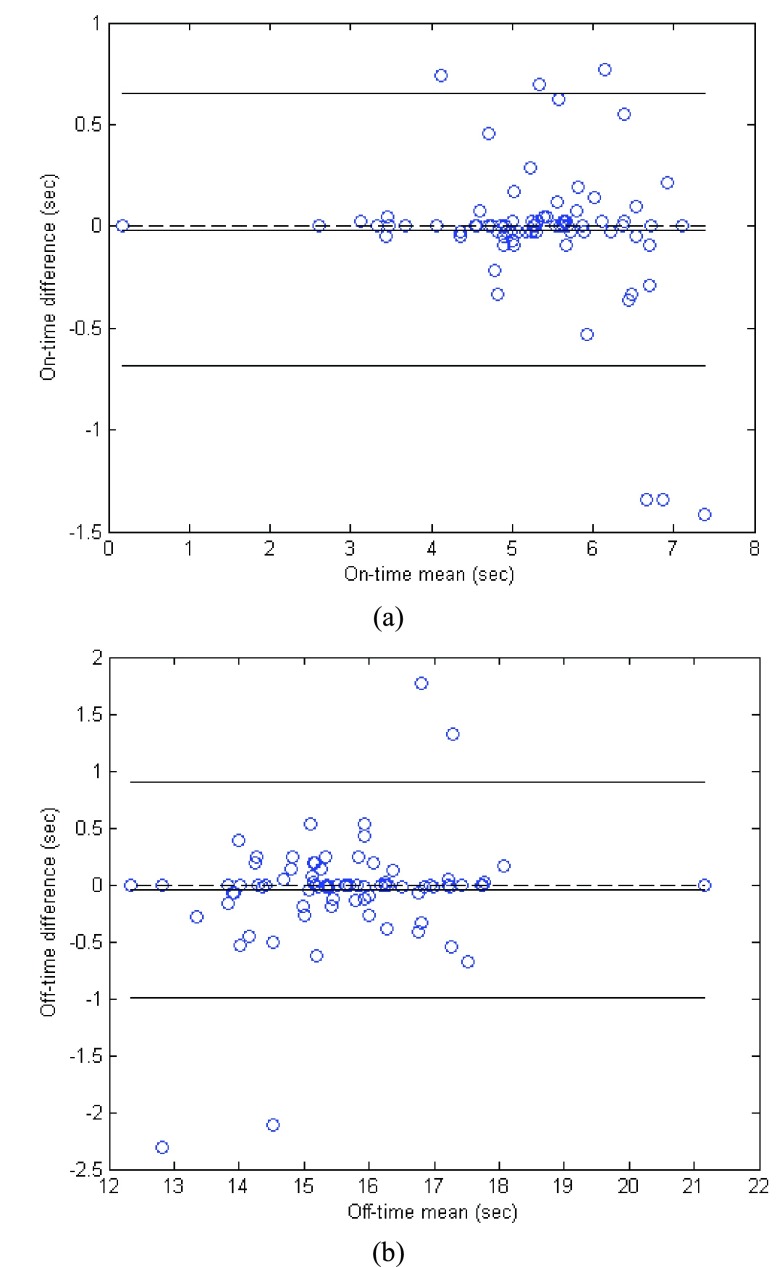
On- and off-time contraction time estimations were highly correlated between the two electrodes. Fig. 8 exemplifies the on- and off-time estimation using the linear envelope and the threshold. We did not use a single value of the sEMG but the mean value of a 25 ms window to determine if a threshold of the occurrence of the muscle contraction or relaxation had occurred. For all the muscles, the correlation of off-time detection was above 0.9. Correlation for on-time estimations was always very high (above 0.95). Notice that the threshold was computed using the same signal during the relaxation stage, i.e. for Ag/AgCl electrodes the threshold was computed using a segment of Ag/AgCl sEMG signal during the relaxation stage. The same time frame of the relaxation stage was used to compute the threshold for CSA and Ag/AgCl signals. Fig. 9 presents the Bland-Altman plot and a scatter plot of the results for on- and off-time estimation, allowing us to test the interchangeability of the signals for this purpose. Notice the small bias and variance of the error for on- and off-time estimation.
FIGURE 8.
Top: Estimated on and off contraction time for a given subject. Bottom: linear envelope and threshold used to estimate the times.
FIGURE 9.
Bland-Altman plot. (a) On-time estimation (bias = −0.005, variance = 0.1); (b) Off-time estimation (bias = −0.061, variance = 0.23).
Table 2 includes the frequency-domain indices for quality assessment of sEMG signals. The SN ratio was significantly different between the two media for biceps and quadriceps, and in the overall. CSA electrodes showed a higher SN ratio, compared to Ag/AgCl. The SM ratio was different for all the muscles, with CSA electrodes always exhibiting a better response to motion artifacts. The DP ratio was higher for Ag/AgCl electrodes only in the overall, compared to CSA electrodes. Finally, the  ratio indicates a significantly higher spectral deformation for the Ag/AgCl electrodes.
TABLE 2. Indices of sEMG Signal Quality Estimated Using Frequency Domain Measures.
| Biceps | Triceps | Tibialis | Quadriceps | Overall | ||
|---|---|---|---|---|---|---|
| SN ratio (dB) | Ag/AgCl | 41.6 ± 14.9 | 35.2 ± 9.62 | 24.4 ± 17.3 | 29.8 ± 15 | 32.7 ± 15.6 |
| CSA | 50.01 ± 5.89* | 34.93 ± 11.9 | 30.42 ± 5.44 | 37.83 ± 6.27* | 38.3 ± 10.6* | |
| SM ratio (dB) | Ag/AgCl | 15.9 ± 7.26 | 18.4 ± 7.17 | 19.3 ± 9.49 | 12.9 ± 9.08 | 16.6 ± 8.52 |
| CSA | 21.5 ± 12* | 22.6 ± 9.56* | 30.6 ± 14.5* | 21.9 ± 9.95* | 24.1 ± 12.1* | |
| DP ratio (dB) | Ag/AgCl | 82.8 ± 6.61 | 62.2 ± 11.7 | 58.9 ± 13.5 | 67.7 ± 9.26 | 67.9 ± 13.9 |
| CSA | 82.9 ± 7.79 | 60.6 ± 15.3 | 55.3 ± 9.6 | 62.8 ± 6.73 | 65.4 ± 14.6* | |
 ratio (relative units) ratio (relative units) |
Ag/AgCl | 1.48 ± 0.14 | 1.39 ± 0.27 | 1.42 ± 0.6 | 1.56 ± 0.38 | 1.46 ± 0.39 |
| CSA | 1.39 ± 0.12* | 1.31 ± 0.12 | 1.28 ± 0.31 | 1.3 ± 0.173* | 1.32 ± 0.2* |
Values are expressed as mean ± standard deviation.
p<0.05.
IV. Discussion
First, CSA and Ag/AgCl electrodes were compared by means of impedance measurements. Then, measures of similarity were deployed to evaluate whether CSA sEMG electrodes could replicate dynamics of the Ag/AgCl electrodes. Finally, both time- and frequency-domain indices of sEMG signal quality were introduced to highlight the advantages of using CSA electrodes for the task of sEMG signal collection.
Despite the higher electrode-skin contact impedance exhibited by the CSA electrodes, no significant amplitude differences were found between the signals obtained by the two media. Hence, the impact of the electrode-skin contact impedance on the collected signal amplitude was found to be negligible. Note that impedance results between Ag/AgCl and CSA electrodes are in agreement with what has been reported previously [4], [12]–[14]. Higher impedance was found for CSA electrodes in the current work than in our previous study [4], but this is because the salt concentration was substantially reduced to minimize possible skin irritation. One way to lower the impedance of CSA electrodes is to use higher salt concentrations, but this can lead to possible skin irritation as found in our previous study [4].
The analysis of interchangeability comprises amplitude comparison, linear envelope, on- and off-time estimation, RMS value envelope and PSD correlation. Differences in amplitude estimation during relaxation and contraction stages were not significant, demonstrating that CSA electrodes are at least as sensitive to collect sEMG signals as the Ag/AgCl electrodes. All the correlation values were high and the biases of the measures were low, indicating that CSA electrodes can be used as functional substitutes for Ag/AgCl electrodes for sEMG signal collection.
EMG signal waveforms are more irregular than others (e.g. ECG) and motion artifacts and noise corruption are more difficult to assess by visual inspection of the signal in time or frequency domains. Given this complication, previously-reported and validated indices for automatic evaluation of EMG signal quality were employed. With the only exception of DP ratio (which was higher for Ag/AgCl electrodes only in the overall), the quality indices SN, SM and  ratios were in favor of CSA electrodes. These indices suggest that CSA electrodes are more resistant to noise and motion artifact corruption, two highly relevant issues for sEMG signal collection. These are significant benefits of CSA electrodes considering that one of the disadvantages of past dry electrodes, compared to gel electrodes, was the lack of flexible contact provided by the gel. This rigidity produced variations in contact during motion, and tended to introduce motion artifacts to the EMG signal. However, for the CSA electrodes, the Z-direction formation of carbon columns after activation provides a better resistance to shifting against skin, as the electrodes should be less sensitive to X- and Y-direction potentials. Specifically, the main advantage of the CSA electrode is that the conductivity enhancing feature (the bridge) is a low impedance electrically conductive material that produces a lower electrode ohm value by connecting in parallel multiple isolated Z direction (out of plane) conductive pathways in the adhesive. This can be described by
 |
where R represents each isolated Z direction pathway. The bridge is specifically designed to balance electrical, mechanical and electrode adhesion properties: its conductive loading level provides electrical conductivity, its polymeric content and thinness provide mechanical flexibility, and its small area does not significantly reduce the adhesive bonding.
Finally, the lower  ratio demonstrates that CSA electrodes are more able to adapt to muscular activity changes derived from muscle fatigue but not from additive disturbances like motion artifact and noise, compared to Ag/AgCl. The higher DP ratio of Ag/AgCl electrodes suggests that the PSD of sEMG signals obtained with such electrodes are more sensitive to detecting the absence of sEMG activity.
V. Conclusion
CSA and Ag/AgCl electrodes were quantitatively compared for the task of collecting sEMG signals. It was found that our dry CSA electrodes are comparable to the gold standard Ag/AgCl electrodes in that there were no significant differences in the sEMG amplitude and activation times. Further, CSA electrodes were more resistant to noise and motion artifacts and delivered signals with lower spectral distortion, compared to Ag/AgCl. This is primarily an exciting result because of the two salient disadvantages of Ag/AgCl electrodes that are not a problem for CSA: dehydration with storage or prolonged use, and higher cost. The results of the current work indicate that CSA electrodes represent a suitable and cost-effective alternative to standard Ag/AgCl electrodes for sEMG signal collection. For point-of-care applications, CSA electrodes can be used to monitor the progression of muscular dystrophies or control muscle activities via signal processing of the electromyogram data. Certainly, with the advent of sophisticated machine learning algorithms and robotics, rehabilitation engineering of muscles and limbs will be a good opportunity for more noise-resistant and cost-effective surface EMG electrodes than the current standard hydrogel-based electrodes.
Biographies
Hugo Posada-Quintero, photograph and biography not available at the time of publication.
Ryan Rood, photograph and biography not available at the time of publication.
Ken Burnham, photograph and biography not available at the time of publication.
John Pennace, photograph and biography not available at the time of publication.
Ki Chon, photograph and biography not available at the time of publication.
Funding Statement
This work was supported by FLEXcon.
References
- [1].Searle A. and Kirkup L., “A direct comparison of wet, dry and insulating bioelectric recording electrodes,” Physiol. Meas., vol. 21, no. , pp. 271–283, May 2000. [DOI] [PubMed] [Google Scholar]
- [2].Baek J.-Y., An J.-H., Choi J.-M., Park K.-S., and Lee S.-H., “Flexible polymeric dry electrodes for the long-term monitoring of ECG,” Sens. Actuators A, Phys., vol. 143, no. 2, pp. 423–429, May 2008. [Google Scholar]
- [3].Benedek I., Pressure-Sensitive Adhesives and Applications. Boca Raton, FL, USA: CRC Press, 2004. [Google Scholar]
- [4].Posada-Quintero H. F., Reyes B. A., Burnham K., Pennace J., and Chon K. H., “Low impedance carbon adhesive electrodes with long shelf life,” Ann. Biomed. Eng., vol. 43, no. 10, pp. 2374–2382, Oct. 2015. [DOI] [PubMed] [Google Scholar]
- [5].Lerner K. L. and Lerner B. W., The Gale Encyclopedia of Science. Farmington Hills, MI, USA: Cengage Gale, 2008. [Google Scholar]
- [6].De Luca C. J., “The use of surface electromyography in biomechanics,” J. Appl. Biomech., vol. 13, no. 2, pp. 135–163, May 1997. [Google Scholar]
- [7].Di Fabio R. P., “Reliability of computerized surface electromyography for determining the onset of muscle activity,” Phys. Therapy, vol. 67, no. 1, pp. 43–48, Jan. 1987. [DOI] [PubMed] [Google Scholar]
- [8].Hodges P. W. and Bui B. H., “A comparison of computer-based methods for the determination of onset of muscle contraction using electromyography,” Electroencephalogr. Clin. Neurophysiol., vol. 101, no. 6, pp. 511–519, Dec. 1996. [DOI] [PubMed] [Google Scholar]
- [9].Arvidsson A., Grassino A., and Lindström L., “Automatic selection of uncontaminated electromyogram as applied to respiratory muscle fatigue,” J. Appl. Physiol., vol. 56, no. 3, pp. 568–575, Mar. 1984. [DOI] [PubMed] [Google Scholar]
- [10].Sinderby C., Lindström L., and Grassino A. E., “Automatic assessment of electromyogram quality,” J. Appl. Physiol., vol. 79, no. 5, pp. 1803–1815, Nov. 1995. [DOI] [PubMed] [Google Scholar]
- [11].Chan A. D. and Green G. C., “Myoelectric control development toolbox,” in Proc. 30th Conf. Can. Med. Biol. Eng. Soc., vol. 1 2007, p. M0100-1. [Google Scholar]
- [12].Gruetzmann A., Hansen S., and Müller J., “Novel dry electrodes for ECG monitoring,” Physiol. Meas., vol. 28, no. 11, pp. 1375–1390, Nov. 2007. [DOI] [PubMed] [Google Scholar]
- [13].Reyes B. A., et al. , “Novel electrodes for underwater ECG monitoring,” IEEE Trans. Biomed. Eng., vol. 61, no. 6, pp. 1863–1876, Jun. 2014. [DOI] [PubMed] [Google Scholar]
- [14].Noh Y., et al. , “Novel conductive carbon black and polydimethlysiloxane ECG electrode: A comparison with commercial electrodes in fresh, chlorinated, and salt water,” Ann. Biomed. Eng., Jan. 2016. PMID: 26769718. [DOI] [PubMed]


