Abstract
In evaluation of cell viability and apoptosis, spatial heterogeneity is quantified for cancerous cells cultured in 3-D in vitro cell-based assays under the impact of anti-cancer agents. In 48-h experiments using human colorectal cancer cell lines of HCT-116, SW-620, and SW-480, incubated cells are divided into control and drug administered groups, to be grown in matrigel and FOLFOX solution, respectively. Our 3-D cell tracking and data acquisition system guiding an inverted microscope with a digital camera is utilized to capture bright field and fluorescent images of colorectal cancer cells at multiple time points. Identifying the locations of live and dead cells in captured images, spatial point process and Voronoi tessellation methods are applied to extract morphological features of in vitro cell-based assays. For the former method, spatial heterogeneity is quantified with the second-order functions of Poisson point process, whereas the deviation in the area of Voronoi polygons is computed for the latter. With both techniques, the results indicate that the spatial heterogeneity of live cell locations increases as the viability of in in vitro cell cultures decreases. On the other hand, a decrease is observed for the heterogeneity of dead cell locations with the decrease in cell viability. This relationship between morphological features of in vitro cell-based assays and cell viability can be used for drug efficacy measurements and utilized as a biomarker for 3-D in vitro microenvironment assays.
Keywords: Cell viability, cell apoptosis, in-vitro cell based assays, morphological features, spatial analysis methods, poisson point process, spatial heterogeneity, Voronoi tessellation, colorectal cancer cell lines, FOLFOX treatment
This paper presents spatial heterogeneity analysis based on spatial point process and Voronoi tessellations for colorectal cancer cells cultured in 3D microenvironment under the influence of anti-cancer agents. Processing bright field and fluorescent images captured during multi-day experiments, spatial heterogeneity of live cell locations is observed to increase, whereas it decreases for dead cells as viability decreases in time.
I. Introduction
Cell line and tissue based in-vitro cell culture systems are tools to emulate in-vivo cell behavior and cellular interactions [1]. With 3D cell culture assays, the physiological relevance of in-vivo cell proliferation can be mimicked while preserving cell viability and pathway activity [2]. Cell viability, proliferation and morphology in 3D microenvironment depend on administered drug in addition to the cell line, matrix used to coat chamber slides and the structure of assay [3]. Viability of incubated cells under the impact of anti-cancer drugs and their morphology changes can be observed via digitized microscopic images from cell cultures captured during in-vitro experiments.
Poisson point process, a statistical tool for spatial analysis, can be applied to captured images to characterize the patterns. With distance-based techniques relying on the spacing of the points and area-based methods evaluating the intensity of observed numbers of points in predetermined subregions (e.g., quadrats [4]), the variability in the point locations can be analyzed to decide whether a complete spatial randomness, a clustering or a regularity exists [5]. A homogenous process is observed in the case of a complete spatial randomness, whereas the distribution characteristic of points deviating from a homogenous pattern is formed when an attraction or an inhibition is present among points [6]. Ripley’s K-function and its derived versions can be used to test the consistency of observed patterns with a homogeneous Poisson process [7]. Voronoi tessellation is another spatial analysis tool for partitioning an Euclidian space into subregions based on node locations, where an association of subregions of a given plane to the closest nodes results in a tessellation diagram containing information specific to a specific plane [8].
As part of our continuing research, we study growth and shrinkage behavior of tumor mass in human body and in xenograft models based on patient specific information such as gene expressions and morphological features of tumor tissue [9]–[11]. We compute tumor growth and shrinkage for breast cancer patients using their MRI images of tumor tissue and gene expression data [12]. To extract morphological features using spatial pattern analysis, we analyze the digitized images of Hematoxylin & Eosin (H&E) slide samples taken from mice models implanted with tumor specimen of kidney cancer patients. In this paper, we examine the relationship between cell viability and morphological features of 3D microenvironment using spatial analysis methods, namely poisson point process and Voronoi tessellations. As case studies, we set up in-vitro experiments using human colon carcinoma cell lines of HCT-116, SW-480 and SW-640. The cells cultured in in-vitro microenvironment were divided into control and FOLFOX-administered groups for each experiment. With our artificial intelligence based cell tracking and data acquisition system [13], the bright field and fluorescent images of predetermined locations of regions of interest (ROI) are captured at certain time points to identify cell positions in microenvironment and to evaluate viability. The morphological features are extracted for live and dead cell positions separately to evaluate the heterogeneity of cell viability and apoptosis, respectively. Using spatial point process and Voronoi tessellations, we compute heterogeneity of the locations of cells administered with anti-cancer drugs. We observe in all case studies that, due to the impact of FOLFOX solution, while cell viability decreases in time, the heterogeneity of live cell positions increases, whereas a decrease is noted for the dead cell positions. The relationship between cell viability and spatial heterogeneity among cell positions suggest that they can be used for drug efficacy measurements and utilized as a biomarker for 3D in-vitro microenvironment assays. Preliminary versions of this work have been reported in [14] and [15], where the morphological features of live and dead cell positions were examined to evaluate the heterogeneity of cell viability and apoptosis.
Remainder of this paper is organized as follows. In Sec. II, cell incubation process is presented. Our data acquisition system is introduced in Sec. III. Spatial analysis tools to compute morphological features of colorectal cells are formulated in Sec. IV. The results for cell lines HCT-116, SW-480 and SW-620 are presented with three case studies in Sec. V. Concluding remarks are in Sec. VI.
II. In-Vitro Cell Incubation in 3D Microenvironment
In our in-vitro experiments, human colorectal cancer cell lines of HCT-116, SW-620 and SW-480 were incubated on  cell culture flask using the process described in [16]. A matrigel matrix were used to incubate colorectal cells since various signaling pathways controling cell motility and drug sensitivity in cancer cells are activated by the components of matrigel [17]. In this process, a matrigel basement membrane matrix with a density of
  were used to coat chamber slides. To provide the environment for matrigel polymerization, chamber slides were then stored into an incubator of 37°C for one hour. The cells were collected with trypsin and counted by hemacytometer to add into chamber slides at a density of
  for the in-vitro experiments. The cell suspension was combined with a media of FluoroBrite DMEM to incubate with 10% of fetal Bovine serum, 5% of penicillin and 5% CO2 at 37°C for one day period to allow their recovery from stress.
For prolonged cultured assays, cell viability reduces in time due to the lack of oxygen and nutrients, and the accumulation of waste [3]. In evaluation of the drug impact on cell viability, the cancer cells cultured for experiments were assigned into control and drug administered groups. For the cancer cells which are under treatment, a FOLFOX solution was prepared as a mixture of a concentration of  -Fluorouracil,
  leucovorin and
  oxaliplatin [18]. Both FOLFOX solution and matrigel were provided with Propidium Iodide which fluoresce in red at
  excitation level to detect cell apoptosis with its location. The experimental set up was put into special portable incubator to keep the cells under required conditions of 5% of CO2 and 37°C.
III. 3D Cell Tracking and Data Acquisition System
In our study, using our 3D cell tracking and data acquisition system, which is built based on bio-inspired computation methods from our previous research [19], [20], we observe the morphological changes in interest regions with colorectal cancer cells and anti-cancer drugs. Our data acquisition tool guides an imaging system of an inverted microscope and a digital camera to record the bright field and fluorescent images of the regions of interest at the desired level of magnification during multi-day long experiments in 3D microenvironment.
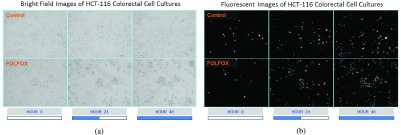
To quantify the dependency between cell locations and viability, we present three case studies, each set up as a 48-hour experiment, where the images of colorectal cancer cell lines HCT-116, SW-620 and SW-480 were captured at every three hours. In Fig. 1, sample bright field and gray-scaled fluorescent images which are captured for colorectal cell line of HCT-116 at hours 0, 24 and 48 are shown. In Fig. 1a, bright field images of control and treatment groups are presented, where the morphological changes can be observed as time progresses. The images in Fig. 1b illustrate the locations of dead cells, which are marked with fluorescent dyes. For each case study, time course of cell viability are determined by calculating the number of incubated cells from Fig. 1a and only the dead cells from Fig. 1b at multiple time points.
FIGURE 1.
Bright field and gray-scaled fluorescent images of colorectal cell line HCT-116 from sample ROIs of control and FOLFOX treated groups captured by an inverted microscope with 20X magnification at hour-0, hour-24, and hour-48 (Case Study-1). (a) Bright field image. (b) Fluorescent image.
IV. Morphological Features of Cell Cultures
Administering feature extraction methods on biological images and their transforms, spatial properties of underlying biological processes can be identified [21]. As part of our ongoing research [9], we apply Voronoi tessellations to pathology slide samples from kidney cancer xenograft mice models to determine the features based on the nuclei locations on slides. In another study [10], we have extracted spatial randomness features from H&E slides to plug into our personalized relevance parameterization method to compute tumor growth parameters. In this paper, we analyze the changes of the morphological features in in-vitro 3D microenvironment using the images captured by our data acquisition system at certain time intervals. The relationship among the locations of incubated cells administered with FOLFOX treatment is evaluated with spatial analysis tools of poisson point process and Voronoi tessellations. In addition to heterogeneity analysis, these images are also evaluated to calculate cell viability based on the ratio of the number of live cells to the number of all incubated cells.
A. Spatial Point Process
Spatial poisson process describes the randomness and heterogeneity of points (i.e., events) statistically based on distances as a similarity measurement among point locations [22]. Spatial randomness in point patterns can be interpreted with the first and second order properties of poisson point process, where the former is calculated to evaluate the variation among point locations in large scale and the latter is to identify the deviation tendency from a complete randomness of neighboring points in a local scale [23]. Quadrat count and kernel estimation can be categorized as the first order properties, while nearest neighbor functions can be defined as second order properties [24].
The randomness in the distribution of biological cells can be examined in terms of underlying Poisson process based on their locations [25]. In this study, to evaluate the heterogeneity among neighboring cell positions, we compute the functions of the second order properties using their spatial proximity. The distance between a cell pair of  and
and  is calculated using Minkowski distance function
  , which can be formulated in a
  dimensional space as
 |
where  is the value of distance metric. Due to the fact that two-dimensional images are captured from the microenvironment, spatial heterogeneity is calculated for an Euclidian plane (i.e.,
  ) with an Euclidian distance metric of
  . For a selected cell, its distance to every other cell is calculated to identify the neighboring cells. For a given nearest neighbor circle with a radius of
  ,
,  ([4], [26]) can be formulated for
  number of cells as
 |
where  is the area of the image and
  is the parameter defined to eliminate the edge effect for a cell pair of
  and
and  [26]. Since the images captured from in-vitro microenvironment have straight boundaries, K-function is calculated with the assumption of
  . The indicator function is defined for the range of
  , which implies that the summation in Eq. (2) is applied for the point pairs whose Euclidian distance is smaller than the selected nearest neighbor radius
  .
.
In the case of a complete spatial randomness (i.e., homogenous point process), the value is  defined as
  for the expected number of observations in a neighboring region of radius
  [4]. To determine how clustered or regular the point pattern is, the standardized version of
  function, defined as
  [22], can be formulated for radius
  as follows
 |
where  function has a positive value if there is an attraction among points, which results in a clustered point pattern, whereas a negative value is calculated for
  in the case of a regular distribution due to the inhibition among points.
We define two types of events, based on live and dead cell positions, for spatial heterogeneity analysis in in-vitro microenvironment. To quantify the heterogeneity among these event locations, where live cells are located and cell apoptoses are occurred, we compute the second order properties of spatial pattern analysis. The relationship between cell viability and spatial heterogeneity among event locations is examined for the cells cultured in FOLFOX solution. First, the bright field and fluorescent images captured by our 3D cell tracking system are processed to identify the cell locations from drug administered group at each time point (e.g., every three hours). In this process, the heterogeneity of a selected image can be quantified based on its deviation from  for a set of radius values. For this purpose, we define set
  with nearest neighbor radius values for an Euclidian planar region
  as
as  , where
  specifies the smallest radius and
  is the step size between consecutive radius values from set
  . Using set
  , heterogeneity is quantified with the definition of
  for the planar region
  as
as
 |
where the weight function  is defined as
  to normalize the effect of radius. Here,
  is the range of radius values (i.e.,
  ), and
  . In this study,
  is computed to evaluate spatial heterogeneity of the images captured from in-vitro microenvironment with colorectal cancer cells.
B. Voronoi Tessellations
Morphological features of digitized images captured from in-vitro microenvironment at regular intervals can be identified using Voronoi tessellations [27]. A Voronoi tessellation is the partitioning of an Euclidian planar region into subregions based on the node locations with respect to each other [8]. To build a Voronoi tessellation diagram, we first define set  for a planar region
  , consisting of all pixel points of a captured image and set
  for the location of cells observed in region
  . The closest cell to a pixel point
  from set
  can be calculated as:
 |
where  is the distance between point
  and the cell
  , formulated in Eq. (1), and the distance metric is set as
  . Once every point
  of planar region
  is associated to the closest cell
  , Voronoi polygon
  corresponding to the cell
  can be stated as:
 |
In our study, for spatial pattern analysis, we construct Voronoi tessellation diagrams based on two different cases, the locations of live cells and cell apoptosis positions. We calculate the deviation among polygon areas to determine the characteristics of the cell positions cultured in in-vitro microenvironment under FOLFOX treatment.
C. Spatial Pattern Analysis of 3D Microenvironment
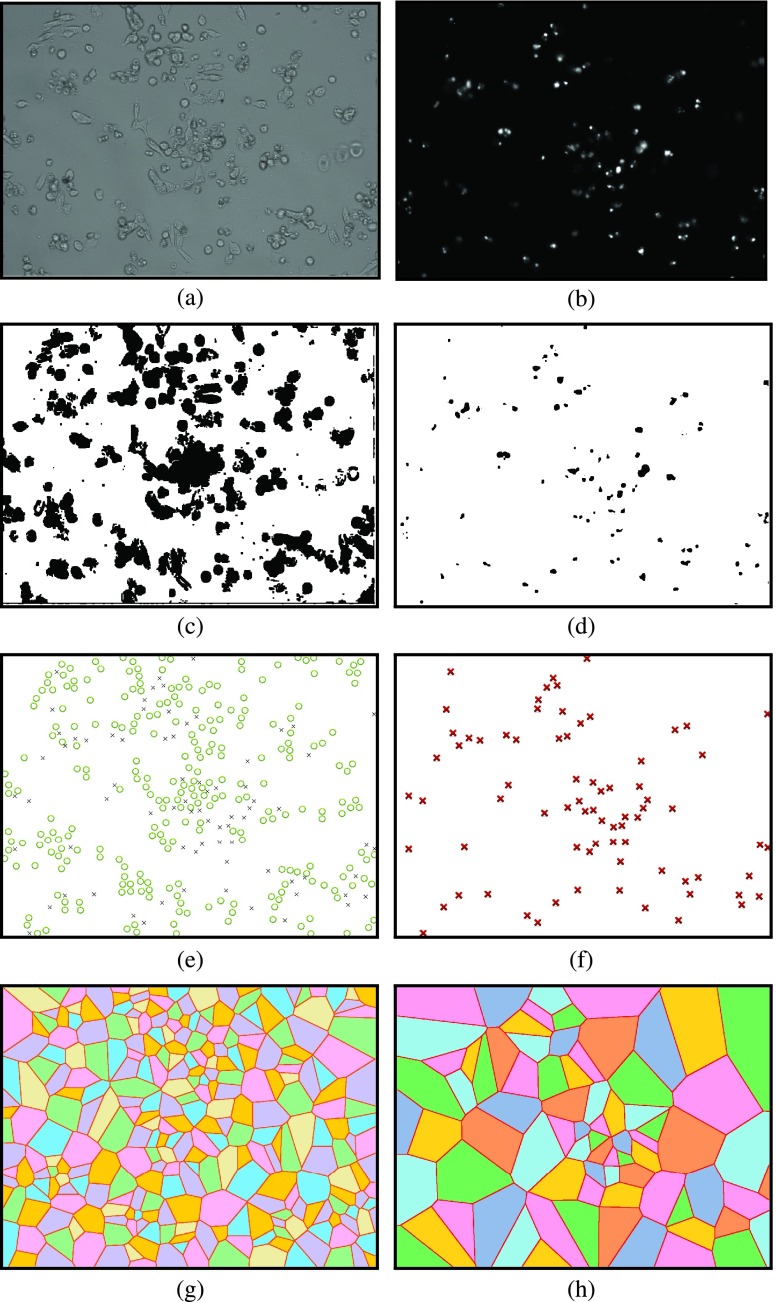
The locations of cells cultured in in-vitro microenvironment are evaluated to apply spatial point process and Voronoi tessellations. In Fig. 2, the process to generate diagrams for spatial analysis methods is illustrated for samples of bright field and fluorescent images captured at hour 24 from a selected region of interest (ROI) of the experiment with HCT-116 cell line. To generate the binary images, the bright field and the gray-scaled fluorescent images, shown in Figs. 2a and 2b respectively, are processed using binary imaging and image morphology operations such as image filtering, image dilation and erosion. In Figs. 2c and 2d, the binary images corresponding to the bright field (in Fig. 2a) and fluorescent (in Fig. 2b) images are presented for the selected ROI from HCT-116.
FIGURE 2.
Spatial pattern analysis process for sample images captured from FOLFOX administered HCT-116 cells at hour 24 in Case Study I. (a) Sample bright field image. (b) Sample fluorescent image. (c) Binary image of sample in (a). (d) Binary image of sample in (b). (e) Live and dead cell positions of sample in (a). (f) Dead cell positions of sample in (b). (g) Voronoi tessellations of live cells in (e). (h) Voronoi tessellations of dead cells in (f).
We implemented software to identify the live and dead cell locations using binary images and to generate their Voronoi tessellations. To illustrate this process, let us consider the selected ROI shown in Fig. 2. First, with the image given in Fig. 2c the locations of all cells are identified. Similarly, binary version of the fluorescent image in Fig. 2d is analyzed to determine the set of dead cell locations. Then, the set of dead cells is subtracted from the set of all cell locations to obtain the live cell locations. Fig. 2e shows both the live and dead cell locations for the selected ROI. The dead cell locations generated by our software are in Fig. 2f. As the last step, our software generates the Voronoi tessellation diagrams for the live and dead cells, as shown in Figs. 2g and 2h, respectively, for the same ROI.
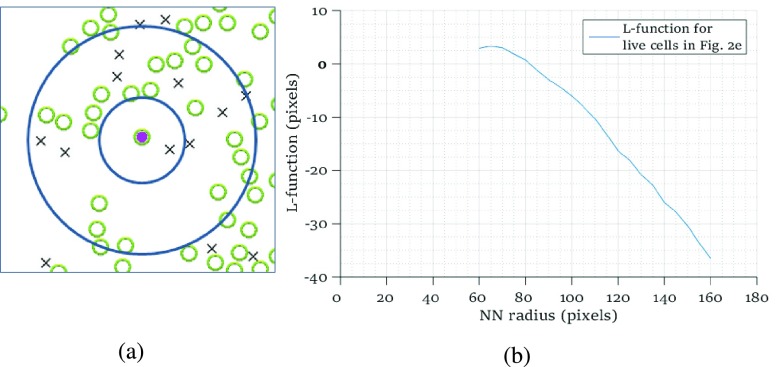
To examine the existence of dependency among incubated colorectal cancer cell positions, we compute the heterogeneity of their locations using poisson point process methods. We determine the smallest and the largest nearest neighbour radius values based on the locations of the live and dead cells observed in all images taken during experiments. The smallest circle is selected for all images such that at least one live cell is in the circle for all live cells, while the largest circle is reached when the increase in the radius value does not change the trend in  function for all live cells for all images. In Fig. 3a, a region taken from Fig. 2e is shown with the smallest and the largest circles for a single selected live cell marked at the center. Fig. 3b gives the trend of L-function, formulated by Eqs. (1) to (3), for the image in Fig. 2e. Here, the magnitude of L-function corresponds to the deviation from complete spatial randomness. In our study, we repeat this process for all images collected from in-vitro microenvironment. With the L-function values, we then compute
  function values, using Eq. (4), for the images captured at different time points.
FIGURE 3.
(a) A region taken from the image in Fig. 2e showing the smallest ( pixels) and largest (
 pixels) nearest neighbour circles for a single selected live cell (marked in purple at the center), (b) L-function computed for radius values for all live cells in Fig. 2e.
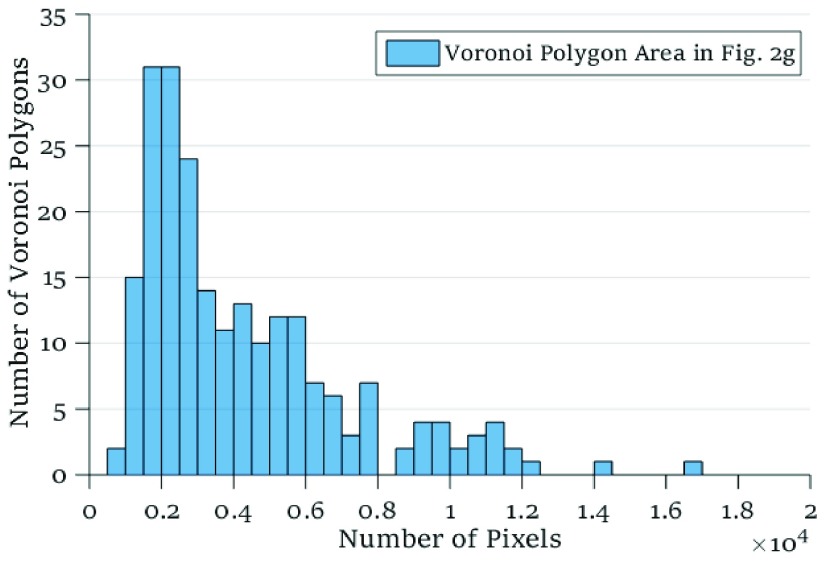
In another approach to evaluate spatial heterogeneity among the cell locations, we compute the deviation among the area values of Voronoi polygons as a heterogeneity metric. A large deviation implies heterogenous distribution of cells, whereas a small deviation points out a homogeneity among cell positions. For the tessellation diagram given in Fig. 2g, the distribution function of the polygon area values is presented in Fig. 4. Their mean value and the standard deviation are calculated as  and
and  pixels, respectively.
FIGURE 4.
Histogram of the Voronoi polygon area for the tessellation diagram in Fig. 2g with a mean value of  and a standard deviation of
  pixels.
Using the results from both spatial analysis methods, we quantify the relationship between cell viability and spatial heterogeneity for the cell lines HCT-116, SW-620 and SW-480, as presented in Sec. V.
V. Analytical Results of In-Vitro Measurements
To study the relationship between cell viability and spatial heterogeneity in the positions of cancer cells, we present three case studies using colorectal cancer cell lines of HCT-116, SW-620 and SW480. For each case study, the cells are divided into drug-free control and anti-cancer treatment groups. Control group of colorectal cancer cells are cultured in metragel, whereas the cells of the treatment group are in FOLFOX solution, and both are provided with nutrition and gas supplies at an ideal temperature of 37°C for 48 hours.
For cell viability evaluation in our 48 hour long experiments, eight regions of interest ROIs are randomly selected for each group. Our data acquisition system tracks the positions of these selected ROIs to capture their bright field and fluorescence dyed images at predetermined intervals (every three hours for this study). Our system is capable of automatically identifying the ROIs at each time point and placing the microscope lens at their central positions, and therefore, maintaining visual focus and tracking the cell clusters in 3D microenvironment throughout the experiments.
The ROI size is determined based on the number of cells located in a selected region. In our experiments, we obtain statistically meaningful results when the images are captured with 20X magnification. For example, with a higher level of magnification (e.g., 40X), the average number of cells observed in selected ROIs was less than 10. The cells within the selected ROI can be seen in the bright field images of Figs. 1 and 2.
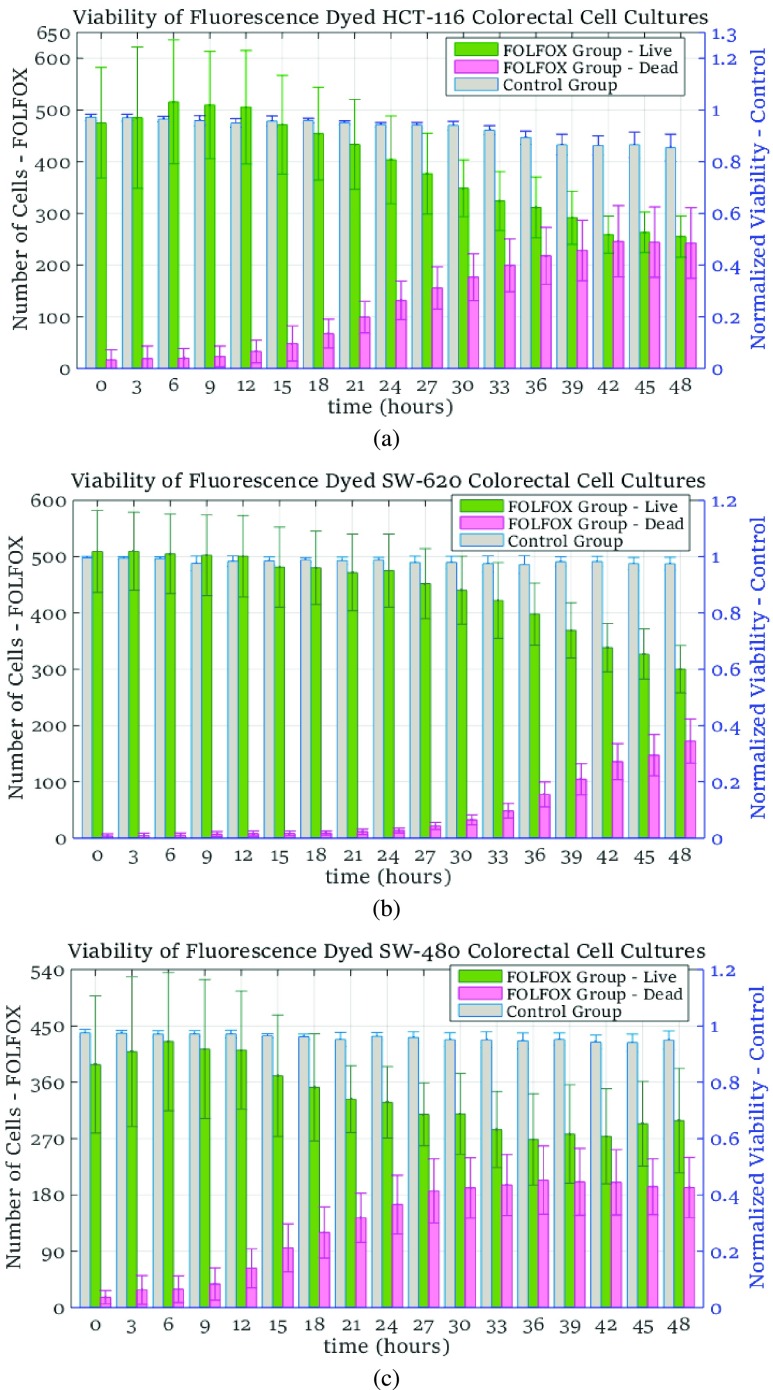
At each time point, the number of cells are calculated using the images captured from control and FOLFOX-treated groups. The spatial heterogeneity is computed based on the locations of live and dead cells, which are identified from the bright field and fluorescent images, respectively. In Fig. 5, cell viability is presented for the colorectal cancer cell lines of HCT-116, SW-620 and SW480. For each case study, left vertical axis is scaled to present the total number of live and dead cells for the FOLFOX-treated groups with green and pink bars, respectively. The normalized values of cell viability for the control groups are given with gray-colored bars, which are scaled with respect to the right vertical axis of Fig. 5. For all experiments, since the ROIs were randomly identified at the beginning of each experiment, a high value of standard deviation in the number of live cells is observed in Fig. 5, implying that the number of cells in the selected regions vary significantly with respect to each other.
FIGURE 5.
Number of cells and normalized cell viability from experimental measurements for colorectal cell lines HCT-116 in (a), SW-620 in (b) and SW-480 in (c).
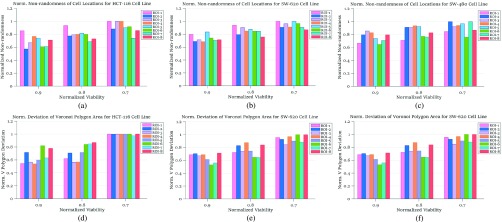
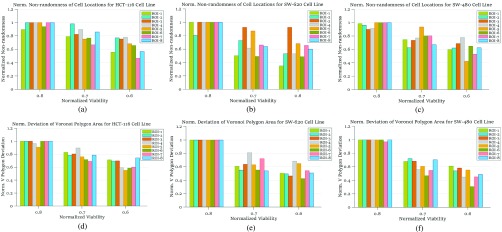
In our case studies, we have examined spatial heterogeneity for the locations of live and dead cells from the drug administered groups. For live cell positions, heterogeneity is evaluated for the normalized viability levels of  , 0.8 and 0.7, corresponding to the time points at which 90%, 80% and 70% of the cells are alive, respectively, as the impact of FOLFOX solution increases. In Fig. 6, the results of spatial point process and Voronoi tessellations are given for the live cell positions. For the morphology analysis of in-vitro cell-based assays with respect to the dead cell locations, the viability levels are selected as
  , 0.7 and 0.6. The spatial heterogeneity results of dead cell locations are presented in Fig. 7.
FIGURE 6.
Normalized heterogeneity results among live cell positions: (a), (b) and (c) are from spatial point process, for colorectal cell lines HCT-116, SW-620 and SW-480, respectively, all are under FOLFOX treatment; (d), (e) and (f) are from deviation results among Voronoi polygon areas for colorectal cell lines HCT-116, SW-620 and SW-480, respectively; all are under FOLFOX treatment.
FIGURE 7.
Normalized heterogeneity results among dead cell positions: (a), (b) and (c) are from spatial point process, for colorectal cell lines HCT-116, SW-620 and SW-480, respectively, all are under FOLFOX treatment; (d), (e) and (f) are from deviation results among Voronoi polygon areas for colorectal cell lines HCT-116, SW-620 and SW-480, respectively, all are under FOLFOX treatment.
A. Case Study I: HCT-116 Colorectal Cell Line
In this case study, cancer cells from colorectal cell line of HCT-116 were cultured in in-vitro microenvironment. Cell viability and the number of cells were evaluated at every three hours during the 48-hour long experiment. As can be seen in Fig. 5a, the number of live cells start decreasing at hour 15 with the impact of the anti-cancer drug. At hour 48, we have measured that the number of dead and live cells are almost equal to each other, implying that approximately 50% of cells were dead at the end of the experiment.
For colorectal cell line of HCT-116, we compute spatial heterogeneity among live cell positions at hours 18, 24 and 30, corresponding to the viability of 0.9, 0.8 and 0.7, respectively. The normalized non-randomness values from spatial point process are given in Fig. 6a. For the same selected ROIs, the deviation among the Voronoi polygon areas is presented in Fig. 6d. With both methods, an increasing trend is observed for the heterogeneity among live cell positions in eight ROIs. Using spatial point process and Voronoi tessellations, the heterogeneity among dead cell locations is evaluated as shown in Figs. 7a and 7d, respectively. For both methods, we have analyze the results for the images captured at hours 24 ( ), 30 (
 ) and 39 (
 ). Similar to the results obtained for live cells, a relationship between the morphological features of dead cells and cell viability is observed such that heterogeneity of the dead cell positions has a decreasing behaviour with the decrease in viability.
B. Case Study II: SW-620 Colorectal Cell Line
The characteristic of cell line SW-620 obtained from human colon lymph node tissue were evaluated in a 48-hour experiment. In Fig. 5b, we observe that the cells are more resistant to anti-cancer agents as a high value of viability remains until hour 24, after which point the viability starts decreasing gradually. At the end of the 48 hour long experiment, the viability is observed as 0.6 as presented in Fig. 5b.
The heterogeneity of the cell positions is computed for hours 27, 36, 42 and 48 corresponding to the viability levels of  , 0.8, 0.7 and 0.6, respectively. For the live cells of the FOLFOX treated group, non-randomness values are shown in Fig. 6b for the selected ROIs. Fig. 6e illustrates the heterogeneity results computed based on the deviation among Voronoi polygon areas. Similar to the case of cell line HCT-116, we observe an increase in the heterogeneity of live cells as the viability decreases. Figs. 7b and 7e show the results of spatial analysis methods for the dead cell locations. Even though the impact of anti-cancer drug for cell line SW-620 is not as strong as it is for the cell line HCT-116, a similar relationship as in Case Study I is observed between spatial heterogeneity of dead cells and cell viability.
C. Case Study III: SW-480 Colorectal Cell Line
The colorectal cell line SW-480 of adenocarcinoma cells are incubated in 3D microenvironment for this case study. The number of live and dead cells from the treatment group and the viability measured for the control group are illustrated in Fig. 5c. Different than the observations for the cell lines HCT-116 and SW-620, the anti-cancer solution has a quick impact on the viability for cell line SW-480. The viability starts decreasing at around hour 9 as shown in Fig. 5c with the bars colored in green and pink for the number of cells. However, drug impact on live cells saturates at a certain time point when the viability was measured as  . For cell line SW-480, it can be concluded that the cells are less resistant to anti-cancer treatment especially during the initial phase of the drug administration.
The results from spatial heterogeneity methods are shown in Figs. 7c and 7f for cell line SW-480. The spatial analysis methods are measured at hours 9 ( ), 15 (
 ), 24 (
 ) and 36 (
 ). An increasing trend is observed for the heterogeneity of the live cell positions with a decrease in cell viability, whereas both spatial point process and Voronoi tessellations generate heterogeneity results decreasing with smaller cell viability values for dead cells.
VI. Concluding Remarks
In this paper, we examine a relationship between cell viability and the spatial heterogeneity of the locations of live and dead cells incubated in 3D in-vitro cell-based assays under the impact of anti-cancer agents We set up three 48-hour long experiments using human colorectal cancer cell lines of HCT-116, SW-620 and SW-480. With our 3D cell tracking and data acquisition system guiding an inverted microscope with a digital camera, were able to capture bright field and fluorescent images of colorectal cancer cells at pre-determined intervals during the experiments. After the locations of live and dead cells in captured images are identified, Poisson point process and Voronoi tessellation methods are applied to extract their morphological features. The spatial analysis results obtained in all case studies for both live and dead cells points out that there is a relationship between cell viability and heterogeneity among cell positions. We observe that heterogeneity of live cell locations increases as the number of live cells in microenvironment decreases under the impact of anti-cancer drugs. For cell apoptosis, our analysis indicate that the randomness in dead cell locations increases as the cell viability in in-vitro cell cultures decreases. Similarly, a decrease in deviation of Voronoi polygon areas for the dead cells is observed as the experiments progress under the impact of anti-cancer drugs. This relationship between morphological features of in-vitro cell based assays and cell viability can be used for drug efficacy measurements and utilized as a biomarker for 3D in-vitro microenvironment assays.
As future direction, we plan to extend this study to include different human carcinoma including breast and kidney cancers with additional clinical measurements such as blood serum samples and genetic information.
Acknowledgments
The authors acknowledge very helpful guidance and suggestions in selection of the colo-rectal cancer cell lines and the choice of drugs from Dr. J. Jousha Smith, a Surgical Oncologist at Memorial Sloan Kettering Cancer Center, New York, NY.
The contents of this document represent the views of the authors and are not necessarily the official views of, or are endorsed by, the U.S. Government, Department of Defense, Department of the Army or the U.S. Army Communications-Electronics RD&E Center.
Biographies
Aydin Saribudak received the B.S. degree in electrical and electronics engineering from Middle East Technical University, Turkey, in 2005. He is currently pursuing the Ph.D. degree with The City College of New York, City University of New York. His interests include biologically inspired computation algorithms, artificial intelligence, and personalized mathematical models for tumor growth and anticancer therapy.

Herman Kucharavy received the B.S. and M.S. degrees in biology from The City College of New York, City University of New York in 2015. His interests include molecular biology and cancer biology. He has taught undergraduate level courses, such as introductory biology and cellular senescence. He is interested in research that focuses on bringing discoveries and ideas from the basic biological research and finding ways to implement them in clinical settings.

Karen Hubbard received the Ph.D. degree. She is currently a Professor and the Chair of the Biology Department with The City College of New York, City University of New York. She is a Molecular Biologist who studies gene expressions during cellular aging. Her research focuses on RNA metabolism during aging and the relationship between cell apoptosis and aging. She is the Director of the partnership program with Memorial Sloan Kettering.

Muharrem Ümit Uyar (F’11) received the B.S. degree from Istanbul Technical University, and the M.S. and Ph.D. degrees from Cornell University, Ithaca, NY, all in electrical engineering. He is a Professor with the Electrical Engineering Department, The City College of New York, City University of New York, and also with the Computer Science Department, Graduate Center. Prior to joining academia, he was a Distinguished Member of the Technical Staff with AT&T Bell Labs. He holds six U.S. patents. His research includes formal testing of complex systems, applications of bioinspired computation techniques to personalized anti-cancer therapy, and decision support systems.
Funding Statement
This work was supported in part by National Institutes of Health (NIH)-Research Centers in Minority Institutions program under Grant 5G12MD007603, the National Science Foundation (NSF) under Grant CNS-0619577, Grant ECCS-0421159, and Grant IIP-1265265, NHI-National Cancer Institute (NCI) under Grant U54CA132378, the NIH-NCI under Grant U54CA137788, the NSF and NIH, and the U.S. Army Communications-Electronics Research, Development and Engineering Center (RD&E) under Contract W15P7T-09-CS021 and Contract W15P7T-06-C-P217.
References
- [1].Kunz-Schughart L. A., Freyer J. P., Hofstaedter F., and Ebner R., “The use of 3-D cultures for high-throughput screening: The multicellular spheroid model,” J. Biomolecular Screening, vol. 9, no. , pp. 273–285, 2004. [DOI] [PubMed] [Google Scholar]
- [2].Pampaloni F., Reynaud E. G., and Stelzer E. H. K., “The third dimension bridges the gap between cell culture and live tissue,” Nature Rev. Molecular Cell Biol., vol. 8, no. 10, pp. 839–845, 2007. [DOI] [PubMed] [Google Scholar]
- [3].Edmondson R., Broglie J. J., Adcock A. F., and Yang L., “Three-dimensional cell culture systems and their applications in drug discovery and cell-based biosensors,” Assay Drug Develop. Technol., vol. 12, no. 4, pp. 207–218, 2014. [DOI] [PMC free article] [PubMed] [Google Scholar]
- [4].Gatrell A. C., Bailey T. C., Diggle P. J., and Rowlingson B. S., “Spatial point pattern analysis and its application in geographical epidemiology,” Trans. Inst. Brit. Geographers, vol. 21, no. 1, pp. 256–274, 1996. [Google Scholar]
- [5].Cressie N., Statistics for Spatial Data. New York, NY, USA: Wiley, 2015. [Google Scholar]
- [6].Perry G. L. W., Miller B. P., and Enright N. J., “A comparison of methods for the statistical analysis of spatial point patterns in plant ecology,” Plant Ecol., vol. 187, no. 1, pp. 59–82, 2006. [Google Scholar]
- [7].Dixon P. M., “Ripley’s K function,” in Encyclopedia of Environmetrics. New York, NY, USA: Wiley, 2002. [Google Scholar]
- [8].Okabe A., Boots B., Sugihara K., and Chiu S. N., Spatial Tessellations: Concepts and Applications of Voronoi Diagrams, vol. 501 New York, NY, USA: Wiley, 2009. [Google Scholar]
- [9].Saribudak A., Dong Y., Gundry S., Hsieh J., and Uyar M. Ü., “Mathematical models of tumor growth using Voronoi tessellations in pathology slides of kidney cancer,” in Proc. 37th Annu. Int. Conf. Eng. Med. Biol. Soc. (EMBC), Aug. 2015, pp. 4454–4457. [DOI] [PubMed] [Google Scholar]
- [10].Saribudak A., Dong Y., Hsieh J., and Uyar M. Ü., “Bio-inspired computation approach for tumor growth with spatial randomness analysis of kidney cancer xenograft pathology slides,” in Proc. 9th EAI Conf. Bio-Inspired Inf. Commun. Technol. (BICT), 2015, pp. 1–8. [Google Scholar]
- [11].Saribudak A., Gundry S., Zou J., and Uyar M. Ü., “A gene expression-based mathematical modeling approach for breast cancer tumor growth and shrinkage,” Netw. Model. Anal. Health Informat. Bioinformat., vol. 4, no. 1, pp. 1–13, 2015. [Google Scholar]
- [12].Saribudak A., Gundry S., Zou J., and Uyar M. Ü., “Genomic based personalized chemotherapy analysis to support decision systems for breast cancer,” in Proc. IEEE Int. Symp. Med. Meas. Appl. (MeMeA), May 2015, pp. 495–500. [Google Scholar]
- [13].Uyar M. Ü. and Gundry S., “Biologically inspired algorithm based method for near real-time tracking of moving objects in three dimensional environment,” U.S. Patent 20 160 077 321, Mar. 17, 2016.
- [14].Saribudak A., Kucharavy H., Hubbard K., and Uyar M. Ü., “Heterogeneity of colorectal cancer cell positions as a cell viability biometrie,” in Proc. IEEE-EMBS Int. Conf. Biomed. Health Informat. (BHI), Feb. 2016, pp. 21–24. [Google Scholar]
- [15].Saribudak A., Kucharavy H., Hubbard K., and Uyar M. Ü., “Quantification of cell apoptosis for in-vitro colorectal cancer cell cultures based on morphological features,” in Proc. IEEE-EMBS Int. Conf. Biomed. Health Informat. (BHI), Feb. 2016, pp. 82–85. [Google Scholar]
- [16].Srinivas U. S., et al. , “5-fluorouracil sensitizes colorectal tumor cells towards double stranded DNA breaks by interfering with homologous recombination repair,” Oncotarget, vol. 6, no. 14, pp. 12574–12586, 2015. [DOI] [PMC free article] [PubMed] [Google Scholar]
- [17].Gurski L. A., Petrelli N. J., Jia X., and Farach-Carson M. C., “3D matrices for anti-cancer drug testing and development,” Oncol. Issues, vol. 25, pp. 20–25, Jan-Feb 2010. [Google Scholar]
- [18].Unger F. T., “Discovery of protein biomarker predictive for the response to FOLFOX therapy in colorectal cancer,” Ph.D. dissertation, Dept. Biochem. Molecular Biol, Hamburg Univ, Hamburg, Germany, 2012. [Google Scholar]
- [19].Kusyk J., Sahin C. S., Uyar M. Ü., Urrea E., and Gundry S., “Self-organization of nodes in mobile ad hoc networks using evolutionary games and genetic algorithms,” J. Adv. Res., vol. 2, no. 3, pp. 253–264, 2011. [Google Scholar]
- [20].Şahin C. Ş., Uyar M. Ü., Gundry S., and Urrea E., “Self organization for area coverage maximization and energy conservation in mobile ad hoc networks,” in Transactions on Computational Science XV. Berlin, Germany: Springer, 2012, pp. 49–73. [Google Scholar]
- [21].Orlov N., Shamir L., Macura T., Johnston J., Eckley D. M., and Goldberg I. G., “WND-CHARM: Multi-purpose image classification using compound image transforms,” Pattern Recognit. Lett., vol. 29, no. 11, pp. 1684–1693, 2008. [DOI] [PMC free article] [PubMed] [Google Scholar]
- [22].Haase P., “Can isotropy vs. anisotropy in the spatial association of plant species reveal physical vs. biotic facilitation?” J. Vegetation Sci., vol. 12, no. 1, pp. 127–136, 2001. [Google Scholar]
- [23].Unwin D. J., “GE, spatial analysis and spatial statistics,” Prog. Human Geogr., vol. 20, no. 4, pp. 540–551, 1996. [Google Scholar]
- [24].Diggle P. J., “On parameter estimation and goodness-of-fit testing for spatial point patterns,” Biometrics, vol. 35, no. 1, pp. 87–101, 1979. [Google Scholar]
- [25].Ripley B. D., “Modelling spatial patterns,” J. Roy. Statist. Soc. Ser. B (Methodological), vol. 39, no. 2, pp. 172–212, 1977. [Google Scholar]
- [26].Ripley B. D., “The second-order analysis of stationary point processes,” J. Appl. Probab., vol. 13, no. 2, pp. 255–266, 1976. [Google Scholar]
- [27].Doyle S., Agner S., Madabhushi A., Feldman M., and Tomaszewski J., “Automated grading of breast cancer histopathology using spectral clustering with textural and architectural image features,” in Proc. 5th IEEE ISBI, May 2008, pp. 496–499. [Google Scholar]


