

Abstract
Alternative splicing allows a single gene to produce multiple transcript-level splice isoforms from which the translated proteins may show differences in their expression and function. Identifying the major functional or canonical isoform is important for understanding gene and protein functions. Identification and characterization of splice isoforms is a stated goal of the HUPO Human Proteome Project and of neXtProt. Multiple efforts have catalogued splice isoforms as “dominant”, “principal”, or “major” isoforms based on expression or evolutionary traits. In contrast, we recently proposed highest connected isoforms (HCIs) as a new class of canonical isoforms that have the strongest interactions in a functional network and revealed their significantly higher (differential) transcript-level expression compared to nonhighest connected isoforms (NCIs) regardless of tissues/cell lines in the mouse. HCIs and their expression behavior in the human remain unexplored. Here we identified HCIs for 6157 multi-isoform genes using a human isoform network that we constructed by integrating a large compendium of heterogeneous genomic data. We present examples for pairs of transcript isoforms of ABCC3, RBM34, ERBB2, and ANXA7. We found that functional networks of isoforms of the same gene can show large differences. Interestingly, differential expression between HCIs and NCIs was also observed in the human on an independent set of 940 RNA-seq samples across multiple tissues, including heart, kidney, and liver. Using proteomic data from normal human retina and placenta, we showed that HCIs are a promising indicator of expressed protein isoforms exemplified by NUDFB6 and M6PR. Furthermore, we found that a significant percentage (20%, p = 0.0003) of human and mouse HCIs are homologues, suggesting their conservation between species. Our identified HCIs expand the repertoire of canonical isoforms and are expected to facilitate studying main protein products, understanding gene regulation, and possibly evolution. The network is available through our web server as a rich resource for investigating isoform functional relationships (http://guanlab.ccmb.med.umich.edu/hisonet). All MS/MS data were available at ProteomeXchange Web site (http://www.proteomexchange.org) through their identifiers (retina: PXD001242, placenta: PXD000754).
Keywords: alternative splicing, isoform networks, canonical isoforms, highest connected isoforms
Graphical Abstract
INTRODUCTION
Alternative splicing is a major mechanism that greatly expands the expressed protein species, especially in higher organisms such as human and mouse.1–10 Consequently, a gene can generate multiple transcripts, which, when translated, may show differences in their expression, functions, and interactions with other biological molecules.11–24 Functional analysis is a major field in genomics and proteomics. Specifically, the identification and characterization of splice isoforms is a goal of the HUPO Human Proteome Project and of neXtProt.25,26 There have been interesting studies on the identification of main functional products at the splice isoform level. For example, the APPRIS study predicts the principal protein isoform based on conservation.27 A recent study suggested that a multi-isoform gene expresses only one dominant isoform at the protein level in a given tissue, providing evidence for functional differences between isoforms.28 A brief overview of a variety of methods for identifying dominant/major/principal isoforms is in our previous work29,30
In contrast to using expression or conservation data, we proposed a network approach to identify the highest connected isoforms (HCIs).29 First, an isoform-level functional network is constructed using the well-established multiple instance learning (MIL) algorithm15,29,31–34 and Gene Ontology and KEGG pathways. A node is an isoform, and an edge represents the probability that the two interconnected translated proteins participate in the same biological process or pathway. An advantage of this approach is that evidence from different source data such as coexpression networks and protein interactions can be integrated into a probabilistic value that describes to what extent two isoforms are cofunctional.29 Based on the network, we identified 3427 HCIs in the mouse which showed statistically significant higher expression than the nonhighest connected isoforms (NCIs), suggesting a correlation between expression and functions. Being complementary to major or dominant isoforms, HCIs provide a unique resource for the mouse genomics community to investigate major gene products and to facilitate further studies on disease pathways and target of therapies.
Moving from mouse models to humans for the identification of HCIs is valuable for understanding major human gene products, both transcripts and proteins. Our major aim is cataloguing human HCIs, investigating their expression signatures across a number of tissues, and comparing them with mouse HCIs using the network approach.29 First, we built a genome-wide isoform-level functional network for the human by integrating a large compendium of genomic features: RNA-seq (1866 samples), amino acid composition (1 feature), protein docking (1 feature) and conserved domain (1 feature) (Figure 1). We also developed a web server to make the network publicly available (http://guanlab.ccmb.med.umich.edu/hisonet), providing a rich resource for investigating functional interactions of human isoforms. From the network, we identified HCIs and NCIs for 6157 multi-isoform human genes, with their expression behavior examined using an independent quality-controlled test set of 940 RNA-seq samples across many tissues including heart, liver, and kidney. Proteomic data of two normal human tissues—retina and placenta—were used to investigate protein-level expression of HCIs. We present instructive examples of pairs of splice isoforms. Furthermore, we performed homology analysis of HCIs between the mouse and human.
Figure 1.
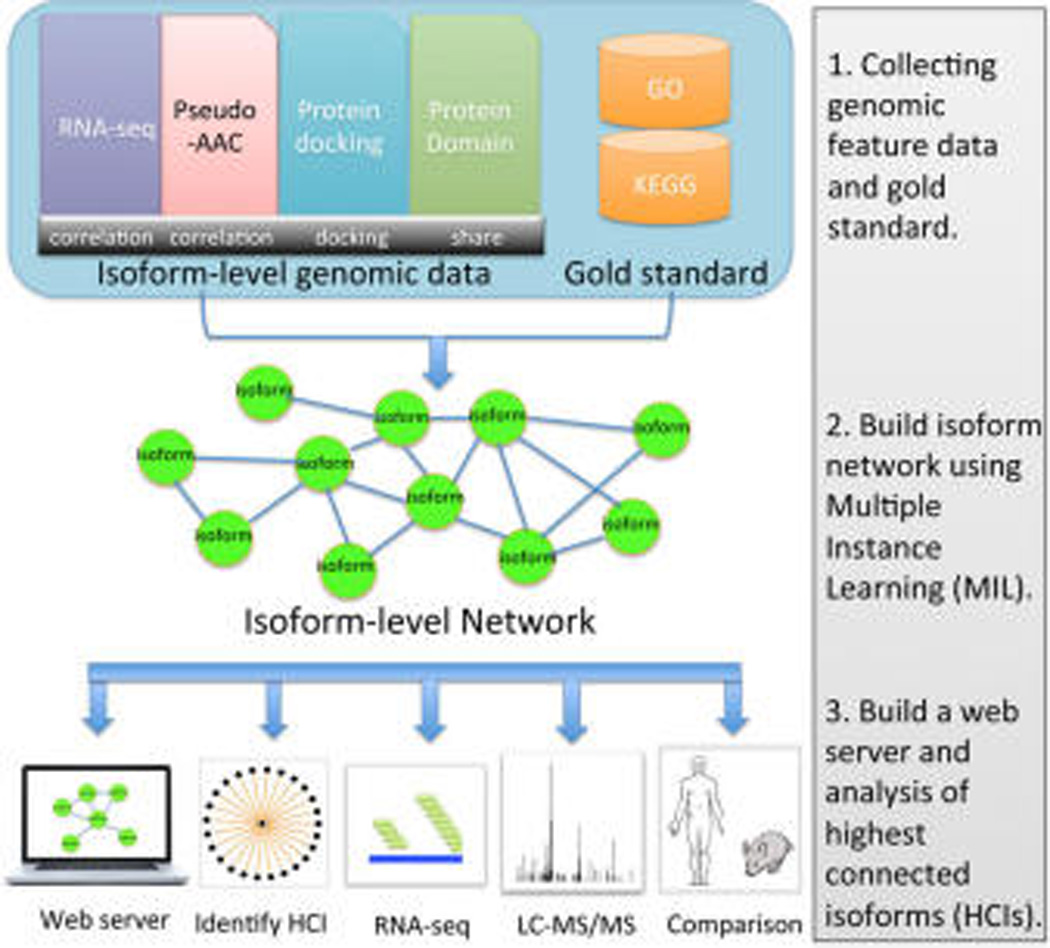
Workflow for the identification and expression analysis of the HCIs in the human. We first collected four types of isoform-level genomic feature data (RNA-seq, pseudoamino acid composition, protein docking and conserved domain) and a gold standard set of functionally related gene pairs derived from GO and KEGG database. These data were integrated using the multiple instance learning (MIL) method, and an isoform-level functional network was built for the human. In this network, each node represents a splice isoform, and the edge describes the probability ranging from 0 to 1 that two isoforms coparticipate in the same biological process or pathway. Finally, HCIs were identified using our established method. Independent RNA-seq and proteomic data were used to examine the expression of HCIs. Comparison of human and mouse HCIs was performed.
METHODS
Constructing Isoform-Level Functional Network Using Multiple Instance Learning
Multiple Instance Learning
The algorithmic challenge faced when constructing isoform networks is that supervised learning methods such as support vector machines35–37 and Bayesian networks19,20,38 cannot be directly used due to the lack of functional annotation at the isoform level.15,29,34 To solve this problem, we used multiple instance learning (MIL) to predict isoform-level networks by integrating isoform level genomic features and gene-level functional annotation data (Figure 1). Briefly, there are two fundamental concepts for MIL: bags and instances. In the context of isoform network prediction, a bag is a gene pair, and an instance represents any possible isoform pair of the gene pair. Suppose that A and B are two genes which have two and three isoforms, denoted A1, A2 and B1, B2, B3, respectively. The pair formulated by these two genes, denoted A-B, is treated as a bag in MIL. There are in total six possible isoform pairs for this gene pair: A1-B1, A1-B2, A1-B3, A2-B1, A2-B2, and A2-B3. Each isoform pair is treated as an instance of the bag (gene pair). MIL predicts isoform-level functional relationship networks based on the following three assumptions:29,34 (1) a gene pair is assumed to be functionally related if they participate in the same biological process or pathway, defined as coannotated to the same gene ontology (GO) biological process term39 or a Kyoto Encyclopedia of Genes and Genomes (KEGG) pathway;40 (2) a gene pair (bag) is assumed to be positive if at least one of its isoform pairs (instance) is functional; and (3) in contrast, none of the isoform pairs of a negative gene pair is functionally related.
To build the isoform network for the human, we collected four types of genomic feature data and a gold standard set of functionally related gene pairs (Figure 1), which are described below:
RNA-seq Transcript Expression
We downloaded all publicly available human RNA-seq data from the short read archive (SRA) database41 as of June 5, 2014, which included 825 data sets containing 12 707 samples. The Sailfish software (version 0.6.3)42 was used to estimate splice isoform expression level in terms of RPKM (Reads Per Kilobase of exon per Million fragments mapped) based on the RefSeq human genome build (version 37.2) which contains a total of 32 125 protein-coding RNA. Noncoding RNAs were not considered in this study. Then, samples with read mapping rate <70% were removed. In each data set, transcripts with low expression level (RPKM < 0.1) in more than 10% of samples were removed.29 After doing so, we obtained 314 quality-controlled data sets covering 2706 samples. Among them, we selected 59 data sets with sample size ≥10 (comprising 1866 samples in total, see Table S1), and calculated, for all possible isoform pairs in each data set, their Fisher’s z-transformed Pearson correlations which were used as feature data to build the isoform network for the human formula 1.43 The reason to use z-transformation is to ensure that the correlation coefficients are normally distributed and comparable across data sets. All the 940 samples in the remaining 255 data sets were used as an independent test set to investigate the expression behavior of HCIs and NCIs.
| (1) |
Pseudoamino Acid Composition
Amino acid composition (AAC) is a commonly used feature to characterize protein sequences. The sequential information on amino acids in a protein is important for protein structures and functions, but is not captured by AAC. For this reason, a feature that is able to take into account sequential information was developed, which does not really reflect AAC and therefore was called pseudo-AAC together with the standard amino acid composition.44 Here, we generated pseudo-AAC for each isoform, followed by calculating Fisher’s z-transformed Pearson correlation between isoform pairs as the feature data.
Protein Docking Score
We computed a quantitative physical interaction score for each isoform pair using the SPRING algorithm.45 Briefly, SPRING is a template-based algorithm for protein–protein interaction prediction. SPRING first builds 3-D structures of protein isoforms followed by predicting their interaction potential. This pairwise docking score was used as a feature for building the isoform-level network for the human.
Conserved Domain
We downloaded domain data from the Conserved Domain Database (CDD),46 which is a protein annotation resource composed of well-annotated multi-sequence alignment models for identifying domains. It contains NCBI-curated domains as well as imported data from, for example, Pfam47,48 and SMART.49 For each query protein, CDD outputs four tiers of domains; only the top tier, called specific hits with high confidence, was used. For each possible protein pair, we then calculated the number of shared domains between them and used this number as a pairwise feature to construct the human isoform network.
Gold Standard of Functionally Related Gene Pairs
The GO biological process terms and KEGG pathways were used to derive functionally related gene pairs, according to previous work.17–19 To avoid too specific or too general annotations, only the biological processes/pathways containing at least 5 and fewer than 300 annotated genes were used. We derived all coannotated gene pairs and identified 772 086 positive gene pairs. Since there is no gold standard of negative gene pairs available, we randomly generated gene pairs from the whole genome space as negatives that are 19 times the number of positives based on our previous study.17,19,20,29
Isoform Networks for Identifying HCIs in the Human
Based on the isoform-level functional relationship network constructed in the previous step, the HCIs were identified using our established method.29 For a multi-isoform gene with k isoforms, we first calculated the average functional relationship (AFR) score for each isoform as the mean functional connections between the isoform and its top neighbors, denoted AFR1, AFR2, AFR3,… AFRk. Thereafter, the isoform with the maximum AFR score is selected as the HCI for the gene under investigation. The other isoforms of the same gene are considered as NCIs. For each gene, we also calculated its ratio of the maximal to minimal AFR score to quantify the difference between isoforms:29
| (2) |
A gene with ratio >1.5 was considered to have large differences in its isoform functional relationship.
Independent Transcript-Level Expression Analysis of HCIs
As described above (see Methods section), 940 RNA-seq samples (Table S1) not used for building the human isoform network were then available to be used as an independent test set to interrogate the expression signal of HCIs and NCIs at the transcript level. For each sample, the expression data were divided into two groups: one for HCIs and the other for NCIs. The mean expression of each group was calculated to compare their average expression level. The Mann–Whitney U test is used to examine whether HCIs and NCIs are differentially expressed or not. This test method does not assume any data distribution and is robust.
Human Proteomic Data for Validation of HCIs
Data Set
For proteomic validation purposes, we used publicly available data from two different studies on human normal tissues. The first data set is a proteomic analysis on retinal tissue by Zhang et al.50 (http://proteomecentral.proteomexchange.org/cgi/GetDataset?ID=PXD001242). According to this study, proteins were extracted from five normal retinal tissues and fractionated using SDS-PAGE. The peptides were then analyzed using LC-MS/MS on an Orbitrap Elite mass spectrometer. After mass-spectrometric analyses they selected peptides with greater than 95% probability by the PeptideProphet algorithm for further analyses. We downloaded the Supplementary Table 1 with this peptide information (http://onlinelibrary.wiley.com/doi/10.1002/pmic.201400397/suppinfo) for our analyses.
The second data set was downloaded from PRIDE archive (http://www.ebi.ac.uk/pride/archive/projects/PXD000754). We downloaded the mass spectrometric search result files. Peptides with greater than 95% PeptideProphet probability were extracted from these files and used for isoform analyses.
Isoform Identification
The downloaded peptides were blasted using the NCBI sequence alignment BLASTP tool (http://blast.ncbi.nlm.nih.gov/Blast.cgi?PROGRAM=blastp&PAGE_TYPE=BlastSearch&LINK_LOC=blasthome) against UniProt protein sequences (UniProt fasta files released on 06/24/15). The analysis process is as follows:
Peptides that were perfectly aligned to proteins with no mismatches were selected.
Proteins with no proteotypic peptides were removed.
Only the proteins from genes with more than one known protein product were retained.
RESULTS AND DISCUSSION
Genome-Wide Human Isoform Network and the Web Server
Using our MIL method, we built the isoform level functional relationship network at genome scale for the human. As expected, the integrated network shows higher prediction accuracy than each single feature (Figure S1). This network includes 19 540 genes that encode a total of 32 125 protein-coding splice isoforms. In this network, each node is an isoform, and the edge indicates the probability that two connected isoforms would coparticipate in the same biological process or pathway. To make the functional network searchable, we developed a web server (http://guanlab.ccmb.med.umich.edu/hisonet) which allows users to input a gene or an isoform to investigate their isoform networks. For each isoform, we also mapped its top connected isoforms to their gene names and conducted GO enrichment analysis. Significantly enriched biological processes are shown along with the network, providing a way to associate the networks with their functions.
Identifying the HCIs and NCIs in the Human
We first identified 6157 multi-isoform genes encoding 17 962 protein-coding isoforms. For each multi-isoform gene, we calculated the AFR score for each of its isoforms, then designated the one with the highest AFR score as the HCI. The remaining isoforms were considered as NCIs.
Specific to our Chromosome 17 Human Proteome Project, an example is the ABCC3 gene (ATP-binding cassette, subfamily C (CFTR/MRP), member 3) which is located at chr17:48712205–48769063. Its HCI (NM_003786.3, ABCC3_1) has an AFR score 5 times larger than that of the NCI (NM_001144070.1, ABCC3_2) (Figure 2, upper panel). The NCI contains only one domain, which is the ABC transporter membrane region; in contrast, the HCI contains three additional domains, including ATP-binding cassette domain 1 of multidrug resistance-associated protein. Another example is RBM34 (RNA binding motif 34, chr1:235,294,498–235,324,571). The AFR scores of its two isoforms NM_015014.2 (RBM34_1) and NM_001161533.1 (RBM34_2) (Figure 2, middle panel) are 0.998 and 0.156, respectively. Therefore, the former is HCI, and the latter is NCI. According to the annotation in the RefSeq database (http://www.ncbi.nlm.nih.gov/gene/23029), the HCI contains three RNA binding motifs, while the NCI has only one general binding motif, again suggesting that the HCI selected by our method is accurate.
Figure 2.
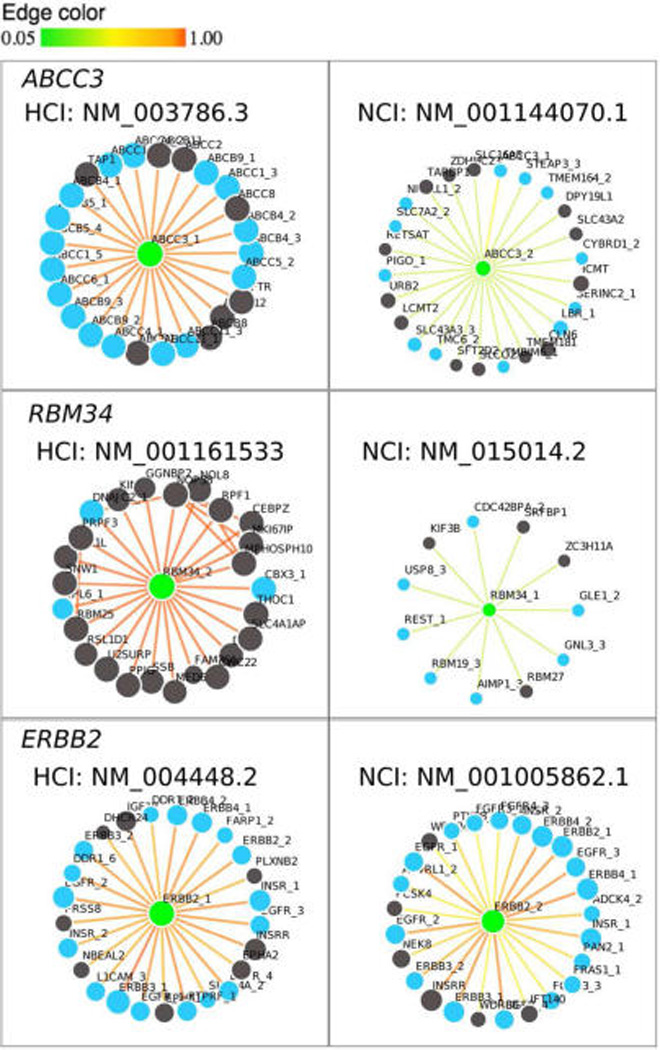
Illustrations of the HCI and NCI using the ABCC3 (ATP-Binding Cassette, Sub-Family C (CFTR/MRP), Member 3, chr17:48,712,205-48,769,063), RBM34 (RNA binding motif 34, chr1:235,131,183–235,161,616), and ERBB2 (erb-b2 receptor tyrosine kinase 2, chr17:37,844,167–37,884,915) genes. For each gene, the isoform with higher AFR score is selected as HCI. Black and blue nodes represent single-isoform and multi-isoform genes, respectively; green nodes indicate the queried gene/isoform. Gene names followed by numbers indicate isoforms for easily recognizing the originating-gene, which are NM_003786.3 (ABCC3_1), NM_001144070.1 (ABCC3_2); NM_015014.2 (RBM34_1), NM_001161533.1 (RBM34_2); NM_004448.2 (ERBB2_1), NM_001005862.1 (ERBB2_2).
We observed that the AFR scores of some NCIs can be very close to that of its HCI. In this situation, distinguishing HCIs from NCIs may be inaccurate. Therefore, we categorized those NCIs as HCI candidates if their AFR scores were 80% or 90% or more that of HCIs, according the criterion in our previous work.29 In the case of ERBB2 (erb-b2 receptor tyrosine kinase 2, chr17:37844167–37884915),11,14 the AFR score of its HCI (0.95, NM_004448.2, ERBB2_1) is not much higher than that of its NCI (0.79,°NM_001005862.1, ERBB2_2) (Figure 2, lower panel). The HCI encodes a 30 amino acid longer protein compared to NCI, but both isoforms have the same seven domains based on NCBI. Another example is the ANXA7 gene (Annexin A7, chr10:75,135,189-75,173,841) whose HCI (NM_001156.3) has an AFR score = 0.935. The NCI (NM_004034.2) with AFR score = 0.900 is treated as an HCI candidate. All HCIs, NCIs, and HCI candidates are listed in Table S2.
Differential Tissue Expression Between HCIs and NCIs
Motivated by the interesting finding that HCIs showed significantly higher expression at the transcript level than NCIs across a variety of tissues in the mouse,29 we asked whether this finding holds in the human. Based on the independent test set of 940 RNA-seq samples (Table S1), we found that HCIs showed significantly higher expression (p < 0.05) than NCIs in 914 human samples using the Mann–Whitney U test. Plotting the mean expression of HCIs against that of NCIs clearly shows their differential expression (Figure 3A, blue dot) regardless of tissues and cell lines, suggesting a shared gene expression regulation mechanism in different body compartments. Moreover, this observation is consistent with what was observed in the mouse.29 The observation that the most functional isoforms at the transcript level tend to show higher expression levels implies that a transcript with higher expression level is expected to be more functional.
Figure 3.
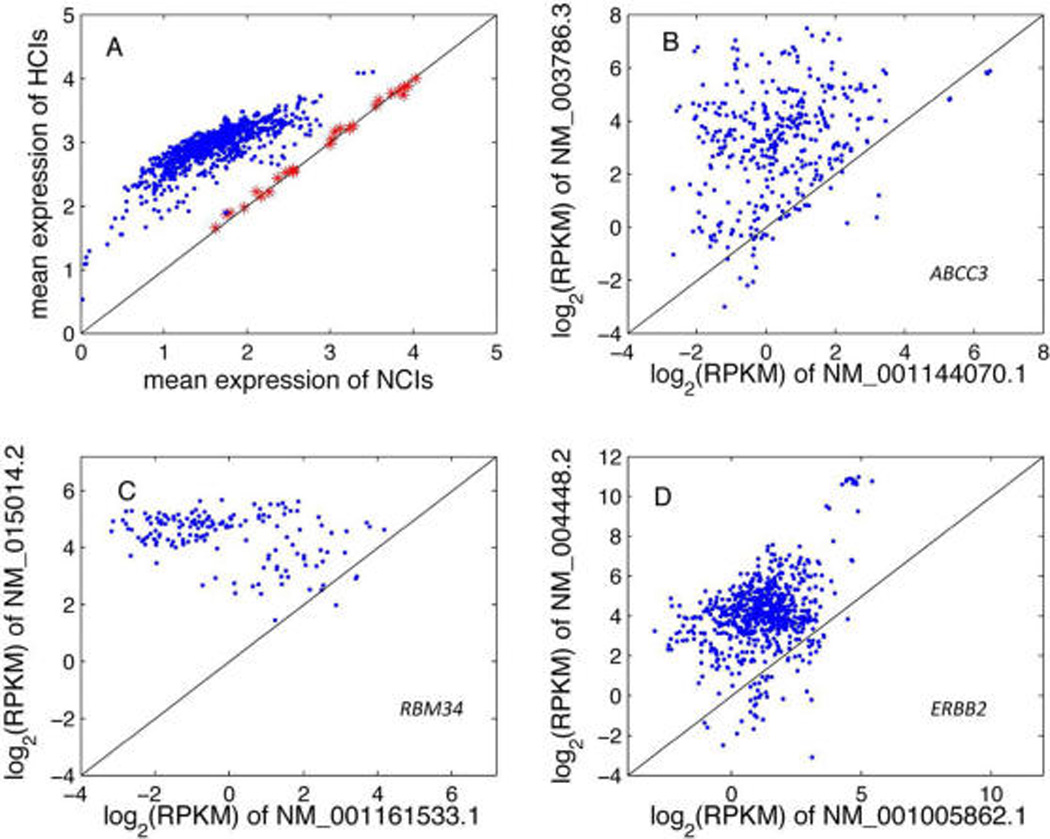
Differential expression behavior between HCIs and NCIs based on 940 RNA-seq samples that were not used in building the human isoform network. A, the mean expression of HCIs is much higher than that of NCIs within each sample (blue dot). It was observed that HCIs showed lower or insignificantly higher expression than NCIs in 26 test samples (red star). The reason is that these samples were measured using 3′-end sequencing that is not able to differentiate expression between isoforms. B, expression level comparison of NM_003786.3 and NM_001144070.1, which are the HCI and NCI of the gene ABCC3 (ATP-Binding Cassette, Sub-Family C (CFTR/MRP), Member 3), respectively. Each dot represents one sample. C and D, expression comparison between HCI and NCI for RBM34 (RNA binding motif 34) and ERBB2 (erb-b2 receptor tyrosine kinase 2).
For the remaining 26 samples (Figure 3A, red star) where no significant differences were observed between HCIs and NCIs, we found that they were all measured using a 3′-end sequencing technology. This technique is not able to quantify isoform expression and led to the apparently same expression level between HCIs and NCIs. As an example, the expression distribution of HCIs completely overlaps with that of NCIs for the RNA-seq experiment (SRX283705, hESCs cell at S phase) because a 3′ library was prepared for RNA-seq sequencing (Figure S2). The expression distributions of HCIs and NCIs for all test samples are provided (Figure S2).
The above observation indicates that, for an individual gene, its HCI would most likely show higher expression than the NCI. Again, taking the ABCC3 gene as an example, we identified 371 samples where both of its two isoforms (HCI: NM_003786.3, NCI: NM_001144070.1) were expressed. The comparison reveals that the expression of HCI is much higher (p < 0.001) than that of NCI (Figure 3B). For RBM34, its HCI (NM_015014.2) showed much higher (p < 0.001) expression than NCI (NM_001161533.1) (Figure 3C). Of interest, for ERBB2 whose HCI and NCI have close AFR scores, its HCI also showed significantly higher (p < 0.001) expression than its NCI (Figure 3D).
Proteomic Validation of HCIs
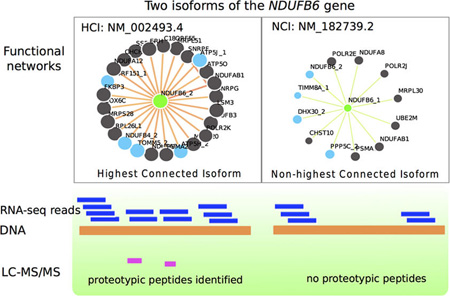
To investigate the expression of HCIs at the protein level, we profiled protein isoform expression in data sets from two normal human tissues, retina and placenta. Taking the retina as an example, we first calculated the number of multi-isoform genes (with ratio >1.5, calculated using formula 2, see Methods section) whose splice isoforms were expressed at both transcript and protein level, which is 74 in this case (Table 1). We found that 58 of these 74 genes have protein expression evidence for their HCIs, which is significant (p < 0.0001) compared to the number of HCIs which overlap with expressed protein isoforms by chance (27 ± 4). Taking the NDUFB6 (NADH dehydrogenase (ubiquinone) 1 beta subcomplex, 6) gene as an example, its isoform networks are shown in Figure 4. The isoform NM_002493.4 (NDUFB6_2) with the highest AFR score = 0.971 was selected as HCI, whereas NM_182739.2 (NDUFB6_1) with AFR score = 0.168 was NCI. Based on our proteomic data, we found that the protein isoform is expressed for HCI but not for NCI. An example for the placenta tissue is M6PR (Mannose-6-Phosphate Receptor). Its HCI NM_002355.3 (AFR = 0.971) is expressed at the protein level, whereas its NCI NM_001207024.1 (AFR = 0.179) is not (Figure S3). In both tissues, HCIs were found to be a promising indicator of protein-level expression (Table 1). We have provided those genes with protein level evidence for HCIs in both tissues in Table S3.
Table 1.
Overlap between Our Predicted HCIs and the Expressed Protein Isoforms in Human Normal Tissues Based on Multi-Isoform Genes with Their Isoforms Expressed at Both Transcript and Protein Levela
| tissues | number of multi-isoform genes | Nobserved | Nchance | P-value |
|---|---|---|---|---|
| retina | 74 | 58 | 27 ± 4 | <0.0001 |
| placenta | 83 | 68 | 32 ± 4 | <0.0001 |
Nobserved: The number of genes whose HCI is expressed at protein level; Nchance: the number of genes whose HCI has protein expression evidence by chance. Protein isoform identification was based on proteotypic peptides
Figure 4.
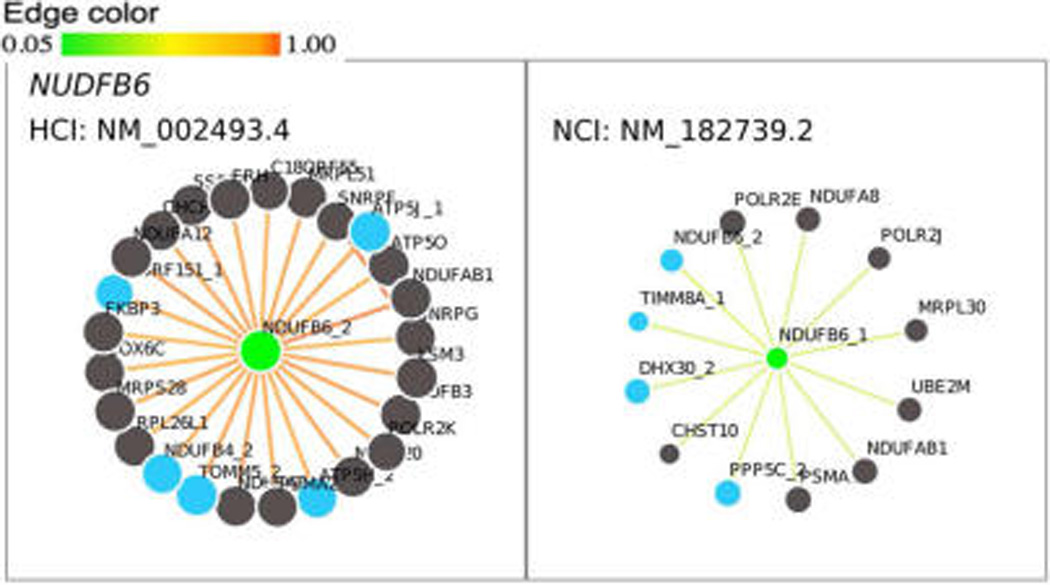
Functional networks of HCI (NM_002493.4, NDUFB6_2) and NCI (NM_182739.2, NDUFB6_1) of NDUFB6 (NADH dehydrogenase (ubiquinone) 1 beta subcomplex, 6) gene.
Comparison between Human and Mouse HCIs
Because humans and mice have homologue genes, it is of interest to compare HCIs between homologues. From the human and mouse multi-isoform genes with ratio >1.5 (calculated using formula 2, see Methods section), we identified 306 homologue genes each of which has an HCI in the mouse and an HCI in the human, denoted as HCIm and HCIh, respectively. We hypothesized that the proteins encoded by HCIm and HCIh are homologous. Using the Homologene database in NCBI (http://www.ncbi.nlm.nih.gov/homologene), we identified 61 of the 306 homologue genes whose mouse and human HCIs are homologues (Table S4), which is significant (p = 0.0003) compared to the null distribution calculated as the number of genes whose HCIm and HCIh are the same by chance using the following procedure. First, for each homologue gene, we randomly picked one of its transcripts in the mouse and another one in the human; then we examined whether the proteins encoded by these two transcripts are homologous, as listed in Homologene. We found that the number of homologue genes whose HCIm and HCIh are also homologues is 41 ± 6 by chance. This result suggests an evolutionarily conserved characteristic of HCIs between species.
CONCLUDING REMARKS
Alternative splicing enables a single gene to generate multiple protein isoforms that may show differences in their expression and/or functions.15,51 Such differences have motivated the search for canonical isoforms labeled “principal” or “major” or “dominant” isoforms.27,28,52 Using our isoform-level functional network approach, we interrogated the HCIs in the human by integrating a large compendium of genomic feature data; we identified 6157 HCIs from multi-isoform genes, providing a new set of functional isoforms that could facilitate further investigation of main gene products, especially at the protein level. The differential expression behavior between HCIs and NCIs previously found in the mouse was replicated in the human, suggesting the conservation of HCIs. Using proteomic data of two human tissues, we found that HCIs are a promising indicator of expressed protein isoforms. Due to the conservation of genes between similar species in terms of genome sequence, we tested the hypothesis that HCIs of homologue genes are also likely to have transcript-level homology. The result showed that mouse and human HCIs are significantly (p = 0.0003, see Comparison between Human and Mouse HCIs section) likely to be homologues, supporting the conservation of our identified HCIs across species. This finding also supports our previous comparative results that HCIs significantly (p < 0.000001, see Table 1 in ref29) overlap with the APPRIS principal isoform that were identified through multispecies sequence conservation.27,29 Summing up, as a new catalog of splice isoforms, HCIs show interesting characteristics and are expected to facilitate the study of main human gene products and possibly disease pathways. These results lay a foundation for proteome-based studies and for the functional annotation of splice isoforms in neXtProt and other databases.
Supplementary Material
Acknowledgments
This work is supported by National Institutes of Health grants 1R21NS082212-01 (YG) and U54ES017885 (GSO).
Footnotes
ASSOCIATED CONTENT
- Figure S1. Comparison of the prediction accuracies between each feature and the integrated network in terms of area under the receiver-operating characteristic (AUC) (PDF)
- Figure S2. The expression distribution of HCIs and NCIs in each of the 940 test samples (PDF)
- Figure S3. Functional networks of HCI (NM_002355.3, M6PR_1) and NCI (NM_001207024.1, M6PR_2) of M6PR (Mannose-6-Phosphate Receptor) gene. Data for building isoform networks, for deriving transcript expression, for proteomic validation, and for assessing isoform-level homology (PDF)
- Table S1. RNA-seq samples used for building human isoform networks (training) and for investigating HCI expression (test) (XLSX)
- Table S2. The list of HCIs, NCIs and HCI candidates for the human (XLSX)
- Table S3. The genes with HCIs expressed at protein level in normal human tissues (XLSX)
- Table S4. The list of 61 genes whose HCIs in the mouse and human are homologues (XLSX)
The authors declare no competing financial interest.
REFERENCES
- 1.Calarco JA, Saltzman AL, Ip JY, Blencowe BJ. Technologies for the global discovery and analysis of alternative splicing. Adv. Exp. Med. Biol. 2007;623:64–84. doi: 10.1007/978-0-387-77374-2_5. [DOI] [PubMed] [Google Scholar]
- 2.Kawai S, Kato T, Inaba H, Okahashi N, Amano A. Odd-skipped related 2 splicing variants show opposite transcriptional activity. Biochem. Biophys. Res. Commun. 2005;328(1):306–311. doi: 10.1016/j.bbrc.2004.12.173. [DOI] [PubMed] [Google Scholar]
- 3.Tress ML, Wesselink J-J, Frankish A, Lóez G, Goldman N, Löytynoja A, Massingham T, Pardi F, Whelan S, Harrow J, Valencia A. Determination and validation of principal gene products. Bioinformatics. 2008;24(1):11–17. doi: 10.1093/bioinformatics/btm547. [DOI] [PMC free article] [PubMed] [Google Scholar]
- 4.Stamm S, Ben-Ari S, Rafalska I, Tang Y, Zhang Z, Toiber D, Thanaraj TA, Soreq H. Function of alternative splicing. Gene. 2005;344(3):1–20. doi: 10.1016/j.gene.2004.10.022. [DOI] [PubMed] [Google Scholar]
- 5.Yura K, Shionyu M, Hagino K, Hijikata A, Hirashima Y, Nakahara T, Eguchi T, Shinoda K, Yamaguchi A, Takahashi K-i, Itoh T, Imanishi T, Gojobori T, Go M. Alternative splicing in human transcriptome: Functional and structural influence on proteins. Gene. 2006;380(2):63–71. doi: 10.1016/j.gene.2006.05.015. [DOI] [PubMed] [Google Scholar]
- 6.Feng J, Li W, Jiang T. Inference of isoforms from short sequence reads. J. Comput. Biol. 2011;18(3):305–321. doi: 10.1089/cmb.2010.0243. [DOI] [PMC free article] [PubMed] [Google Scholar]
- 7.Griffith M, Griffith OL, Mwenifumbo J, Goya R, Morrissy AS, Morin RD, Corbett R, Tang MJ, Hou YC, Pugh TJ, Robertson G, Chittaranjan S, Ally A, Asano JK, Chan SY, Li HI, McDonald H, Teague K, Zhao Y, Zeng T, Delaney A, Hirst M, Morin GB, Jones SJ, Tai IT, Marra MA. Alternative expression analysis by RNA sequencing. Nat. Methods. 2010;7(10):843–847. doi: 10.1038/nmeth.1503. [DOI] [PubMed] [Google Scholar]
- 8.Suzuki H, Osaki K, Sano K, Alam AHMK, Nakamura Y, Ishigaki Y, Kawahara K, Tsukahara T. Comprehensive analysis of alternative splicing and functionality in neuronal differentiation of P19 cells. PLoS One. 2011;6(2):e16880. doi: 10.1371/journal.pone.0016880. [DOI] [PMC free article] [PubMed] [Google Scholar]
- 9.Resch A, Xing Y, Modrek B, Gorlick M, Riley R, Lee C. Assessing the impact of alternative splicing on domain interactions in the human proteome. J. Proteome Res. 2004;3(1):76–83. doi: 10.1021/pr034064v. [DOI] [PubMed] [Google Scholar]
- 10.Shargunov AV, Krasnov GS, Ponomarenko EA, Lisitsa AV, Shurdov MA, Zverev VV, Archakov AI, Blinov VM. Tissue-specific alternative splicing analysis reveals the diversity of Chromosome 18 transcriptome. J. Proteome Res. 2014;13(1):173–182. doi: 10.1021/pr400808u. [DOI] [PubMed] [Google Scholar]
- 11.Menon R, Omenn GS. Proteomic characterization of novel alternative splice variant proteins in human epidermal growth factor receptor 2/neu-induced breast cancers. Cancer Res. 2010;70(9):3440–3449. doi: 10.1158/0008-5472.CAN-09-2631. [DOI] [PMC free article] [PubMed] [Google Scholar]
- 12.Menon R, Roy A, Mukherjee S, Belkin S, Zhang Y, Omenn GS. Functional implications of structural predictions for alternative splice proteins expressed in Her2/neu-induced breast cancers. J. Proteome Res. 2011;10(12):5503–5511. doi: 10.1021/pr200772w. [DOI] [PMC free article] [PubMed] [Google Scholar]
- 13.Omenn GS, Menon R, Zhang Y. Innovations in proteomic profiling of cancers: Alternative splice variants as a new class of cancer biomarker candidates and bridging of proteomics with structural biology. J. Proteomics. 2013;90:28–37. doi: 10.1016/j.jprot.2013.04.007. [DOI] [PMC free article] [PubMed] [Google Scholar]
- 14.Omenn GS, Guan Y, Menon R. A new class of protein cancer biomarker candidates: Differentially expressed splice variants of ERBB2 (HER2/neu) and ERBB1 (EGFR) in breast cancer cell lines. J. Proteomics. 2014;107:103–112. doi: 10.1016/j.jprot.2014.04.012. [DOI] [PMC free article] [PubMed] [Google Scholar]
- 15.Li H-D, Menon R, Omenn G, Guan Y. The emerging era of genomic data integration for analyzing splice isoform functions. Trends Genet. 2014;30(8):340–347. doi: 10.1016/j.tig.2014.05.005. [DOI] [PMC free article] [PubMed] [Google Scholar]
- 16.Zhu F, Guan Y. Predicting dynamic signaling network response under unseen perturbations. Bioinformatics. 2014;30(19):2772–2778. doi: 10.1093/bioinformatics/btu382. [DOI] [PMC free article] [PubMed] [Google Scholar]
- 17.Zhu F, Shi L, Li H, Eksi R, Engel JD, Guan Y. Modeling dynamic functional relationship networks and application to ex vivo human erythroid differentiation. Bioinformatics. 2014;30(23):3325–3333. doi: 10.1093/bioinformatics/btu542. [DOI] [PMC free article] [PubMed] [Google Scholar]
- 18.Guan Y, Ackert-Bicknell CL, Kell B, Troyanskaya OG, Hibbs MA. Functional genomics complements quantitative genetics in identifying disease-gene associations. PLoS Comput. Biol. 2010;6(11):e1000991. doi: 10.1371/journal.pcbi.1000991. [DOI] [PMC free article] [PubMed] [Google Scholar]
- 19.Guan Y, Gorenshteyn D, Schimenti JC, Handel MA, Hibbs MA, Bult CJ, Troyanskaya O. Tissue-specific functional networks for prioritizing phenotypes and disease genes. PLoS Comput. Biol. 2012;8(9):e1002694. doi: 10.1371/journal.pcbi.1002694. [DOI] [PMC free article] [PubMed] [Google Scholar]
- 20.Guan Y, Myers CL, Lu R, Lemischka IR, Bult CJ, Troyanskaya OG. A genomewide functional network for the laboratory mouse. PLoS Comput. Biol. 2008;4(9):e1000165. doi: 10.1371/journal.pcbi.1000165. [DOI] [PMC free article] [PubMed] [Google Scholar]
- 21.Lesage G, Shapiro J, Specht CA, Sdicu AM, Menard P, Hussein S, Tong AH, Boone C, Bussey H. An interactional network of genes involved in chitin synthesis in Saccharomyces cerevisiae. BMC Genet. 2005;6:8. doi: 10.1186/1471-2156-6-8. [DOI] [PMC free article] [PubMed] [Google Scholar]
- 22.Stelzl U. A human protein-protein interaction network: a resource for annotating the proteome. Cell. 2005;122:957–968. doi: 10.1016/j.cell.2005.08.029. [DOI] [PubMed] [Google Scholar]
- 23.Lee I, Ambaru B, Thakkar P, Marcotte EM, Rhee SY. Rational association of genes with traits using a genome-scale gene network for Arabidopsis thaliana. Nat. Biotechnol. 2010;28(2):149–156. doi: 10.1038/nbt.1603. [DOI] [PMC free article] [PubMed] [Google Scholar]
- 24.Franceschini A, Szklarczyk D, Frankild S, Kuhn M, Simonovic M, Roth A, Lin J, Minguez P, Bork P, von Mering C, Jensen LJ. STRING v9.1: protein-protein interaction networks, with increased coverage and integration. Nucleic Acids Res. 2013;41(D1):D808–D815. doi: 10.1093/nar/gks1094. [DOI] [PMC free article] [PubMed] [Google Scholar]
- 25.Lane L, Bairoch A, Beavis RC, Deutsch EW, Gaudet P, Lundberg E, Omenn GS. Metrics for the Human Proteome Project 2013–2014 and strategies for finding missing proteins. J. Proteome Res. 2014;13(1):15–20. doi: 10.1021/pr401144x. [DOI] [PMC free article] [PubMed] [Google Scholar]
- 26.Omenn GS. The strategy, organization, and progress of the HUPO human proteome project. J. Proteomics. 2014;100:3–7. doi: 10.1016/j.jprot.2013.10.012. [DOI] [PMC free article] [PubMed] [Google Scholar]
- 27.Rodriguez JM, Maietta P, Ezkurdia I, Pietrelli A, Wesselink J-J, Lopez G, Valencia A, Tress ML. APPRIS: annotation of principal and alternative splice isoforms. Nucleic Acids Res. 2013;41(D1):D110–D117. doi: 10.1093/nar/gks1058. [DOI] [PMC free article] [PubMed] [Google Scholar]
- 28.Ezkurdia I, Rodriguez JM, Carrillo-de Santa Pau E, Vazquez J, Valencia A, Tress ML. Most highly expressed protein-coding genes have a single dominant isoform. J. Proteome Res. 2015;14(4):1880–1887. doi: 10.1021/pr501286b. [DOI] [PMC free article] [PubMed] [Google Scholar]
- 29.Li H-D, Menon R, Omenn GS, Guan Y. Revisiting the identification of canonical splice isoforms through integration of functional genomics and proteomics evidence. Proteomics. 2014;14(23–24):2709–2718. doi: 10.1002/pmic.201400170. [DOI] [PMC free article] [PubMed] [Google Scholar]
- 30.Li H-D, Omenn GS, Guan Y. MIsoMine: a genome-scale high-resolution data portal of expression, function and networks at the splice isoform level in the mouse. Database. 2015 doi: 10.1093/database/bav045. [DOI] [PMC free article] [PubMed] [Google Scholar]
- 31.Maron O, Lozano-Perez T. A framework for multiple-instance learning. Adv. Neural Inf Process Syst. 10. 1998;10:570–576. [Google Scholar]
- 32.Andrews S, Tsochantaridis I, Hofmann T. Support vector machines for multiple-instance learning. Adv. Neural Inf. Process Syst. 2003;15 [Google Scholar]
- 33.Dietterich TG, Lathrop RH, Lozano-Perez T. Solving the multiple-instance problem with axis parallel rectangles. Artif. Intell. 1997;89:31–71. 10.1016/S0004-3702(96)00034-3. [Google Scholar]
- 34.Eksi R, Li H-D, Menon R, Wen Y, Omenn GS, Kretzler MK, Guan Y. Systematically differentiating functions for alternatively spliced isoforms through integrating RNA-seq data. PLoS Comput. Biol. 2013;9(11):e1003314. doi: 10.1371/journal.pcbi.1003314. [DOI] [PMC free article] [PubMed] [Google Scholar]
- 35.Li H-D, Liang Y-Z, Xu Q-S. Support vector machines and its applications in chemistry. Chemom. Intell. Lab. Syst. 2009;95(2):188–198. [Google Scholar]
- 36.Burges C. A tutorial on support vector machines for pattern recognition. Data Min. Knowl. Disc. 1998;2(2):121–167. [Google Scholar]
- 37.Noble WS. What is a support vector machine? Nat Biotechnol. 2006;24:1565–1567. doi: 10.1038/nbt1206-1565. [DOI] [PubMed] [Google Scholar]
- 38.Huttenhower C, Troyanskaya OG. Bayesian data integration: a functional perspective. Comput. Syst. Bioinformatics Conf. 2006:341–351. [PubMed] [Google Scholar]
- 39.Ashburner M, Ball CA, Blake JA, Botstein D, Butler H, Cherry JM, Davis AP, Dolinski K, Dwight SS, Eppig JT, Harris MA, Hill DP, Issel-Tarver L, Kasarskis A, Lewis S, Matese JC, Richardson JE, Ringwald M, Rubin GM, Sherlock G. Gene Ontology: tool for the unification of biology. Nat. Genet. 2000;25(1):25–29. doi: 10.1038/75556. [DOI] [PMC free article] [PubMed] [Google Scholar]
- 40.Kanehisa M, Goto S, Kawashima S, Okuno Y, Hattori M. The KEGG resource for deciphering the genome. Nucleic Acids Res. 2004;32:D277–D280. doi: 10.1093/nar/gkh063. [DOI] [PMC free article] [PubMed] [Google Scholar]
- 41.Leinonen R, Sugawara H, Shumway M. The sequence read archive. Nucleic Acids Res. 2011;39:D19–D21. doi: 10.1093/nar/gkq1019. (Database issue) [DOI] [PMC free article] [PubMed] [Google Scholar]
- 42.Patro R, Mount SM, Kingsford C. Sailfish enables alignment-free isoform quantification from RNA-seq reads using lightweight algorithms. Nat. Biotechnol. 2014;32(5):462–464. doi: 10.1038/nbt.2862. [DOI] [PMC free article] [PubMed] [Google Scholar]
- 43.Fisher RA. Frequency distribution of the values of the correlation coefficient in samples of an indefinitely large population. Biometrika. 1915;10(4):507–521. [Google Scholar]
- 44.Chou K-C. Prediction of protein cellular attributes using pseudo-amino acid composition. Proteins: Struct., Funct., Genet. 2001;43(3):246–255. doi: 10.1002/prot.1035. [DOI] [PubMed] [Google Scholar]
- 45.Guerler A, Govindarajoo B, Zhang Y. Mapping monomeric threading to protein-protein structure prediction. J. Chem. Inf. Model. 2013;53(3):717–725. doi: 10.1021/ci300579r. [DOI] [PMC free article] [PubMed] [Google Scholar]
- 46.Marchler-Bauer A, Derbyshire MK, Gonzales NR, Lu S, Chitsaz F, Geer LY, Geer RC, He J, Gwadz M, Hurwitz DI, Lanczycki CJ, Lu F, Marchler GH, Song JS, Thanki N, Wang Z, Yamashita RA, Zhang D, Zheng C, Bryant SH. CDD: NCBI’s conserved domain database. Nucleic Acids Res. 2015;43(D1):D222–D226. doi: 10.1093/nar/gku1221. [DOI] [PMC free article] [PubMed] [Google Scholar]
- 47.Finn RD, Bateman A, Clements J, Coggill P, Eberhardt RY, Eddy SR, Heger A, Hetherington K, Holm L, Mistry J, Sonnhammer EL, Tate J, Punta M. Pfam: the protein families database. Nucleic Acids Res. 2014;42:D222–D230. doi: 10.1093/nar/gkt1223. (Database issue) [DOI] [PMC free article] [PubMed] [Google Scholar]
- 48.Punta M, Coggill PC, Eberhardt RY, Mistry J, Tate J, Boursnell C, Pang N, Forslund K, Ceric G, Clements J, Heger A, Holm L, Sonnhammer EL, Eddy SR, Bateman A, Finn RD. The Pfam protein families database. Nucleic Acids Res. 2012;40(D1):D290–D301. doi: 10.1093/nar/gkr1065. [DOI] [PMC free article] [PubMed] [Google Scholar]
- 49.Letunic I, Doerks T, Bork P. SMART 7: recent updates to the protein domain annotation resource. Nucleic Acids Res. 2012;40(D1):D302–D305. doi: 10.1093/nar/gkr931. [DOI] [PMC free article] [PubMed] [Google Scholar]
- 50.Zhang P, Dufresne C, Ferri S, Venkatraman V, Karani R, Lutty GA, Van Eyk JE, Semba RD, Turner R. The proteome of human retina. Proteomics. 2015;15(4):836–840. doi: 10.1002/pmic.201400397. [DOI] [PMC free article] [PubMed] [Google Scholar]
- 51.Omenn GS, Yocum AK, Menon R. Alternative splice variants, a new class of protein cancer biomarker candidates: findings in pancreatic cancer and breast cancer with systems biology implications. Dis. Markers. 2010;28(4):241–251. doi: 10.3233/DMA-2010-0702. [DOI] [PMC free article] [PubMed] [Google Scholar]
- 52.Djebali S, Davis CA, Merkel A, Dobin A, Lassmann T, Mortazavi A, Tanzer A, Lagarde J, Lin W, Schlesinger F, Xue CH, Marinov GK, Khatun J, Williams BA, Zaleski C, Rozowsky J, Roder M, Kokocinski F, Abdelhamid RF, Alioto T, Antoshechkin I, Baer MT, Bar NS, Batut P, Bell K, Bell I, Chakrabortty S, Chen X, Chrast J, Curado J, Derrien T, Drenkow J, Dumais E, Dumais J, Duttagupta R, Falconnet E, Fastuca M, Fejes-Toth K, Ferreira P, Foissac S, Fullwood MJ, Gao H, Gonzalez D, Gordon A, Gunawardena H, Howald C, Jha S, Johnson R, Kapranov P, King B, Kingswood C, Luo OJ, Park E, Persaud K, Preall JB, Ribeca P, Risk B, Robyr D, Sammeth M, Schaffer L, See LH, Shahab A, Skancke J, Suzuki AM, Takahashi H, Tilgner H, Trout D, Walters N, Wang H, Wrobel J, Yu YB, Ruan XA, Hayashizaki Y, Harrow J, Gerstein M, Hubbard T, Reymond A, Antonarakis SE, Hannon G, Giddings MC, Ruan YJ, Wold B, Carninci P, Guigo R, Gingeras TR. Landscape of transcription in human cells. Nature. 2012;489(7414):101–108. doi: 10.1038/nature11233. [DOI] [PMC free article] [PubMed] [Google Scholar]
Associated Data
This section collects any data citations, data availability statements, or supplementary materials included in this article.