

Abstract
Purpose
To determine if hyperreflective foci (HF) and macular thickness on spectral domain ocular coherence tomography (SD-OCT) are associated with lipid levels in type 2 diabetes (T2D) patients.
Methods
238 participants from four sites had fundus photographs and SD-OCT images graded for hard exudates (HE) and HF, respectively. Regression models were used to determine the association between serum lipid levels and (1) presence of HF and HE and (2) central subfield macular thickness (CSMT), central subfield macular volume (CSMV) and total macular volume (TMV).
Results
All patients with HE on fundus photographs had corresponding HF on SD-OCT but 57% of patients with HF on OCT did not have HE detected in their fundus photographs. Presence of HF was associated with higher total cholesterol [(odds ratio (OR) = 1.13, 95% confidence interval (CI) = 1.01-1.27, P = 0.03] and higher low density lipoprotein (LDL) levels (OR = 1.17, 95% CI = 1.02-1.35, P = 0.02) in models adjusting for other risk factors. The TMV was also associated with higher total cholesterol (p = 0.009) and triglyceride (p = 0.02) levels after adjusting for other risk factors.
Conclusion
Higher total and LDL cholesterol were associated with presence of HF on SD-OCT. TMV was associated with higher total cholesterol and triglyceride levels.
Keywords: Hard exudate, hyperreflective foci, optical coherence tomography, diabetic retinopathy, type 2 diabetes
Introduction
Retinal hard exudates are seen often in eyes with diabetic retinopathy. The hard exudates are composed of lipid and proteinaceous material, such as fibrinogen and albumin that leak from the impaired blood–retinal barrier. They are deposited primarily in the outer plexiform layer of the retina.1-3 With optical coherence tomography (OCT), hard exudates are observed as hyperreflective foci.1 In some cases, these hyperreflective foci may be seen without any corresponding hard exudate on fundoscopic examination. Comparison with histology suggests that these foci may represent subclinical features of lipoprotein extravasation after breakdown of the inner blood–retina barrier in the initial stages of intraretinal hard exudate development.4 Ota et al demonstrated subretinal hyperreflective foci on spectral domain OCT (SD-OCT) in patients with diabetic macular edema (DME) may be associated with the future subfoveal deposition of hard exudates.5 SD-OCT may provide an imaging technique to detect these early manifestations of diabetic retinopathy and macular edema and to elucidate the pathophysiology of extravasation and formation of retinal edema and hard exudates.
Data from the Early Treatment of Diabetic Retinopathy Study (ETDRS) and other studies have demonstrated that elevated serum lipid levels are associated with an increased risk of hard exudate in eyes with diabetic retinopathy. Furthermore, increasing amounts of exudate seem to be associated independently with an increased risk of visual impairment.6 This indicates a correlation between serum lipid levels and the development of hard exudates and intraretinal damage.4 Prior studies have evaluated the association the hard exudates and lipid serum levels based on fundus photograph detection of exudates.6-9
The purpose of this study was to investigate whether higher serum lipid levels were associated with presence of hyperreflective foci on SD-OCT and macular thickness parameters. We also characterized these hyperreflective foci, which can represent either subclinical hard exudates or clinically apparent hard exudates, with regards to retinal layer location and correlation with presence of hard exudates on fundus photographs.
Materials and Methods
Participants
The African American Proliferative Diabetic Retinopathy (AAPDR) study is a multicenter, case control study.10 From 2011 to 2013, American African patients with type 2 diabetes were recruited from four sites: the University of Mississippi Medical Center (UMMC), Massachusetts Eye and Ear Infirmary (MEEI), Boston Medical Center (BMC) and Harvard Vanguard Medical Associates (HVMA) and their clinical characteristics have been previously described.10 This research adhered to the tenets of the Declaration of Helsinki and was approved by institutional reviews boards of the UMMC, BMC and MEEI.
Inclusion criteria for study were: (1) self-identified African American race and (2) diagnosis of type 2 diabetes by American Diabetes Association criteria 11 and onset of diabetes at greater than or equal to 30 years old. All patients with fundus photos and OCTs of sufficient quality for hard exudate and hyperreflective foci evaluation were included in the analysis. Patients with evidence of traction retinal detachment, epiretinal membrane, preretinal or subretinal hemorrhage, vitreomacular traction and atrophic scarring in the macula were excluded.
Assessment of hard exudate and hyperreflective foci in fundus photographs and OCT
Dilated, digital seven-standard field fundus photography of both eyes, including a pair of stereoscopic photographs of each macula, was obtained using a Topcon TRC 50 DX camera (Topcon, Tokyo, Japan). The photographs were graded for presence of hard exudates and degree of diabetic retinopathy by two independent, masked ophthalmologist-investigators using the ETDRS adaptation of the modified Airlie House classification as previously described.10 Any disagreements were arbitrated by a third ophthalmologist-investigator.
OCT imaging was performed with Spectralis SD-OCT (Heidelberg, Carlsbad, CA). Fovea-centered images were acquired (25 lines within a 20-degree horizontal scan and 25 lines within a 20-degree vertical scan). Every horizontal and vertical OCT line scan was assessed for the presence of hyperreflective foci due to hard exudate by a single ophthalmologist-investigator. For cases where the investigator was uncertain of the presence of hyperreflective foci, a decision was reached after review of the images with a second-ophthalmologist investigator. There were no minimum or maximum size criteria for the foci. Since hyperreflective foci can be due to presence of entities other than hard exudates, each OCT image with a hyperreflective focus was overlaid on the corresponding red-free image and a corresponding high quality fundus photograph was placed next to the overlay to rule out other causes of hyperreflectivity (Figure 1).4, 12, 13 More specifically, when a hyperreflective focus was identified on an OCT line scan, it was overlaid on the red-free image that is available for tracking on the Heidelberg Spectralis device using the device’s software. At the same time, the investigator looked at a high quality fundus photograph that was placed on the adjacent computer monitor. The region of interest was visually inspected on the red-free and color photograph for other pathologies. Vessels could be easily seen and excluded on the red-free images. For other pathologies, anatomical landmarks (primarily the retinal vessels) were used to identify the area of interest on the color photograph and inspect it for corresponding vessels, hemorrhages, cotton wool spots, microaneurysms, nerve fiber layer demyelination, or fibrovascular tissue. If any of these were found to account for the hyperreflective foci, these foci were excluded from the analyses. If there was shadowing behind a hyperreflective focus, we looked particularly carefully for corresponding hemorrhage or blood vessels on the red-free and color fundus photographs. If we did not find hemorrhage or vessels, we included that focus in the analysis. If the hyperreflective focus was a complete or incomplete ring or if the hyperreflective focus was adjacent to a cyst, it was excluded from further analyses as these are characteristics have been associated with microaneurysms.13 For the hyperreflective foci that were included in the analyses, the retinal layer in which they were located was recorded. The assessment of hyperreflective foci was done for research purposes only; the detection of hyperreflective foci was not communicated to the patients’ treating retina specialists and thus did not influence their management.
Figure 1.
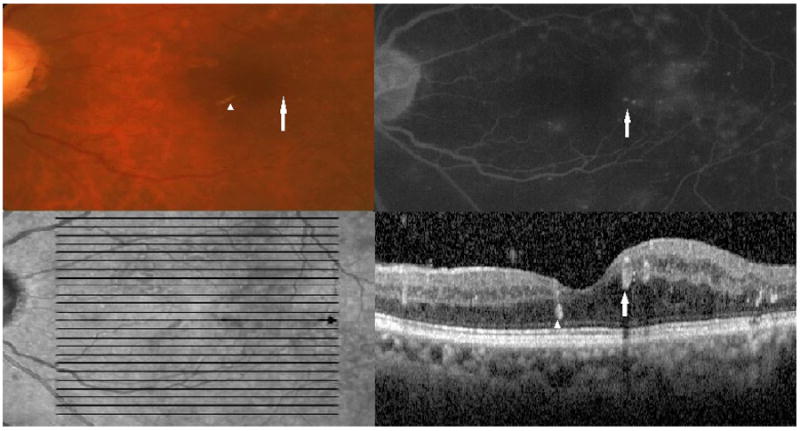
Top left: Color fundus photograph showing a microaneurysm (white arrow) and hard exudates (white arrowhead) (Top left). Top right: Late-phase fluorescein angiography shows leakage from the microaneurysm (white arrow). Bottom left: An infrared image shows the horizontal optical coherence tomography section (bold black arrow) through which the image in the bottom panel was obtained (bold black arrow). Bottom right: Optical coherence tomography image through the indicated section in the infrared image shows a hyperreflective focus that corresponds to the hard exudates on fundus photography (white arrowhead) and a ring-shaped hyperreflective region (white arrow) that corresponds to the microaneurysm.
To determine intra-observer reliability of hyperreflective foci grading, 50 randomly-sampled images were regraded for total hyperreflective foci by the same reader three months after the initial grading. The kappa test for intra-observer agreement for hyperreflective foci detection was 0.975 indicating the method to be highly reproducible.
Assessment of macular thickness and volumes
SD-OCT images were evaluated for central subfield macular thickness (CSMT), central subfield macular volume (CSMV) and total macular volume (TMV). The presumed foveal center was determined as the area lacking inner retinal layers in the macular region. A horizontal foveal scan image was used to record these three measurements: CSMT and CSMV within the central 1 mm-diameter circle surrounding the fovea and TMV within the central 6 mm-diameter circle surrounding the fovea.
Covariate Data
The covariates examined in this study were age, gender, site of recruitment, duration of diabetes, hemoglobin A1C (HbA1C), systolic blood pressure (BP), ETDRS diabetic retinopathy grade, total cholesterol, low density lipoprotein (LDL) cholesterol, high density lipoprotein (HDL) cholesterol, triglycerides, use of lipid-lowering medication and use of anti-hypertensive medication. Duration of diabetes was verified by review of the medical record. For each participant, a blood sample was sent for HbA1c measurement at a centralized laboratory. One set of fasting lipid levels [total, LDL, and HDL cholesterol and triglycerides] closest to the study visit but within one year of the study visit was recorded from the medical record.
Statistical Analyses
For the statistical analyses, only one eye from each patient was used. If only one eye of a patient had hyperreflective foci, that eye was included in the analyses. If both eyes had hyperreflective foci, the eye with greater macular thickness was included. For the statistical analyses, duration of diabetes, HbA1c, mean systolic BP, ETDRS grade, serum fasting total cholesterol, HDL cholesterol, LDL cholesterol, triglycerides, CSMT, CSMV and TMV were evaluated as continuous variables for maximal power. Presence of HE and hyperreflective foci were evaluated as dichotomous variables. In addition to determining the associations between serum lipids and macular thickness and hyperreflective foci, we also compared the presence of hard exudates on fundus photographs with the presence of hyperreflective foci on SD-OCT.
For all analyses, we used the subset of participants with complete information for the covariate of interest in that particular analysis to maximize the generalizability and power of the analysis. For the univariate analyses examining presence of hyperreflective foci as an outcome, we performed the independent sample t-test for continuous variables and the chi-square test for dichotomous variables. For the univariate analyses examining CSMT, CSMV and TMV as outcomes, we performed univariate analyses with Pearson’s correlation coefficient test for continuous variables. The full models for each outcome (presence of hyperreflective foci, CSMT, CSMV and TMV) were built with logistic or linear regression. All regression models included age, gender, and recruitment site as well as any covariates that were significantly associated with the outcome in the univariate analyses. All analyses were performed using Stata/IC 12.1 (College Station, TX). A P value < 0.05 was considered statistically significant.
Results
238 patients with OCTs and fundus photographs were included in the analyses. 31.1% had hard exudates in at least one eye, while 70% had hyperreflective foci on OCT in at least one eye. All the patients with hard exudates on fundus photographs had hyperreflective foci on OCT but 57% of patients with hyperreflective foci on OCT did not have hard exudates, or any other pathology, detected in the corresponding area on their fundus photographs. Table 1 summarizes the clinical characteristics of patients with and without hyperreflective foci. Participants with hyperreflective foci had a longer duration of diabetes, higher mean HbA1c, higher mean systolic blood pressure and higher mean ETDRS grade. The hyperreflective foci were identified in every retinal layer in at least some patients (Table 2). The outer plexiform layer was the most common layer to have hyperreflective foci. 30% of patients with hyperreflective foci also had center-involving DME defined as a CSMT > 305 μm in women and > 320 μm in men.14 The remainder of the patients had hyperreflective foci in the absence of macular edema.
Table 1.
Clinical characteristics of participants with and without hyperreflective foci
| Hyperreflective foci present | No hyperreflective foci present | ||||
|---|---|---|---|---|---|
|
| |||||
| Variables | N | % or Mean ± SD | N | % or Mean ± SD | P value* |
|
| |||||
| Age, years | 167 | 60.5 ± 11.6 | 71 | 62 ± 9.6 | 0.37 |
|
| |||||
| Sex (Male %) | 167 | 38.3% | 71 | 40.8% | 0.77 |
|
| |||||
| Duration of Diabetes (Year) | 167 | 21 ± 10.2 | 71 | 17.6 ± 9.2 | 0.01 |
|
| |||||
| Hemoglobin A1C (%) | 166 | 8.5 ± 2 | 71 | 7.9 ± 1.8 | 0.03 |
|
| |||||
| Systolic Blood Pressure (mmHg) | 167 | 149.7 ± 22.9 | 71 | 140.6 ± 21.8 | 0.005 |
|
| |||||
| Lipid-lowering Medication (% Taking) | 167 | 59.5% | 71 | 72.8% | 0.055 |
|
| |||||
| Anti-hypertensive Medication (% Taking) | 167 | 90.1% | 71 | 91.4% | 1.0 |
|
| |||||
| Total Cholesterol (mg/dl) | 166 | 182.5 ± 52 | 71 | 165.4 ± 37 | 0.018 |
|
| |||||
| Low Density Cholesterol (mg/dl) | 162 | 105.2 ± 46.7 | 70 | 90.3 ± 29.7 | 0.014 |
|
| |||||
| High Density Cholesterol (mg/dl) | 165 | 51.3 ± 18.4 | 70 | 49.2 ± 17.3 | 0.41 |
|
| |||||
| Triglyceride (mg/dl) | 162 | 134 ± 82 | 70 | 133.4 ± 68.5 | 0.95 |
|
| |||||
| ETDRS grade (% in each category): | 164 | 71 | 1 × 10⁻⁶ | ||
| <15 | 3.1% | 60.5 % | |||
| 15-60 | 4.3% | 15.5 % | |||
| >60 | 92.6% | 24 % | |||
SD= Standard deviation, ETDRS=Early Treatment Diabetic Retinopathy Study
Categorical variables compared using the chi square test, and continuous variables compared with the t-test.
Table 2.
Retinal layer distribution of hyperreflective foci
| Retinal Layer | Percent of Patients with Hyperreflective Foci in this Layer |
|---|---|
| NFL | 29 |
| GCL | 37.1 |
| IPL | 52.5 |
| INL | 85 |
| OPL | 92.7 |
| ONL | 84.6 |
| ELM | 53.3 |
| EL | 26.3 |
| Subretinal | 7.3 |
NFL = Nerve fiber Layer, GCL = Ganglion Cell Layer, IPL= Inner Plexiform Layer, INL = Inner Nuclear Layer, OPL = Outer Plexiform Layer, ONL = Outer Nuclear Layer, ELM = External Limiting Membrane and EL = Ellipsoid Layer
Table 3 shows the results of the univariate and multivariate analyses examining the association between serum lipids levels and presence of hyperreflective foci. In the univariate analyses, presence of hyperreflective foci was associated with higher total cholesterol levels [(odds ratio (OR) =1.08, 95% confidence interval (CI) = 1.01-1.15, P = 0.02]. In the multivariate model, after controlling for other retinopathy risk factors, higher total cholesterol was still significantly associated with hyperreflective foci (OR = 1.13, 95% CI = 1.01-1.27, P = 0.03). Higher LDL was also associated with presence of hyperreflective foci in the univariate analysis (OR = 1.10, 95% CI = 1.01-1.19, P = 0.02) and the association was significant after adjusting for other risk factors (OR = 1.17, 95% CI = 1.02-1.35, P = 0.02). Neither HDL cholesterol nor triglycerides were associated with presence of hyperreflective foci.
Table 3.
Association between serum lipid levels and hyperreflective foci
| Univariate | Multivariate* | |||
|---|---|---|---|---|
| OR (95 % CI) | P value | OR (95 % CI) | P value | |
| Total Cholesterol (per 10 mg/dl) | 1.08 (1.01-1.15) | 0.02 | 1.13 (1.01-1.27) | 0.03 |
| Low Density Cholesterol (per 10 mg/dl) | 1.10 (1.01-1.19) | 0.02 | 1.17 (1.02-1.35) | 0.02 |
| High Density Cholesterol (per 10 mg/dl) | 1.07 (0.90-1.26) | 0.41 | 1.03 (0.80-1.32) | 0.79 |
| Triglyceride (per 10 mg/dl) | 1.00 (0.96-1.03) | 0.95 | 1.009 (0.95-1.06) | 0.73 |
adjusted for age, gender, diabetes duration, hemoglobin A1C, diabetic retinopahy grade, systolic blood pressure and site.
OR = odds ratio, CI = confidence interval
We performed the univariate and multivariate analyses examining the association between serum lipids levels and presence of hard exudates on fundus photography in the same 238 patients. In the univariate analyses, presence of hard exudates was associated with higher total cholesterol levels (OR =1.07, 95% CI = 1.01-1.13, P = 0.009). In the multivariate model, after controlling for other retinopathy risk factors, higher total cholesterol was still significantly associated with presence of exudates (OR = 1.07, 95% CI = 1.003-1.14, P = 0.04). Higher LDL was also associated with presence of hard exudates in the univariate analysis (OR = 1.10, 95% CI = 1.03-1.18, P = 0.003) and the association was significant after adjusting for other risk factors (OR = 1.09, 95% CI = 1.01-1.19, P = 0.02). Neither HDL cholesterol nor triglycerides were associated with presence of retinal hard exudates.
In the analyses of lipid serum levels and CSMT, CSMV and TMV, we found a significant correlation between TMV and higher total cholesterol and triglyceride levels. Table 4 shows the results of the univariate and multivariate analyses examining the association between serum lipids levels and TMV. In the univariate analyses, higher TMV was associated with higher total cholesterol levels (Pwcorr = 0.2, P = 0.006). In the multivariate model, after controlling for other retinopathy risk factors, higher total cholesterol was still significantly associated with higher TMV (Coef = 0.004, 95%CI = 0.001-0.007, P = 0.009). Higher LDL and triglyceride levels were also associated with higher TMV in the univariate analyses (Pwcorr = 0.16, P=0.03 and Pwcorr = 0.17, P = 0.02, respectively). In the multivariate model, after controlling for other retinopathy risk factors, higher triglyceride levels were still significantly associated with higher TMV (Coef = 0.002, 95% CI = 0.0002-0.003, P = 0.02). The association was no longer significant for higher LDL when adjusting for other risk factors (Coef = 0.003, 95% CI = -0.0003 - 0.007, P = 0.07). HDL cholesterol was not associated with higher TMV.
Table 4.
Correlation of serum lipid levels and total macular volume
| Univariate | Multivariate* | |||
|---|---|---|---|---|
| Pwcorr | P value | Coef (95% CI) | P value | |
| Total Cholesterol (per 1 mg/dl) | 0.20 | 0.006 | 0.004 (0.001-0.007) | 0.009 |
| Low Density Cholesterol (per 1 mg/dl) | 0.16 | 0.03 | 0.003 (-0.0003-0.007) | 0.07 |
| High Density Cholesterol (per 1 mg/dl) | 0.04 | 0.58 | 0.001 (-0.0058-0.0086) | 0.70 |
| Triglyceride (per 1 mg/dl) | 0.17 | 0.02 | 0.002 (0.0002-0.0034) | 0.02 |
adjusted for age, gender, diabetes duration, hemoglobin A1C, diabetic retinopathy grade, systolic blood pressure and site.
Pwcorr = Pearson correlation coefficient, Coef = linear regression coefficient; CI = confidence interval
Discussion
This investigation has found that higher total and LDL cholesterol levels were associated with presence of hyperreflective foci on SD-OCT after adjusting for other diabetic retinopathy risk factors as well as for the degree of diabetic retinopathy. We found similar associations between lipid serum levels and presence of hard exudates on fundus photographs in these same patients.
Previous studies have suggested that distinct hyperreflective foci associated with DME represent subclinical initial steps in the development of intraretinal hard exudates, including subclinical lipid deposits, lipid-laden macrophages, or proteinaceous material.4, 5, 15 Our study provides additional evidence to support this hypothesis, both in the presence and absence of DME. However, for the instances where there is no corresponding pathology on fundus photographs, we cannot prove that these foci are indeed subclinical hard exudates based on the cross-sectional data set in this study. Longitudinal studies that follow these subclinical hyperreflective foci to determine whether they evolve into clinically evident hard exudates are required.
This is the first study to determine the correlation between serum lipid levels and hyperreflective foci. All the studies performed in the past to assess the association between hard exudates and lipid levels have been done based on the quantitative or qualitative grading of hard exudates visible on examination or fundus photographs.6-9, 16-22 Several studies, including the Wisconsin Epidemiology Study of Diabetic Retinopathy (WESDR), have found associations between higher total or/and LDL cholesterol levels and hard exudate presence in fundus photographs similar to what we find in the present study.6, 7, 9, 16-21 However, there have been other studies that have not found an association between hard exudates and total 7, 16, 21 and LDL20, 21 cholesterol. We found that 57% of T2D patients with hyperreflective foci on SD-OCT had no hard exudates on fundus photographs. This suggests that some patients in prior studies who did not have hard exudates on fundus photography could have had early exudates detectable as hyperreflective foci on SD-OCT. SD-OCT hyperreflective foci, which can be less than 25-30 μm in diameter, appear to be a more sensitive measure of cholesterol deposition in the retina. Results between studies examining the influence of systemic metabolic risk factors on retinal exudate deposition may be more consistent when these foci are examined as the outcome instead of clinically apparent hard exudates.
The clinical impact of these hyperreflective foci remains to be determined. One previous study in 19 patients suggested that these hyperreflective foci may be predictive of future deposition of ophthalmoscopically-visible hard exudates.5 Two other studies, one in 51 patients and the other in 24 patients, found that these hyperreflective foci change in distribution and diminish in amount after intravitreal anti-vascular endothelial growth factor therapy.23, 24 Another study found no relationship between visual acuity and hyperreflecive foci consistent with hard exudate in patients with different stages of diabetic retinopathy.25 Larger longitudinal studies are needed to determine whether control of serum lipid levels and other clinical interventions can lead to a decrease in the number of hyperreflective foci and subsequent hard exudate deposition on fundus examination. Such longitudinal studies are also needed to determine if these hyperreflective foci are a clinically relevant, early marker of diabetic retinopathy that can be used as an endpoint in research studies.
In addition to the association between serum lipid levels and presence of hyperreflective foci, we also found that higher total cholesterol was associated with higher TMV in T2D. While there have been several studies that have examined the association between serum lipids and DME as graded on fundus photographs,6, 7, 20, 26, 27 there have been very few studies using the more sensitive and clinically-used parameter of SD-OCT macular thickness. Benarous et al. found no associations between serum lipids and CSMT or CSMV as measured using time-domain OCT in 321 patients with various stages of diabetic retinopathy, although they found a significant association with funduscopically-assessed clinically significant macular edema.26 Sasaki et al. showed higher LDL cholesterol levels were associated with increased CSMT and CSMV in 74 diabetic patients without DME.28 Like Benarous et al, we did not find any association between lipid levels and CSMT or CSMV, the two most commonly used measures of macular thickness in clinical studies of DME. CSMT and CSMV are the most clinically significant for visual acuity outcomes because they capture thickening in the central 1 mm of the macula. However, microvascular damage in diabetic retinopathy and DME can often begin outside of the central 1 mm of the macula. We chose to examine TMV as well because it estimates the macular volume for the central 6 mm and thus is a more global assessment of macular thickening. By using this broader measure of macular edema, we were able to detect an association with total cholesterol and triglyceride levels consistent with what other studies have found with macular edema as graded on fundus photographs.
Most previous OCT studies and systematic reviews have reported that the hyperreflective foci that correlate to hard exudates are primarily found in the outer retina in diabetic retinopathy,1, 2,29 but we found them in all the retinal layers even after carefully excluding hyperreflective foci due to other pathologies by overlying OCT and fundus photographs. Bloz et al also reported that the distinct hyperreflective foci associated with DME could be found scattered throughout all retinal layers.4 Our study is also the first to systematically report the percent of patients with hyperreflective foci in each retinal layer. We found the outer plexiform layer is the most commonly involved layer and the likelihood of finding hyperreflective foci in a given layer decreased as distance from the outer plexiform layer increased. This is consistent with histopathologic studies of hard exudates.3, 15, 30
The strengths of this study include the large sample of diabetic patients with various degrees of retinopathy and the careful assessment of OCT images with fundus photograph correlation to exclude other pathologies that can appear as hyperreflective foci. The population studied was relatively homogenous; all patients were of the same race and all had type 2 diabetes. However, there are limitations to our study. First, the cross-sectional nature of the study does not allow us to assess the temporal sequence of these associations. Second, in spite of overlaying fundus photographs on the OCT images to exclude non-micro exudate pathologies, it is still possible that we misclassified some hyperreflective foci as being micro hard exudates when they in fact represented other retinal pathologies such tiny hemorrhages that were not visible on fundus photographs.12
In summary, presence of macular hyperreflective foci in patients with T2D is associated with higher total and LDL cholesterol. As newer OCT technologies are developed to measure the extent of hyperreflective foci secondary DME in an automated fashion,31 the clinical utility of this OCT characteristic for predicting progression of retinopathy will become clearer and may help us to counsel and treat patients at an earlier stage in their disease process more effectively.
Acknowledgments
Financial Support:
Funding: American Diabetes Association Clinical Translational Research Award 1-11-CT-51, Alexandria, VA; NEI K12-EY16335, Bethesda, MD; Research to Prevent Blindness Career Development Award and William & Mary Greve Special Scholar Award, New York City, NY; Harvard Catalyst | The Harvard Clinical and Translations Science Center Faculty Fellowship, Boston, MA; Massachusetts Lions Eye Research Fund, Abington, MA; Eleanor and Miles Shore Fellowship, Boston, MA; Sara Elizabeth O’Brien Trust, Boston, MA.
Footnotes
None of the authors have any proprietary interests or conflicts of interest related to this submission.
This submission has not been published anywhere previously and is not simultaneously being considered for any other publication.
References
- 1.Otani T, Kishi S. Tomographic findings of foveal hard exudates in diabetic macular edema. American journal of ophthalmology. 2001;131:50–54. doi: 10.1016/s0002-9394(00)00661-9. [DOI] [PubMed] [Google Scholar]
- 2.Takagi H, et al. New surgical approach for removing massive foveal hard exudates in diabetic macular edema. Ophthalmology. 1999;106:249–256. doi: 10.1016/S0161-6420(99)90054-4. discussion 256-247. [DOI] [PubMed] [Google Scholar]
- 3.Cusick M, et al. Histopathology and regression of retinal hard exudates in diabetic retinopathy after reduction of elevated serum lipid levels. Ophthalmology. 2003;110:2126–2133. doi: 10.1016/j.ophtha.2003.01.001. [DOI] [PubMed] [Google Scholar]
- 4.Bolz M, et al. Optical coherence tomographic hyperreflective foci: a morphologic sign of lipid extravasation in diabetic macular edema. Ophthalmology. 2009;116:914–920. doi: 10.1016/j.ophtha.2008.12.039. [DOI] [PubMed] [Google Scholar]
- 5.Ota M, et al. Optical coherence tomographic evaluation of foveal hard exudates in patients with diabetic maculopathy accompanying macular detachment. Ophthalmology. 2010;117:1996–2002. doi: 10.1016/j.ophtha.2010.06.019. [DOI] [PubMed] [Google Scholar]
- 6.Chew EY, et al. Association of elevated serum lipid levels with retinal hard exudate in diabetic retinopathy. Early Treatment Diabetic Retinopathy Study (ETDRS) Report 22. Archives of ophthalmology. 1996;114:1079–1084. doi: 10.1001/archopht.1996.01100140281004. [DOI] [PubMed] [Google Scholar]
- 7.Sasaki M, et al. Quantitative measurement of hard exudates in patients with diabetes and their associations with serum lipid levels. Invest Ophthalmol Vis Sci. 2013;54:5544–5550. doi: 10.1167/iovs.13-11849. [DOI] [PubMed] [Google Scholar]
- 8.Sachdev N, Sahni A. Association of systemic risk factors with the severity of retinal hard exudates in a north Indian population with type 2 diabetes. Journal of postgraduate medicine. 2010;56:3–6. doi: 10.4103/0022-3859.62419. [DOI] [PubMed] [Google Scholar]
- 9.Roy MS, Klein R. Macular edema and retinal hard exudates in African Americans with type 1 diabetes: the New Jersey 725. Archives of ophthalmology. 2001;119:251–259. [PubMed] [Google Scholar]
- 10.Penman AHH, Papavasileiou E, James M, Idowu O, Riche DM, Fernandez M, Brauner S, Smith SO, Hoadley S, Richardson C, Vazquez V, Chi C, Andreoli C, Husain D, Chen CJ, Sobrin L. Risk factors for proliferative diabetic retinopathy in African Americans with type 2 diabetes. Ophthalmic Epidemiol. 2015 doi: 10.3109/09286586.2015.1119287. In Press. [DOI] [PMC free article] [PubMed] [Google Scholar]
- 11.Report of the expert committee on the diagnosis and classification of diabetes mellitus. Diabetes care. 2003;26(Suppl 1):S5–20. doi: 10.2337/diacare.26.2007.s5. [DOI] [PubMed] [Google Scholar]
- 12.Al-Mujaini A, Wali UK, Azeem S. Optical coherence tomography: clinical applications in medical practice. Oman Med J. 2013;28:86–91. doi: 10.5001/omj.2013.24. [DOI] [PMC free article] [PubMed] [Google Scholar]
- 13.Horii T, et al. Optical coherence tomographic characteristics of microaneurysms in diabetic retinopathy. American journal of ophthalmology. 2010;150:840–848. doi: 10.1016/j.ajo.2010.06.015. [DOI] [PubMed] [Google Scholar]
- 14.Chalam KV, et al. Retinal thickness in people with diabetes and minimal or no diabetic retinopathy: Heidelberg Spectralis optical coherence tomography. Invest Ophthalmol Vis Sci. 2012;53:8154–8161. doi: 10.1167/iovs.12-10290. [DOI] [PMC free article] [PubMed] [Google Scholar]
- 15.Murata T, Ishibashi T, Inomata H. Immunohistochemical detection of extravasated fibrinogen (fibrin) in human diabetic retina. Graefes Arch Clin Exp Ophthalmol. 1992;230:428–431. doi: 10.1007/BF00175927. [DOI] [PubMed] [Google Scholar]
- 16.Klein R, et al. The association of atherosclerosis, vascular risk factors, and retinopathy in adults with diabetes : the atherosclerosis risk in communities study. Ophthalmology. 2002;109:1225–1234. doi: 10.1016/s0161-6420(02)01074-6. [DOI] [PubMed] [Google Scholar]
- 17.Klein R, et al. The relation of atherosclerotic cardiovascular disease to retinopathy in people with diabetes in the Cardiovascular Health Study. The British journal of ophthalmology. 2002;86:84–90. doi: 10.1136/bjo.86.1.84. [DOI] [PMC free article] [PubMed] [Google Scholar]
- 18.van Leiden HA, et al. Blood pressure, lipids, and obesity are associated with retinopathy: the hoorn study. Diabetes care. 2002;25:1320–1325. doi: 10.2337/diacare.25.8.1320. [DOI] [PubMed] [Google Scholar]
- 19.Miljanovic B, et al. A prospective study of serum lipids and risk of diabetic macular edema in type 1 diabetes. Diabetes. 2004;53:2883–2892. doi: 10.2337/diabetes.53.11.2883. [DOI] [PubMed] [Google Scholar]
- 20.Idiculla J, et al. Serum lipids and diabetic retinopathy: A cross-sectional study. Indian journal of endocrinology and metabolism. 2012;16:S492–494. doi: 10.4103/2230-8210.104142. [DOI] [PMC free article] [PubMed] [Google Scholar]
- 21.Klein BE, et al. The Wisconsin Epidemiologic Study of Diabetic Retinopathy. XIII. Relationship of serum cholesterol to retinopathy and hard exudate. Ophthalmology. 1991;98:1261–1265. doi: 10.1016/s0161-6420(91)32145-6. [DOI] [PubMed] [Google Scholar]
- 22.Ucgun NI, et al. The importance of serum lipids in exudative diabetic macular edema in type 2 diabetic patients. Annals of the New York Academy of Sciences. 2007;1100:213–217. doi: 10.1196/annals.1395.021. [DOI] [PubMed] [Google Scholar]
- 23.Framme C, et al. Behavior of SD-OCT-detected hyperreflective foci in the retina of anti-VEGF-treated patients with diabetic macular edema. Invest Ophthalmol Vis Sci. 2012;53:5814–5818. doi: 10.1167/iovs.12-9950. [DOI] [PubMed] [Google Scholar]
- 24.Pemp B, et al. Distribution of intraretinal exudates in diabetic macular edema during anti-vascular endothelial growth factor therapy observed by spectral domain optical coherence tomography and fundus photography. Retina. 2014;34:2407–2415. doi: 10.1097/IAE.0000000000000250. [DOI] [PubMed] [Google Scholar]
- 25.Sun JK, et al. Neural Retinal Disorganization as a Robust Marker of Visual Acuity in Current and Resolved Diabetic Macular Edema. Diabetes. 2015;64:2560–2570. doi: 10.2337/db14-0782. [DOI] [PMC free article] [PubMed] [Google Scholar]
- 26.Benarous R, et al. Differential association of serum lipids with diabetic retinopathy and diabetic macular edema. Invest Ophthalmol Vis Sci. 2011;52:7464–7469. doi: 10.1167/iovs.11-7598. [DOI] [PubMed] [Google Scholar]
- 27.Raman R, et al. Influence of serum lipids on clinically significant versus nonclinically significant macular edema: SN-DREAMS Report number 13. Ophthalmology. 2010;117:766–772. doi: 10.1016/j.ophtha.2009.09.005. [DOI] [PubMed] [Google Scholar]
- 28.Sasaki M, et al. Association of serum lipids with macular thickness and volume in type 2 diabetes without diabetic macular edema. Invest Ophthalmol Vis Sci. 2014;55:1749–1753. doi: 10.1167/iovs.13-13035. [DOI] [PubMed] [Google Scholar]
- 29.JJ K, editor. Clinical Ophthalmology: a Systematic Approach. Philadelphia: Butterworth Heinmann Elsevier; 2007. [Google Scholar]
- 30.Soliman W, Sander B, Jorgensen TM. Enhanced optical coherence patterns of diabetic macular oedema and their correlation with the pathophysiology. Acta Ophthalmol Scand. 2007;85:613–617. doi: 10.1111/j.1600-0420.2007.00917.x. [DOI] [PubMed] [Google Scholar]
- 31.Lammer J, et al. Detection and analysis of hard exudates by polarization-sensitive optical coherence tomography in patients with diabetic maculopathy. Invest Ophthalmol Vis Sci. 2014;55:1564–1571. doi: 10.1167/iovs.13-13539. [DOI] [PubMed] [Google Scholar]