Abstract
In the present work, we reported a new nuclear Overhauser enhancement (NOE)-mediated magnetization transfer (MT) signal at around −1.6 ppm (NOE(−1.6)) in rat brain and investigated its application in the detection of acute ischemic stroke in rodent model. Using continuous wave (CW) MT sequence, the NOE(−1.6) is reliably detected in rat brain. The amplitude of this new NOE signal in rat brain was quantified using a 5-pool Lorentzian Z-spectral fitting method. Amplitudes of amide, amine, NOE at −3.5 ppm (NOE(−3.5)), as well as NOE(−1.6) were mapped using this fitting method in rat brain. Several other conventional imaging parameters (R1, R2, apparent diffusion coefficient (ADC), and semi-solid pool size ratio (PSR)) were also measured. Our results showed that NOE(−1.6), R1, R2, ADC, and APT signals from stroke lesion have significant changes at 0.5–1 h after stroke. Compared with several other imaging parameters, NOE(−1.6) shows the strongest contrast differences between stroke and contralateral normal tissues and stays consistent over time until 2 h after onset of stroke. Our results demonstrate that this new NOE(−1.6) signal in rat brain is a new potential contrast for assessment of acute stroke in vivo and might provide broad applications in the detection of other abnormal tissues.
Keywords: magnetization transfer (MT), chemical exchange saturation transfer (CEST), nuclear Overhauser enhancement (NOE), ischemic stroke
1. Introduction
Magnetization Transfer (MT) techniques provide an amplification process and can indirectly detect solute molecules in the millimolar range as well as their chemical environment (e.g. pH, temperature) through measurement of water signal changes caused by a cumulative transfer effect from saturated protons under a long saturation pulse. An MT Z-spectrum is typically acquired so that the effect of magnetization transfer at a specific frequency can be identified readily. MT Z-spectra depict the MT effects between the exchangeable proton pools of cellular compounds and water via chemical exchange saturation transfer (CEST) as well as through-space dipolar couplings of non-exchangeable protons and water via nuclear Overhauser enhancement (NOE). MT effects from amide (3.5 ppm), amine (2–3 ppm), hydroxyl (1 ppm), and aliphatic protons (−3.5 ppm) have been widely studied in the past decade and novel contrast mechanisms (e.g. protein/peptide (1), glutamate (2), glucose (3–8), creatine (9,10), myo-inositol (11), glycosaminoglycan (12), and pH imaging (13–15), etc) have been constantly found and successfully translated to preclinical and clinical use (e.g. tumors (1,13,16–18), ischemic stroke (15,19–22), multiple sclerosis (23), and diabetes (24)). Exploration of new MT effects promises to provide novel and interesting contrasts and improve diagnostic capability of MRI.
Ischemic stroke is one of most frequent causes of severe disability and death. During acute ischemic stroke the brain undergoes complex cascade of physiological and metabolic disturbances. Magnetic resonance imaging (MRI) is an ideal tool for the assessment of these disturbances in brain under acute ischemia. Several conventional MRI techniques (e.g. T1, T2, and diffusion) have been applied to diagnose ischemic stroke (25–28). Amide proton transfer (APT), a variation of MT or CEST technique, which originates from backbone amide protons associated with endogenous mobile, cytosolic proteins and peptides in biological tissue has been used previously to distinguish benign oligemia from the ischemic penumbra (20,29). It was reported that these MRI contrasts reflect different physiological or metabolic changes during stroke (15,30–32). New magnetization transfer mechanisms may provide insight into stroke injury which has potential for diagnosing and managing stroke.
Recently, we reported a new NOE-mediated MT signal at around −1.6 ppm (NOE(−1.6)) (33). NOE effects result from the transfer of nuclear spin polarization from one nuclear spin population to another via cross-relaxation. An NOE-mediated MT signal at −3.5 ppm (NOE(−3.5)) has been demonstrated in brain in vivo, and has been used to detect tumor (34) and ischemic stroke (22). In this paper, we aim to detect and quantify this new NOE(−1.6) signal and evaluate the application of this signal for the detection of acute ischemic stroke in a rodent model through comparison with several other MRI parameters. Our results indicate that this NOE(−1.6) signal provides the highest contrast differences between stroke lesions and contralateral normal tissues at 0.5–1 h after stroke compared with several other imaging parameters.
2. Materials and Methods
2.1 Animal Preparation
All procedures were reviewed and approved by the Vanderbilt University Institutional Animal Care and Use Committee. Ischemic strokes were induced via middle cerebral artery occlusion (MCAO) in the left hemispheres of six rat brains. Rats were scanned using multimodality MRI before surgery for baseline acquisition and at 0.5–1 h, 1–1.5 h, and 1.5–2 h after onset of ischemic stroke for the time-course study. Animals were anesthetized with 2–3 % isoflurane (ISO) for induction and surgery, and 2 % for maintenance.
2.2 MRI
Animal measurements were performed on a Varian DirectDrive™ horizontal 7 T magnet with a 38-mm Doty RF coil (Doty Scientific Inc. Columbia, SC, USA). MT measurements were performed by applying 5 s continuous wave (CW) irradiation before single-shot spin-echo Echo Planar Imaging (EPI) acquisition. MT Z-spectra were acquired with RF offsets from −5 ppm to 5 ppm (−1500 Hz to 1500 Hz at 7 T) with steps of 0.167 ppm (50 Hz at 7T) and RF power of 1μT. Control images were acquired with RF offsets of 333 ppm (100000 Hz at 7T). Longitudinal relaxation rate (R1) and semi-solid component pool size ratio (PSR) were obtained using a selective inversion recovery (SIR) method with inversion time of 4, 5, 6, 7, 8, 10, 15, 20, 50, 100, 400, 800, 1000, 3000, 5000, and 8000 ms (35,36). Transverse relaxation rate (R2) was obtained using five echo times of 30, 50, 70, 90, and 110 ms. Apparent diffusion coefficient (ADC) was obtained using pulse gradient spin echo sequence with gradients applied simultaneously on three axes (gradient duration = 6 ms, separation = 12 ms, five b-values between 0 and 1000 s/mm2). All images were acquired with matrix size 64 × 64, field of view 30 × 30 mm and one acquisition.
2.3 Data analysis
All data analyses were performed using Matlab R2013b (Mathworks, Natick, MA, USA). Regions of interest (ROIs) with regions of left hemisphere, right hemisphere, and whole rat brains were manually outlined. ROIs with regions of gray matter (GM) and white matter (WM) were manually outlined from T2-weighted images. The GM was selected from the cerebral cortex, and the WM was selected from the corpus callosum. Parameter values for a given rat were determined by the average over an ROI of pixel-by-pixel data fittings, and reported uncertainties equal the standard deviation across animals. Peaks in the Z-spectra overlapped so multiple resonances were resolved by peak fitting over the offset range from −5 to 5 ppm. The peak fitting algorithm was implemented by inverting the Z-spectra between −5 to 5 ppm and removing the remaining baseline caused by non-specific MT effects so that the points at 5 ppm were set to be 0. A non-linear optimization algorithm was applied to decompose the B0-corrected signal into a set of overlapping components. The fitting was performed to achieve the lowest root mean square of residuals (RMSR) between the data and model in the selected segment. The Z-spectra were fit as the sum of several peaks of Lorentzian shapes with the following equation (37):
| (1) |
where the Z-spectrum is a function of RF offset (Δ), peak full width at half maximum (W) and peak amplitude (A). Δ0i is the resonance frequency offset of a solute pool. N is the number of proton pools. In the present work, we used a 4 pool (amide, amine, water, and NOE at −3.5 ppm) and a 5 pool (amide, amine, water, NOE at −1.6 ppm, and NOE at −3.5 ppm) Lorentzian fitting to process the Z-spectra. The peak positions of amide, amine, water, and NOE(−3.5) were fixed at their resonance frequencies. The peak position of NOE(−1.6) was allowed to change from −1.2 to −1.8 ppm for best fitting.
2.4 Statistics
All statistical analyses were performed using Matlab R2013b. It was considered to be statistically significant when P < 0.05. Student’s t-test or one-way analysis of variance (ANOVA) was employed to evaluate the signal difference between lesions and normal tissues.
3. Results
3.1 Multi-pool Lorentzian fitting
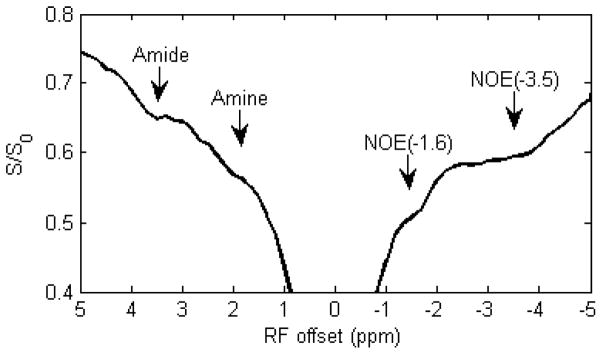
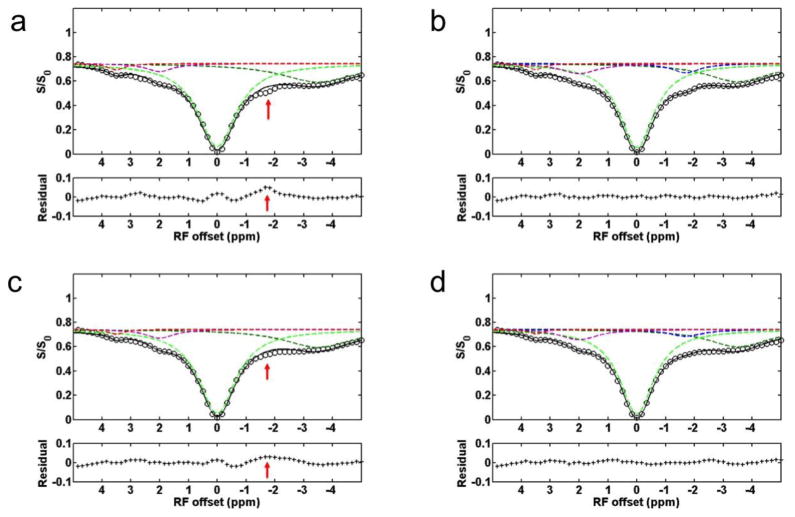
Fig. 1 shows a representative Z-spectrum from a rat brain acquired with a CW-MT sequence. In addition to several MT signals from amide protons at 3.5ppm, amine protons at 2 ppm, and NOE(−3.5) that have been reported previously, an NOE-mediated MT signal, NOE(−1.6), can be observed. To further resolve and quantify the NOE(−1.6), we performed multiple Lorentzian fitting of the Z-spectra. Since 4-pool (amide, amine, water, and NOE at −3.5 ppm) Lorentzian fitting was used to process the Z-spectra previously (37), we first performed this 4-pool fitting of Z-spectra from contralateral normal tissue and stroke lesion on a representative rat brain, and results are shown in Fig. 2a and 2c. Note the residuals are significantly higher in the range between −1 to −2 ppm (red arrow) compared with those of other regions, indicating that there may be another relevant component in this range. Note that a similar fitting result was also observed in the previous 4-pool fitting (Fig. 2 in Ref (37)), but was not fully discussed. In the second step, a 5-pool Lorentzian fitting with an additional MT pool with resonance frequency offset ranging from −1.2 to −1.8 was performed, and results are shown in Fig. 2b and 2d. The reduced residual from −1 to −2 ppm indicates the successful fitting of this 5-pool Lorentzian method. As shown in Fig. 2, the NOE(−1.6) signal is diminished in the stroke lesion compared with that in contralateral normal tissue, indicating that it is a new potential contrast for assessment of acute stroke.
Figure 1.
A representative Z-spectrum showing amide at 3.5 ppm, amine at 2 ppm, NOE at around −3.5 ppm, and NOE at around −1.6 ppm from normal tissue in a rat brain. S: measures signal; S0: standard signal.
Figure 2.
The Z-spectrum, fitted peaks using Lorentzian function, and the residual from a representative rat brain with ischemic stroke. (a) and (b) show the 4-pool and 5-pool Lorentzian fitted results from the contralateral normal tissue, respectively. (c) and (d) show the 4-pool and 5-pool Lorentzian fitted results from the stroke lesion, respectively. Note the significantly bad residual ranging from −1 to −2 ppm (red arrow) in (a) and (c), but not in (b) and (d), indicating the presence of a possible MT pool in this range. Also note that the NOE(−1.6) signal is diminished in the stroke lesion compared with that in contralateral normal tissue.
3.2 Mapping of NOE(−1.6) in normal rat brain
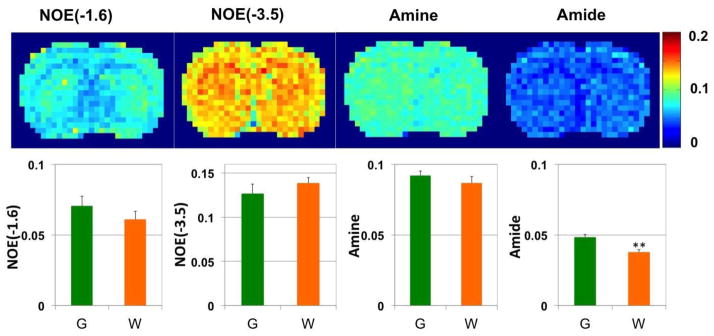
By using the 5-pool Lorentzian Z-spectral fitting method, the amplitude of the NOE(−1.6) signal was quantified. As illustrated in Fig. 3, over six rats, the amplitudes of NOE(−1.6) in GM and WM are 7.05 ± 1.31 (%) vs 6.11 ± 1.06 (%); the amplitudes of NOE(−3.5) in GM and WM are 12.68 ± 1.06 (%) vs 13.88 ± 0.61 (%); the amplitudes of amine in GM and WM are 9.20 ± 0.34 (%) vs 8.67 ± 0.45 (%); the amplitudes of amide in GM and WM are 4.84 ± 0.20 (%) vs 3.78 ± 0.18 (%). No statistical difference of NOE(−1.6) was observed between GM and WM. However, the amplitude of amide in GM is significantly higher than that in WM (P<0.01).
Figure 3.
pixel-by-pixel fitted amplitude maps from a representative healthy rat brain. The top panel: from left to right are NOE(−1.6), amide at 3.5 ppm, NOE at −3.5 ppm, and amine at 2 ppm. The bottom panels are statistical analysis of corresponding maps from 6 healthy rat brains (G: gray matter; W: white matter). **P<0.01
3.3 Multi-parametric maps
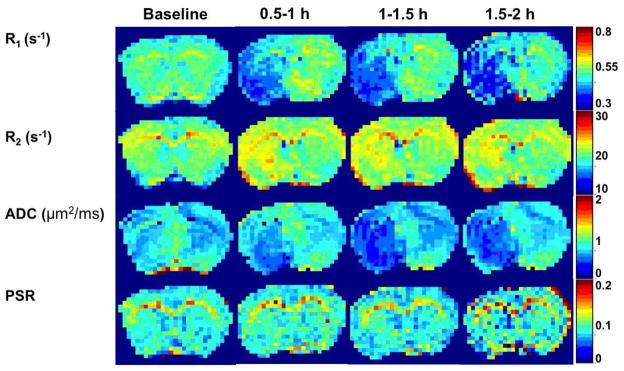
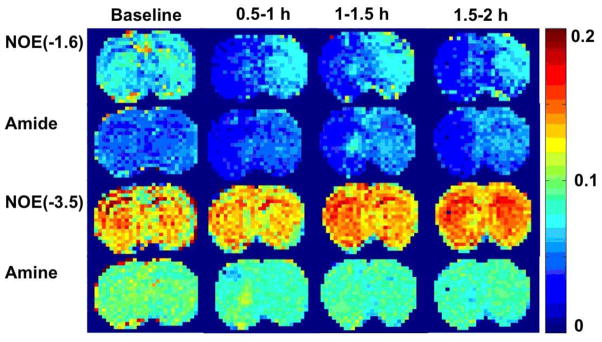
Fig. 4 and Fig. 5 show the maps of R1, R2, ADC, PSR, amide, amine, NOE(−3.5) as well as NOE(−1.6) from a representative rat brain longitudinally after stroke. There are visible changes in several MR parameters immediately (0.5–1h) after stroke, such as R1, R2, ADC, and APT. In addition to above parameters, NOE(−1.6) maps also showed significant contrast difference between normal and lesion tissue immediately after stroke, which evolve over time.
Figure 4.
Multi-parametric maps of R1, R2, ADC, and PSR acquired at different time points before and after ischemic stroke from a representative rat brain.
Figure 5.
Multi-parametric maps of NOE (−1.6), amide, NOE(−3.5), and amine acquired at different time points before and after ischemic stroke from a representative rat. Figure 6:
3.4 Time courses
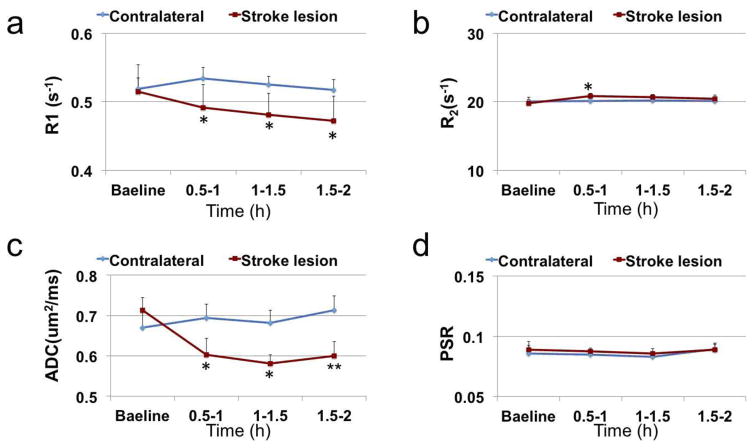
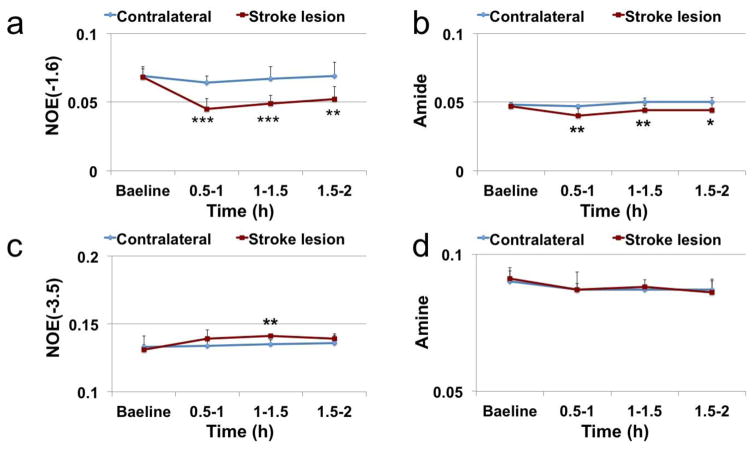
Fig. 6 shows the time courses of several conventional imaging parameters including R1, R2, ADC, and PSR, and Fig. 7 shows the time courses of the fitted amplitudes of the MT pools from ischemic stroke lesions and contralateral normal tissues. At 0.5–1 h after MCAO, the following parameters from ischemic stroke lesions and contralateral normal tissues changed statistically: 4.6% decrease vs 2.9% increase on R1; 5.4% increase vs 0.4% increase on R2; 15. 4% decrease vs 3.6% increase on ADC; 14.9% decrease vs 2.1% decrease on APT; 33.5% decrease vs 7.0% decrease on NOE(−1.6). Among all these parameters, NOE(−1.6) shows the strongest contrast differences between stroke lesions and contralateral normal tissues (29.0%, P=0.0004) at 0.5–1 h after stroke. This difference of NOE(−1.6) stayed consistent over time until 2 h after MCAO.
Figure 6.
Time-dependent statistics of R1 (a), R2 (b), ADC (c), and PSR (d) in lesion and contralateral normal tissue from 6 rats. *P< 0.05, **P<0.01.
Figure 7.
Time-dependent statistics of NOE(−1.6) (a), amide (b), NOE(−3.5) (c), and amine (d) in lesion and contralateral normal tissue from 6 rats. *P< 0.05, **P<0.01, ***P<0.001.
4. Discussion
4.1 A new MT signal at around −1.6 ppm
In the present work, we reported a novel NOE(−1.6) in rat brain on 7 T and found this signal is dramatically reduced in acute ischemic stroke lesion compared with the contralateral normal brain tissue. This new MT signal was already been apparent using another Lorentzian fitting method in previous publications on a 7 T human scanner (Fig. 8a in Ref (34)), but it has not been previously discussed. This signal has not been reported on 3 T human scanners (38) presumably because it is challenging to resolve this signal since its resonance frequency is close to water on lower field scanners. The signal to noise ratio (SNR) of this signal is around 110 in our measurement on rat brain, which is less than the SNR of amide (around 135). In contrast, the NOE(−1.6) shows stronger contrast differences between stroke lesions and contralateral normal tissues than amide signal (see Fig. 7) which has previously been applied in detecting pH change in ischemia, indicating that the NOE(−1.6) is a more sensitive method. However, the standard deviation/amplitude of the NOE(−1.6) in GM across all normal subjects (18%) is larger than that of amide (4%) (see Fig. 3), indicating that the repeatability of NOE(−1.6) is lower than that of amide. Influence from physiological conditions on the NOE(−1.6) signal might be one possible reason for this higher standard deviation.
Similar to other CEST effects, the NOE signal also strongly depends on sequence parameters. Since the NOE coupling rate is slow (39), a long irradiation time (usually a few seconds) is required for the spin system to reach steady state. In addition, a moderate irradiation power is required to avoid much direct water saturation effect which becomes significant when the resonance frequency of solute molecules is close to water line. In APT experiments, a 5 s irradiation time and 1 μT irradiation power have been used (40,41). To compare the NOE(−1.6) with APT, we used the same sequence parameters in all our measurements. Experimental result in Fig. 1 shows a NOE dip at around −1.6 ppm by using these sequence parameters. Since the resonance frequency of NOE(−1.6) is closer to water than that of amide. A lower irradiation power may be better to specifically quantify NOE(−1.6). Optimization of these parameters needs further studies.
4.2 Comparison among different imaging parameters
In Fig. 4 and Fig. 6, we found that several imaging parameters (R1, R2, ADC, and APT) show changes in ischemic stroke which is in agreement with previous publications (22). The amplitude of fitted amine signal does not change in stroke which is different from previous measurement (42). This could be caused by the different irradiation power used in the two measurements, since the amine peak likely originates from several metabolites and proteins which have a broad range of chemical exchange rates and irradiation power affects the effective exchange rate filter. Different power could select different metabolites. The amplitude of fitted NOE(−3.5) signal has slight change in stroke which is also different from previous study in which significant change of NOE(−3.5) was found by using a three-point method (22). This could be caused by the different quantification method used in the two studies. Here, a multi-pool Lorentzian fit was used to quantify each MT pool so that overlapping signals can be resolved. However, the three-point method, which subtract the signal at −3.5 ppm and the average of two signals at −2 and −5 to quantify NOE(−3.5), may has contaminations from the significant change of NOE(−1.6) during stroke.
4.3 Possible origin of the NOE(−1.6) contrast in ischemic stroke
During acute ischemic stroke, the cerebral tissue undergoes physical and chemical changes including a complex cascade of metabolic disturbances, cerebral edema, tissue acidosis, and cell membrane depolarization. Although the biological mechanisms responsible for the change of these imaging parameters are not fully understood, it has been reported that water accumulation contributes to T1 prolongation in ischemia (30); the blood oxygen level-dependence (BOLD) and chemical exchange changes contribute to T2 change in ischemia (31,32); the water shift between intracellular and extracellular spaces contributes to ADC change in ischemia (43), and the tissue acidosis contributes to the APT change (15).
The molecular origin of the NOE(−1.6) is still not clear. Negative NOE effects arise from restricted molecules. Phosphatidylcholine (PtdCho), a major phospholipid component of eukaryotic cells, contains a choline head group with resonance frequency at around −1.6 ppm from water. The choline head group is covalently linked to lipids which integrate into membrane and thus is in a restricted state. In previous publications, NOE effects between choline headgroups in membrane phospholipids and water protons have been reported using 2D nuclear Overhauser enhancement spectroscopy (NOESY) (44–46). Thus, it is likely that the NOE-mediated MT signal at −1.6 ppm originates from phospholipid choline headgroups. However, another study assumed that signals at this RF offset could be due to NOE effects from the α-protons of mobile membrane proteins (37). The signal origin and its contrast mechanism in ischemic stroke warrant further investigation.
5. Conclusion
A novel NOE(−1.6) signal in rat brain is reported as a new potential contrast for assessment of acute ischemic stroke. Compared with several other imaging parameters, the NOE(−1.6) provides the strongest contrast difference between stroke lesion and contralateral normal tissue.
Acknowledgments
Grant Sponsor: R21EB17873, R01CA109106, R01CA184693, R01EB017767, and K25CA168936
This work was supported by the National Institutes of Health (R21EB17873, R01CA109106, R01CA184693, R01EB017767, and K25CA168936).
Footnotes
Publisher's Disclaimer: This is a PDF file of an unedited manuscript that has been accepted for publication. As a service to our customers we are providing this early version of the manuscript. The manuscript will undergo copyediting, typesetting, and review of the resulting proof before it is published in its final citable form. Please note that during the production process errors may be discovered which could affect the content, and all legal disclaimers that apply to the journal pertain.
References
- 1.Zhou JY, Tryggestad E, Wen ZB, Lal B, Zhou TT, Grossman R, Wang SL, Yan K, Fu DX, Ford E, Tyler B, Blakeley J, Laterra J, van Zijl PCM. Differentiation between glioma and radiation necrosis using molecular magnetic resonance imaging of endogenous proteins and peptides. Nature Medicine. 2011;17(1):130–U308. doi: 10.1038/nm.2268. [DOI] [PMC free article] [PubMed] [Google Scholar]
- 2.Cai KJ, Haris M, Singh A, Kogan F, Greenberg JH, Hariharan H, Detre JA, Reddy R. Magnetic resonance imaging of glutamate. Nature Medicine. 2012;18(2):302–306. doi: 10.1038/nm.2615. [DOI] [PMC free article] [PubMed] [Google Scholar]
- 3.Walker-Samuel S, Ramasawmy R, Torrealdea F, Rega M, Rajkumar V, Johnson SP, Richardson S, Goncalves M, Parkes HG, Arstad E, Thomas DL, Pedley RB, Lythgoe MF, Golay X. In vivo imaging of glucose uptake and metabolism in tumors. Nature Medicine. 2013;19(8):1067. doi: 10.1038/nm.3252. + [DOI] [PMC free article] [PubMed] [Google Scholar]
- 4.Rivlin M, Horev J, Tsarfaty I, Navon G. Molecular imaging of tumors and metastases using chemical exchange saturation transfer (CEST) MRI. Scientific Reports. 2013;3 doi: 10.1038/srep03045. [DOI] [PMC free article] [PubMed] [Google Scholar]
- 5.Zu ZL, Spear J, Li H, Xu JZ, Gore JC. Measurement of regional cerebral glucose uptake by magnetic resonance spin-lock imaging. Magnetic Resonance Imaging. 2014;32(9):1078–1084. doi: 10.1016/j.mri.2014.06.002. [DOI] [PMC free article] [PubMed] [Google Scholar]
- 6.Rivlin M, Tsarfaty I, Navon G. Functional Molecular Imaging of Tumors by Chemical Exchange Saturation Transfer MRI of 3-O-Methyl-D-Glucose. Magnetic Resonance in Medicine. 2014;72(5):1375–1380. doi: 10.1002/mrm.25467. [DOI] [PubMed] [Google Scholar]
- 7.Nasrallah FA, Pages G, Kuchel PW, Golay X, Chuang KH. Imaging brain deoxyglucose uptake and metabolism by glucoCEST MRI. Journal of Cerebral Blood Flow and Metabolism. 2013;33(8):1270–1278. doi: 10.1038/jcbfm.2013.79. [DOI] [PMC free article] [PubMed] [Google Scholar]
- 8.Chan KWY, McMahon MT, Kato Y, Liu GS, Bulte JWM, Bhujwalla ZM, Artemov D, van Zijl PCM. Natural D-glucose as a biodegradable MRI contrast agent for detecting cancer. Magnetic Resonance in Medicine. 2012;68(6):1764–1773. doi: 10.1002/mrm.24520. [DOI] [PMC free article] [PubMed] [Google Scholar]
- 9.Haris M, Singh A, Cai KJ, Kogan F, McGarvey J, DeBrosse C, Zsido GA, Witschey WRT, Koomalsingh K, Pilla JJ, Chirinos JA, Ferrari VA, Gorman JH, Hariharan H, Gorman RC, Reddy R. A technique for in vivo mapping of myocardial creatine kinase metabolism. Nature Medicine. 2014;20(2):209–214. doi: 10.1038/nm.3436. [DOI] [PMC free article] [PubMed] [Google Scholar]
- 10.Haris M, Nanga RPR, Singh A, Cai K, Kogan F, Hariharan H, Reddy R. Exchange rates of creatine kinase metabolites: feasibility of imaging creatine by chemical exchange saturation transfer MRI. Nmr in Biomedicine. 2012;25(11):1305–1309. doi: 10.1002/nbm.2792. [DOI] [PMC free article] [PubMed] [Google Scholar]
- 11.Haris M, Cai KJ, Singh A, Hariharan H, Reddy R. In vivo mapping of brain myo-inositol. Neuroimage. 2011;54(3):2079–2085. doi: 10.1016/j.neuroimage.2010.10.017. [DOI] [PMC free article] [PubMed] [Google Scholar]
- 12.Ling W, Regatte RR, Navon G, Jerschow A. Assessment of glycosaminoglycan concentration in vivo by chemical exchange-dependent saturation transfer (gagCEST) Proceedings of the National Academy of Sciences of the United States of America. 2008;105(7):2266–2270. doi: 10.1073/pnas.0707666105. [DOI] [PMC free article] [PubMed] [Google Scholar]
- 13.Zhou JY, Payen JF, Wilson DA, Traystman RJ, van Zijl PCM. Using the amide proton signals of intracellular proteins and peptides to detect pH effects in MRI. Nature Medicine. 2003;9(8):1085–1090. doi: 10.1038/nm907. [DOI] [PubMed] [Google Scholar]
- 14.Jin T, Wang P, Zong XP, Kim SG. MR imaging of the amide-proton transfer effect and the pH-insensitive nuclear overhauser effect at 9. 4 T. Magnetic Resonance in Medicine. 2013;69(3):760–770. doi: 10.1002/mrm.24315. [DOI] [PMC free article] [PubMed] [Google Scholar]
- 15.Sun PZ, Cheung JS, Wang EF, Lo EH. Association between pH-weighted endogenous amide proton chemical exchange saturation transfer MRI and tissue lactic acidosis during acute ischemic stroke. Journal of Cerebral Blood Flow and Metabolism. 2011;31(8):1743–1750. doi: 10.1038/jcbfm.2011.23. [DOI] [PMC free article] [PubMed] [Google Scholar]
- 16.Salhotra A, Lal B, Laterra J, Sun PZ, van Zijl PCM, Zhou JY. Amide proton transfer imaging of 9L gliosarcoma and human glioblastoma xenografts. Nmr in Biomedicine. 2008;21(5):489–497. doi: 10.1002/nbm.1216. [DOI] [PMC free article] [PubMed] [Google Scholar]
- 17.Jones CK, Schlosser MJ, van Zijl PCM, Pomper MG, Golay X, Zhou JY. Amide proton transfer imaging of human brain tumors at 3T. Magnetic Resonance in Medicine. 2006;56(3):585–592. doi: 10.1002/mrm.20989. [DOI] [PubMed] [Google Scholar]
- 18.Jia GA, Abaza R, Williams JD, Zynger DL, Zhou JY, Shah ZK, Patel M, Sammet S, Wei L, Bahnson RR, Knopp MV. Amide Proton Transfer MR Imaging of Prostate Cancer: A Preliminary Study. Journal of Magnetic Resonance Imaging. 2011;33(3):647–654. doi: 10.1002/jmri.22480. [DOI] [PMC free article] [PubMed] [Google Scholar]
- 19.Sun PZ, Wang EF, Cheung JS. Imaging acute ischemic tissue acidosis with pH-sensitive endogenous amide proton transfer (APT) MRI-Correction of tissue relaxation and concomitant RF irradiation effects toward mapping quantitative cerebral tissue pH. Neuroimage. 2012;60(1):1–6. doi: 10.1016/j.neuroimage.2011.11.091. [DOI] [PMC free article] [PubMed] [Google Scholar]
- 20.Sun PZ, Zhou JY, Sun WY, Huang J, van Zijl PCM. Detection of the ischemic penumbra using pH-weighted MRI. Journal of Cerebral Blood Flow and Metabolism. 2007;27(6):1129–1136. doi: 10.1038/sj.jcbfm.9600424. [DOI] [PubMed] [Google Scholar]
- 21.Sun PZ, Benner T, Copen WA, Sorensen AG. Early Experience of Translating pH-Weighted MRI to Image Human Subjects at 3 Tesla. Stroke. 2010;41(10):S147–S151. doi: 10.1161/STROKEAHA.110.595777. [DOI] [PMC free article] [PubMed] [Google Scholar]
- 22.Li H, Zu ZL, Zaiss M, Khan IS, Singer RJ, Gochberg DF, Bachert P, Gore JC, Xu JZ. Imaging of amide proton transfer and nuclear Overhauser enhancement in ischemic stroke with corrections for competing effects. Nmr in Biomedicine. 2015;28(2):200–209. doi: 10.1002/nbm.3243. [DOI] [PMC free article] [PubMed] [Google Scholar]
- 23.Dula AN, Asche EM, Landman BA, Welch EB, Pawate S, Sriram S, Gore JC, Smith SA. Development of Chemical Exchange Saturation Transfer at 7T. Magnetic Resonance in Medicine. 2011;66(3):831–838. doi: 10.1002/mrm.22862. [DOI] [PMC free article] [PubMed] [Google Scholar]
- 24.Wang F, Kopylov D, Zu ZL, Takahashi K, Wang SW, Quarles CC, Gore JC, Harris RC, Takahashi T. Mapping murine diabetic kidney disease using chemical exchange saturation transfer MRI. Magnetic Resonance in Medicine. 2015 doi: 10.1002/mrm.26045. [DOI] [PMC free article] [PubMed] [Google Scholar]
- 25.Jokivarsi KT, Hiltunen Y, Tuunanen PI, Kauppinen RA, Grohn OHJ. Correlating tissue outcome with quantitative multiparametric MRI of acute cerebral ischemia in rats. Journal of Cerebral Blood Flow and Metabolism. 2010;30(2):415–427. doi: 10.1038/jcbfm.2009.236. [DOI] [PMC free article] [PubMed] [Google Scholar]
- 26.Hossmann KA. Viability Thresholds and the Penumbra of Focal Ischemia. Annals of Neurology. 1994;36(4):557–565. doi: 10.1002/ana.410360404. [DOI] [PubMed] [Google Scholar]
- 27.Calamante F, Lythgoe MF, Pell GS, Thomas DL, King MD, Busza AL, Sotak CH, Williams SR, Ordidge RJ, Gadian DG. Early changes in water diffusion, perfusion, T(1), and T(2) during focal cerebral ischemia in the rat studied at 8. 5 T. Magnetic Resonance in Medicine. 1999;41(3):479–485. doi: 10.1002/(sici)1522-2594(199903)41:3<479::aid-mrm9>3.0.co;2-2. [DOI] [PubMed] [Google Scholar]
- 28.Grohn OHJ, Lukkarinen JA, Oja JME, van Zijl PCM, Ulatowski JA, Traystman RJ, Kauppinen RA. Noninvasive detection of cerebral hypoperfusion and reversible ischemia from reductions in the magnetic resonance imaging relaxation time, T-2. Journal of Cerebral Blood Flow and Metabolism. 1998;18(8):911–920. doi: 10.1097/00004647-199808000-00012. [DOI] [PubMed] [Google Scholar]
- 29.Zhou JY, van Zijl PCM. Defining an Acidosis-Based Ischemic Penumbra from pH-Weighted MRI. Translational Stroke Research. 2012;3(1):76–83. doi: 10.1007/s12975-011-0110-4. [DOI] [PMC free article] [PubMed] [Google Scholar]
- 30.Knight RA, Dereski MO, Helpern JA, Ordidge RJ, Chopp M. Magnetic-Resonance-Imaging Assessment of Evolving Focal Cerebral-Ischemia - Comparison with Histopathology in Rats. Stroke. 1994;25(6):1252–1261. doi: 10.1161/01.str.25.6.1252. [DOI] [PubMed] [Google Scholar]
- 31.Thulborn KR, Waterton JC, Matthews PM, Radda GK. Oxygenation Dependence of the Transverse Relaxation-Time of Water Protons in Whole-Blood at High-Field. Biochimica Et Biophysica Acta. 1982;714(2):265–270. doi: 10.1016/0304-4165(82)90333-6. [DOI] [PubMed] [Google Scholar]
- 32.Ogawa S, Lee TM, Kay AR, Tank DW. Brain Magnetic-Resonance-Imaging with Contrast Dependent on Blood Oxygenation. Proceedings of the National Academy of Sciences of the United States of America. 1990;87(24):9868–9872. doi: 10.1073/pnas.87.24.9868. [DOI] [PMC free article] [PubMed] [Google Scholar]
- 33.Zhang XY, Li H, Xu JZ, Xie JP, Gore JC, Zu ZL. A new MT signal at −1.6 ppm via NOE-mediated saturation transfer. ISMRM. 2015;0999 [Google Scholar]
- 34.Jones CK, Huang A, Xu JD, Edden RAE, Schar M, Hua J, Oskolkov N, Zaca D, Zhou JY, McMahon MT, Pillai JJ, van Zijl PCM. Nuclear Overhauser enhancement (NOE) imaging in the human brain at 7 T. Neuroimage. 2013;77:114–124. doi: 10.1016/j.neuroimage.2013.03.047. [DOI] [PMC free article] [PubMed] [Google Scholar]
- 35.Gochberg DF, Gore JC. Quantitative imaging of magnetization transfer using an inversion recovery sequence. Magnetic resonance in medicine: official journal of the Society of Magnetic Resonance in Medicine/Society of Magnetic Resonance in Medicine. 2003;49(3):501–505. doi: 10.1002/mrm.10386. [DOI] [PubMed] [Google Scholar]
- 36.Li K, Zu Z, Xu J, Janve VA, Gore JC, Does MD, Gochberg DF. Optimized inversion recovery sequences for quantitative T1 and magnetization transfer imaging. Magnetic resonance in medicine: official journal of the Society of Magnetic Resonance in Medicine/Society of Magnetic Resonance in Medicine. 2010;64(2):491–500. doi: 10.1002/mrm.22440. [DOI] [PMC free article] [PubMed] [Google Scholar]
- 37.Desmond KL, Moosvi F, Stanisz GJ. Mapping of Amide, Amine, and Aliphatic Peaks in the CEST Spectra of Murine Xenografts at 7 T. Magnetic Resonance in Medicine. 2014;71(5):1841–1853. doi: 10.1002/mrm.24822. [DOI] [PubMed] [Google Scholar]
- 38.Zhao XN, Wen ZB, Huang FH, Lu SL, Wang XL, Hu SG, Zu DL, Zhou JY. Saturation Power Dependence of Amide Proton Transfer Image Contrasts in Human Brain Tumors and Strokes at 3 T. Magnetic Resonance in Medicine. 2011;66(4):1033–1041. doi: 10.1002/mrm.22891. [DOI] [PMC free article] [PubMed] [Google Scholar]
- 39.Xu X, Yadav NN, Zeng HF, Jones CK, Zhou JY, van Zijl PCM, Xu JD. Magnetization Transfer Contrast-Suppressed Imaging of Amide Proton Transfer and Relayed Nuclear Overhauser Enhancement Chemical Exchange Saturation Transfer Effects in the Human Brain at 7T. Magnetic Resonance in Medicine. 2016;75(1):88–96. doi: 10.1002/mrm.25990. [DOI] [PMC free article] [PubMed] [Google Scholar]
- 40.Zu ZL, Xu JZ, Li H, Chekmenev EY, Quarles CC, Does MD, Gore JC, Gochberg DF. Imaging Amide Proton Transfer and Nuclear Overhauser Enhancement Using Chemical Exchange Rotation Transfer (CERT) Magnetic Resonance in Medicine. 2014;72(2):471–476. doi: 10.1002/mrm.24953. [DOI] [PMC free article] [PubMed] [Google Scholar]
- 41.Xu JZ, Zaiss M, Zu ZL, Li H, Xie JP, Gochberg DF, Bachert P, Gore JC. On the origins of chemical exchange saturation transfer (CEST) contrast in tumors at 9. 4 T. Nmr in Biomedicine. 2014;27(4):406–416. doi: 10.1002/nbm.3075. [DOI] [PMC free article] [PubMed] [Google Scholar]
- 42.Jin T, Wang P, Zong XP, Kim SG. Magnetic resonance imaging of the Amine-Proton EXchange (APEX) dependent contrast. Neuroimage. 2012;59(2):1218–1227. doi: 10.1016/j.neuroimage.2011.08.014. [DOI] [PMC free article] [PubMed] [Google Scholar]
- 43.Vangelderen P, Devleeschouwer MHM, Despres D, Pekar J, Vanzijl PCM, Moonen CTW. Water Diffusion and Acute Stroke. Magnetic Resonance in Medicine. 1994;31(2):154–163. doi: 10.1002/mrm.1910310209. [DOI] [PubMed] [Google Scholar]
- 44.Chen JH, Sambol EB, DeCarolis P, O’Connor R, Geha RC, Wu YV, Singer S. High-resolution MAS NMR spectroscopy detection of the spin magnetization exchange by cross-relaxation and chemical exchange in intact cell lines and human tissue specimens. Magnetic Resonance in Medicine. 2006;55(6):1246–1256. doi: 10.1002/mrm.20889. [DOI] [PubMed] [Google Scholar]
- 45.Jonas J, Winter R, Grandinetti PJ, Driscoll D. High-Pressure 2d Noesy Experiments on Phospholipid-Vesicles. Journal of Magnetic Resonance. 1990;87(3):536–547. [Google Scholar]
- 46.Zhou Z, Sayer BG, Hughes DW, Stark RE, Epand RM. Studies of phospholipid hydration by high-resolution magic-angle spinning nuclear magnetic resonance. Biophysical Journal. 1999;76(1):387–399. doi: 10.1016/S0006-3495(99)77205-X. [DOI] [PMC free article] [PubMed] [Google Scholar]


