

Abstract
Objective
To evaluate the association between documentation of estimated fetal weight, and its value, with cesarean delivery.
Methods
This was a secondary analysis of a multi-center observational cohort of 115,502 deliveries from 2008 to 2011. Data were abstracted by trained and certified study personnel. We included women ≥37 weeks attempting vaginal delivery with live, non-anomalous, singleton, vertex fetuses, and no history of cesarean delivery. Rates and odds ratios were calculated for women with ultrasound or clinical estimated fetal weight, compared to women without documentation of estimated fetal weight. Further subgroup analyses were performed for estimated fetal weight categories (<3,500, 3,500 to 3,999, and ≥4,000 grams) stratified by diabetic status. Multivariable analyses were performed to adjust for important potential confounding variables.
Results
We included 64,030 women. Cesarean delivery rates were 18.5% in the ultrasound estimated fetal weight (EFW) group, 13.4% in the clinical EFW group, and 11.7% in the no documented EFW group (p < 0.001). After adjustment (including for birth weight), the adjusted OR (aOR) of cesarean delivery was 1.44 (95% CI 1.31–1.58, p<0.001) for women with ultrasound EFW and 1.08 for clinical EFW (95% CI 1.01–1.15, p=0.017), compared to women with no documented EFW (referent). The highest estimates of fetal weight conveyed the greatest odds of cesarean delivery. When ultrasound EFW was ≥4,000 grams, the aOR was 2.15 (95% CI 1.55–2.98, p<0.001) in women without diabetes, and 9.00 (95% CI 3.65–22.17, p<0.001) in women with diabetes, compared to those with EFW <3,500 grams.
Conclusion
In this contemporary cohort of women attempting vaginal delivery at term, documentation of estimated fetal weight (obtained clinically or, particularly, by ultrasound) was associated with increased odds of cesarean delivery. This relationship was strongest at higher fetal weight estimates, even after controlling for the effects of birth weight and other factors associated with increased cesarean delivery risk.
INTRODUCTION
Reducing the cesarean delivery rate is an important national health goal since, on a population-level, high cesarean delivery rates are associated with increased maternal morbidity and mortality, but not with decreased neonatal morbidity or mortality.1,2 In the United States, the cesarean delivery rate has plateaued since its peak in 2009 at 32.9%.3 In 2014, the American College of Obstetricians and Gynecologists and the Society for Maternal-Fetal Medicine published a consensus statement highlighting the importance of preventing primary cesarean deliveries and provided evidence-based recommendations for antepartum and intrapartum management strategies to reduce the likelihood of cesarean delivery.4
Labor management and delivery route of women attempting vaginal delivery may be influenced by several factors, including health care provider knowledge of estimated fetal weight. Prior research has demonstrated that not only is ultrasonographic overestimation of fetal weight associated with an increased risk of cesarean delivery, but so too is any knowledge of ultrasonographic estimated fetal weight (irrespective of the value).5–10 Thus far, the majority of the studies of these associations have been performed at single centers, (the study by Parry et al included two), and primarily investigated the relationship between ultrasonographic estimated fetal weight (as opposed to clinical estimated fetal weight) and cesarean delivery rates.5–10 Therefore, for the analysis of this large, multi-center cohort of women attempting vaginal delivery at term, we had two linked objectives: 1) to describe the independent association of recorded estimated fetal weight (obtained ultrasonographically or clinically) with cesarean delivery, and 2) to further delineate this association with respect to estimated fetal weight value.
MATERIALS AND METHODS
This was a secondary analysis of the Eunice Kennedy Shriver National Institute of Child Health and Human Development Maternal-Fetal Medicine Units Network’s Assessment of Perinatal Excellence (APEX) study, in which investigators at 25 medical centers assembled an observational cohort of women and their neonates that were delivered during a 24-hour period on randomly selected days between 2008 and 2011, representing one third of deliveries over this 3-year period.11 Patients were eligible for data collection if they arrived at the hospital with a live fetus of at least 23 weeks of gestation. Enrollment from larger hospitals was limited to avoid overrepresentation of patients from these centers. Trained and certified study personnel at each center performed an extensive review of the medical records of women (until hospital discharge) and their neonates (until discharge or 120 days of age, whichever came first). Abstracted data included maternal demographic characteristics, medical and obstetrical history, detailed intrapartum and delivery information, and pregnancy outcomes. All centers obtained institutional review board approval and a waiver of informed consent prior to study initiation.
In this secondary analysis, we included women at or beyond 37 weeks of gestation attempting vaginal delivery with live, non-anomalous, singleton, vertex fetuses. Women with prior cesarean delivery and those with a recorded estimated fetal weight but without indicating estimated fetal weight method were excluded. We also excluded those infants with no recorded birth weight, and those with implausible estimated or actual birth weight values, deemed only possible by a data-entry error (e.g., estimated fetal weight 169 grams). Estimated fetal weight was recorded at the time of admission to labor and delivery, or, if this was unavailable, a measurement within one week of delivery was reported. Estimated fetal weight method was recorded as two mutually exclusive categories (ultrasound or clinical) or not collected (undocumented). Comparisons of baseline characteristics were performed using Kruskal-Wallis tests for continuous variables and chi-square tests for categorical variables. Rates and odds ratios (ORs, both unadjusted and adjusted [aORs]) were calculated for the two groups with estimated fetal weight compared to the group without documentation (referent). We then analyzed the cohort of women with documentation of estimated fetal weight within subgroups defined by estimated fetal weight category (<3,500, 3,500 to 3,999, and ≥ 4,000 grams) and stratified by diabetic status. The number of actual birth weights within 15% of the estimated fetal weight and the number of actual birth weights that were correctly ascertained into each estimated fetal weight category were determined to estimate the accuracy of each estimation method. In multivariable analyses we adjusted for center, year of study, actual birth weight, and other factors previously shown to be associated with risk of cesarean delivery, including maternal age, race/ethnicity, insurance status, body mass index (BMI), nulliparity, labor induction, and diabetic status.12 To account for the possibility that some patients may have contributed more than one delivery to the overall cohort, we repeated all analyses in the sub-group of nulliparous patients. SAS software (SAS Institute, Cary, NC) was used for the analyses. All tests were 2-tailed and a p-value of <0.05 was used to define statistical significance. We made no corrections for multiple comparisons.
RESULTS
Of the original 115,502 women in the APEX cohort, 64,030 met the inclusion criteria, of whom 6,068 women had an ultrasonographic estimated fetal weight, 23,939 a clinical estimated fetal weight, and 34,023 no documented estimated fetal weight (Figure 1). When compared to women in the clinical estimated fetal weight (EFW) and no documented EFW groups, women with EFW obtained by ultrasound more often had diabetes and more frequently underwent labor induction. The proportion of nulliparous women was similar between the ultrasound, clinical, and no documented EFW groups. The experience of the attending physician present at delivery was notably similar between groups. Mean birth weight was highest in women with clinical EFW and lowest in the ultrasound EFW group (Table 1).
Figure 1.
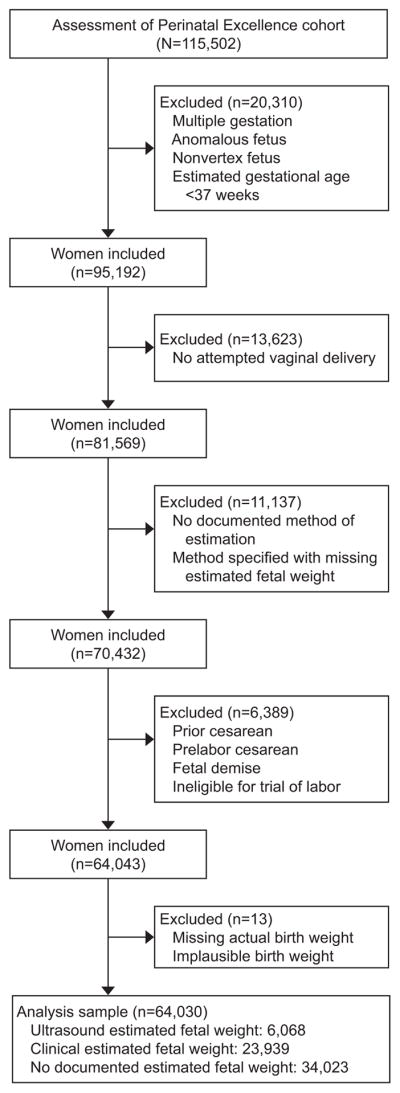
Flow diagram of included participants.
Table 1.
Baseline Characteristics of Study Participants by Method of Fetal Weight Estimation
| Characteristic | Ultrasound EFW (n=6,068) | Clinical EFW (n=23,939) | No documented EFW (n=34,023) | P-value |
|---|---|---|---|---|
|
| ||||
| Maternal age (years) | 26.2 ± 6.3 | 27.6 ± 6.2 | 28.1 ± 5.9 | <0.001 |
|
| ||||
| Race/Ethnicity | <0.001 | |||
| Non-Hispanic white | 1,799 (29.6) | 8,972 (37.5) | 18,007 (52.9) | |
| Non-Hispanic black | 2,214 (36.5) | 4,558 (19.0) | 5,744 (16.9) | |
| Non-Hispanic Asian | 224 (3.7) | 1,166 (4.9) | 2,261 (6.6) | |
| Hispanic | 1,647 (27.1) | 7,929 (33.1) | 5,928 (17.4) | |
| Other/Not documented | 184 (3.0) | 1,314 (5.5) | 2,083 (6.1) | |
|
| ||||
| Insurance status | <0.001 | |||
| Uninsured/self-pay | 677 (11.2) | 3,711 (15.6) | 2,849 (8.4) | |
| Government-assisted | 3,486 (57.5) | 10,005 (42.0) | 10,441 (30.9) | |
| Private | 1,895 (31.3) | 10,094 (42.4) | 20,461 (60.6) | |
| Missing | 10 | 129 | 272 | |
|
| ||||
| Nulliparous | 2,899 (47.8) | 11,184 (46.7) | 15,777 (46.4) | 0.123 |
|
| ||||
| BMI at delivery (kg/m2) | 32.1 ± 7.2 | 30.9 ± 5.8 | 30.5 ± 5.9 | <0.001 |
|
| ||||
| Diabetes | <0.001 | |||
| None/not reported | 5,452 (89.8) | 22,606 (94.4) | 32,282 (94.9) | |
| Pre-gestational/Gestational | 616 (10.2) | 1,333 (5.6) | 1,741 (5.1) | |
|
| ||||
| Induction of labor | 2,602 (42.9) | 7,095 (29.6) | 11,510 (33.8) | <0.001 |
|
| ||||
| Birth weight (grams) | 3,323 ± 495.0 | 3,404 ± 443.4 | 3,378 ± 433.3 | <0.001 |
|
| ||||
| Year of study | <0.001 | |||
| 2008 | 1,668 (27.5) | 3,571 (14.9) | 10,047 (29.5) | |
| 2009 | 2,136 (35.2) | 8,944 (37.4) | 11,117 (32.7) | |
| 2010 | 1,943 (32.0) | 9,897 (41.3) | 11,092 (32.6) | |
| 2011 | 321 (5.3) | 1,527 (6.4) | 1,767 (5.2) | |
|
| ||||
| Attending years since graduating | <0.001 | |||
| 0–14.9 | 2,726 (44.9) | 10,170 (42.5) | 14,318 (42.1) | |
| 15–24.9 | 1,947 (32.1) | 7,244 (30.3) | 10,213 (30.0) | |
| 25+ | 1,349 (22.2) | 5,978 (24.9) | 9,114 (26.8) | |
| N/A* | 46 (0.8) | 547 (2.3) | 378 (1.1) | |
Data presented as: mean ± standard deviation or n (%)
EFW: estimated fetal weight, BMI: body mass index.
Birth occurred in absence of attending physician (resident, nurse or non-obstetric physician present, or no medical staff present, at delivery)
Overall, cesarean delivery rates were 18.5% in the ultrasound EFW group, 13.4% in the clinical EFW group, and 11.7% in the no documented EFW group (p < 0.001, Table 2). Dystocia was the most frequent indication for cesarean delivery in all EFW groups, followed by non-reassuring fetal heart tracing (Table 2). Compared to women with no documented EFW (referent), the odds of cesarean delivery were 1.71 (95% CI 1.59–1.84) times higher for women with ultrasound EFW, and 1.17 (95% CI 1.11–1.23) times higher for women with clinical EFW, with only modest attenuation of the odds ratios after adjustment for center, year of study, actual birth weight, and other factors associated with cesarean delivery (Table 3).
Table 2.
Rates and Indications of Cesarean Delivery for Groups with and without Fetal Weight Estimation
| Stratum | Ultrasound EFW | Clinical EFW | No documented EFW | P-value* |
|---|---|---|---|---|
|
| ||||
| Overall | (n=6,068) | (n=23,939) | (n=34,023) | |
| Cesarean delivery | 1,124 (18.5) | 3,214 (13.4) | 3,993 (11.7) | <0.001 |
| Indications for cesarean delivery† | <0.001 | |||
| Dystocia | 429 (38.2) | 1,720 (53.5) | 2,168 (54.3) | |
| Non-reassuring fetal status | 415 (36.9) | 1,086 (33.8) | 1,300 (32.6) | |
| Failed induction | 196 (17.4) | 301 (9.4) | 374 (9.4) | |
| Suspected macrosomia | 55 (4.9) | 34 (1.1) | 25 (0.6) | |
| Other | 28 (2.5) | 67 (2.1) | 119 (3.0) | |
| Not reported | 1 (0.1) | 6 (0.2) | 7 (0.2) | |
| No diabetes | (n=5,452) | (n=22,606) | (n=32,282) | <0.001 |
| Cesarean delivery | 944 (17.3) | 2,954 (13.1) | 3,696 (11.4) | |
| Diabetes | (n=616) | (n=1,333) | (n=1,741) | <0.001 |
| Cesarean delivery | 180 (29.2) | 260 (19.5) | 297 (17.1) | |
Data presented as n (%).
EFW: estimated fetal weight
P-values based on chi-square test,
Percentages based on the overall number of cesarean deliveries.
Table 3.
Association Between Fetal Weight Estimation and Cesarean Delivery by EFW Method
| Stratum | Ultrasound EFW | Clinical EFW | No documented EFW |
|---|---|---|---|
|
| |||
| Overall | |||
| OR | 1.71 (1.59–1.84) | 1.17 (1.11–1.23) | 1.0 |
| Adjusted OR* | 1.44 (1.31–1.58) | 1.08 (1.01–1.15) | 1.0 |
| p-value* | <0.001 | 0.017 | |
|
| |||
| No Diabetes | |||
| OR | 1.62 (1.50–1.75) | 1.16 (1.10–1.22) | 1.0 |
| Adjusted OR† | 1.40 (1.27–1.55) | 1.07 (1.01–1.14) | 1.0 |
| p-value† | <0.001 | 0.035 | |
|
| |||
| Diabetes | |||
| OR | 2.01 (1.62–2.49) | 1.18 (0.98–1.42) | 1.0 |
| Adjusted OR† | 1.84 (1.36–2.48) | 1.18 (0.92–1.50) | 1.0 |
| p-value† | <0.001 | 0.190 | |
Data presented as OR (95% CI). No documented EFW is referent group.
EFW: estimated fetal weight, OR: odds ratio, CI: confidence interval.
Adjusted for center, year of study, maternal age, race/ethnicity, insurance status, nulliparity, body mass index, labor induction, actual birth weight, and diabetic status.
Diabetic status removed from multivariable analysis.
In analyzing the subset of women with documentation of estimated fetal weight by category (<3,500, 3,500 to 3,999, and ≥ 4,000 grams), we observed that estimated fetal weights by either method were within 15 percent of actual birth weights in over 75 percent of births. A graphical representation of the correlation between estimated fetal weight and actual birth weight values for each method is provided as supplemental material (Appendix 2, available online at http://links.lww.com/xxx). For both estimation methods, actual birth weight was assigned to the correct estimated fetal weight category in over 70% of births when the estimated fetal weight was <3,500 grams, but in only about 50 percent of births when the estimated fetal weight was between 3,500–3,999 or ≥4,000 grams (Tables 4 and 5). In multivariable analysis, as estimated fetal weight category increased, the odds of cesarean delivery increased for both estimated fetal weight methods, regardless of diabetic status (Tables 4 and 5). For women without diabetes, the odds of cesarean delivery were significantly higher when estimated fetal weight was >3,500 grams by either method (Table 4). Using estimated fetal weight<3,500 grams as the referent group, the aORs of cesarean delivery for women without diabetes were 1.30 (95% CI 1.07–1.59, p=0.010) for ultrasound EFW 3,500–3,999 grams, 2.15 (95% CI 1.55–2.98, p<0.001) for ultrasound EFW ≥4,000 grams, 1.14 (95% CI 1.03–1.27, p=0.011) for clinical EFW 3,500–3,999 grams, and 2.25 (95% CI 1.83–2.78, p<0.001) for clinical EFW ≥4,000 grams (Table 4). We observed the highest odds of cesarean delivery in women with diabetes with EFW ≥4,000 grams obtained by ultrasound. Among women with diabetes, the aOR of cesarean delivery with ultrasound EFW ≥4,000 grams were 9.00 (95% CI 3.65–22.17, p<0.001) using EFW <3,500 grams as the referent group, and 8.72 (95% CI 3.77–20.17, p<0.001) using EFW 3,500–3,999 grams as the referent group (Table 5).
Table 4.
Association Between Fetal Weight Estimation and Cesarean Delivery by EFW Category: Women without Diabetes
| EFW Method | EFW <3,500 g | EFW 3,500–3,999 g | EFW ≥4,000 g |
|---|---|---|---|
|
| |||
| Ultrasound | (n=3,687) | (n=1,413) | (n=352) |
| Referent: <3,500 g | |||
| OR | 1.0 | 1.76 (1.50–2.06) | 3.74 (2.95–4.73) |
| Adjusted OR* | 1.0 | 1.30 (1.07–1.59) | 2.15 (1.55–2.98) |
| p-value* | 0.010 | <0.001 | |
| Referent: 3,500–3,999 g | |||
| OR | -- | 1.0 | 2.13 (1.66–2.73) |
| Adjusted OR* | -- | 1.0 | 1.65 (1.22–2.23) |
| p-value* | 0.001 | ||
| BW within 15% of EFW | 3,111 (84.4) | 1,193 (84.4) | 294 (83.5) |
| BW within EFW category | 3,040 (82.5) | 680 (48.1) | 187 (53.1) |
|
| |||
| Clinical | (n=15,468) | (n=6,341) | (n=797) |
| Referent: <3,500 g | |||
| OR | 1.0 | 1.50 (1.38–1.63) | 3.13 (2.67–3.69) |
| Adjusted OR* | 1.0 | 1.14 (1.03–1.27) | 2.25 (1.83–2.78) |
| p-value* | 0.011 | <0.001 | |
| Referent: 3,500–3,999 g | |||
| OR | -- | 1.0 | 2.09 (1.77–2.47) |
| Adjusted OR* | -- | 1.0 | 1.97 (1.61–2.42) |
| p-value* | <0.001 | ||
| BW within 15% of EFW | 12,520 (80.9) | 5,294 (83.5) | 683 (85.7) |
| BW within EFW category | 11,065 (71.5) | 2,907 (45.8) | 434 (54.5) |
Data presented as OR (95% CI) or n (%)
EFW: estimated fetal weight, OR: odds ratio, CI: confidence interval, BW: birth weight.
Adjusted for center, year of study, maternal age, race/ethnicity, insurance status, nulliparity, body mass index, labor induction, and actual birth weight.
Table 5.
Association Between Fetal Weight Estimation and Cesarean Delivery by EFW Category: Women with Diabetes
| EFW Method | EFW <3,500 g | EFW 3,500–3,999 g | EFW ≥4,000 g |
|---|---|---|---|
|
| |||
| Ultrasound | (n=366) | (n=196) | (n=54) |
| Referent: <3,500 g | |||
| OR | 1.0 | 1.28 (0.87–1.89) | 3.45 (1.93–6.20) |
| Adjusted OR* | 1.0 | 1.03 (0.59–1.81) | 9.00 (3.65–22.17) |
| p-value* | 0.912 | <0.001 | |
| Referent: 3,500–3,999 g | |||
| OR | -- | 1.0 | 2.69 (1.46–4.99) |
| Adjusted OR* | -- | 1.0 | 8.72 (3.77–20.17) |
| p-value* | <0.001 | ||
| BW within 15% of EFW | 316 (86.3) | 169 (86.2) | 44 (81.5) |
| BW within EFW category | 280 (76.5) | 98 (50.0) | 27 (50.0) |
|
| |||
| Clinical | (n=733) | (n=498) | (n=102) |
| Referent: <3,500 g | |||
| OR | 1.0 | 1.38 (1.03–1.85) | 2.55 (1.62–4.03) |
| Adjusted OR* | 1.0 | 1.19 (0.82–1.71) | 1.91 (1.00–3.64) |
| p-value* | 0.356 | 0.049 | |
| Referent: 3,500–3,999 g | |||
| OR | -- | 1.0 | 1.85 (1.16–2.94) |
| Adjusted OR* | -- | 1.0 | 1.61 (0.89–2.90) |
| p-value* | 0.115 | ||
| BW within 15% of EFW | 596 (81.3) | 381 (76.5) | 80 (78.4) |
| BW within EFW category | 552 (75.3) | 197 (39.6) | 50 (49.0) |
Data presented as OR (95% CI) or n (%)
EFW: estimated fetal weight, OR: odds ratio, CI: confidence interval, BW: birth weight.
Adjusted for center, year of study, maternal age, race/ethnicity, insurance status, nulliparity, body mass index, labor induction, and actual birth weight.
Limiting the analyses to nulliparous women, the overall cesarean delivery rates were higher (30.0% in the ultrasound EFW group (n=2,899), 23.7% in the clinical EFW group (n=11,184), and 21.8% in the no documented EFW group (n=15,777), p < 0.001); however, the odds ratios (unadjusted and adjusted) for cesarean delivery were similar to the original analysis. For nulliparous women, the aOR for cesarean delivery were 1.36 (95% CI 1.22–1.51, p<0.001) for ultrasound EFW, and 1.06 (95% CI 0.99–1.14, p=0.085) for clinical EFW, when compared to women with no documented EFW. The results were also similar when stratified by diabetic status (data not shown).
DISCUSSION
In this large, well-characterized cohort of women attempting vaginal delivery at term, we have shown that there is an association between documentation of estimated fetal weight and increased odds of cesarean delivery for both ultrasonographic and clinical estimation, even when controlling for actual birth weight and other potential confounders. These associations were not only statistically significant, but are also clinically relevant. For instance, the adjusted odds of cesarean delivery for women who underwent ultrasonographic estimated fetal weight were approximately 44% higher than the odds of cesarean for women with no documented estimated fetal weight. For both methods, the relationship between estimated fetal weight and cesarean delivery was more pronounced at the highest estimates of fetal weight.
Several authors have evaluated the association of ultrasonographically obtained estimated fetal weight and cesarean delivery.5–10 Past studies were identified by searching the electronic databases Medline, PubMed and the Cochrane Database of Systematic Reviews through March 2016, using the phrases or key words “estimated fetal weight,” “fetal macrosomia,” or “large for gestational age” and “cesarean delivery,” or “cesarean risk.” We also reviewed the reference lists of each article identified in our electronic search for relevant studies. The largest study to date (n=2,329), which excluded women with diabetes, showed that ultrasonographic EFW >3,500 grams obtained within one month of delivery was associated with a significantly increased risk of cesarean delivery independent of actual birth weight.5 More recently, Scifres et al reported that women with gestational diabetes mellitus (GDM) and an ultrasonographic estimated fetal weight that was large for gestational age (LGA) had a significantly increased risk of cesarean delivery when compared to women whose ultrasonographic estimated fetal weight was appropriate for gestational age, even when controlling for birth weight (aOR 3.13, 95% CI 2.10–4.67, p<0.001).10 These same women frequently delivered appropriate for gestational age neonates (191/248, or 77%), revealing the potential bias introduced by the ultrasonographic diagnosis of LGA. Our findings reinforce these prior results, and go further by including comparisons for both ultrasonographically and clinically obtained estimates, stratified by diabetic status.
The principal strength of our report is a large sample size, with data collected using rigorous procedures at multiple centers across the United States. Our study does have several limitations. The data for this analysis were not collected with the explicit purpose of assessing the relationship between estimated fetal weight and cesarean delivery. Although estimated fetal weights were entered into the medical record on the day of delivery admission, the actual date of fetal weight estimation was not recorded. Thus, we were unable to ascertain the exact timing of estimated fetal weight with respect to delivery. However, fetal weight estimates were within 15 percent of birth weights in over 75 percent of births in this analysis group, suggesting that the estimates were obtained in reasonable temporal proximity to delivery. It is also possible that providers caring for women in the “no documented EFW” group had assessed estimated fetal weight but did not record it, or that the accoucheur (who did not necessarily perform the fetal weight estimation) may not even have been aware of it. Finally, it is possible that women with a higher baseline risk of cesarean delivery are more likely to have an estimated fetal weight recorded on admission in labor, creating the potential for bias in our results. In acknowledgement of this possibility, we controlled for many important potential confounding variables in our adjusted analyses. However, it is still possible that women who underwent fetal weight estimation differed in other ways from those who did not, and that those differences might themselves influenced the decision for cesarean delivery.
In this contemporary cohort, we have shown that in women attempting vaginal delivery at term, fetal weight estimation, obtained clinically, and, particularly ultrasonographically, is associated with increased odds of cesarean delivery, regardless of actual birth weight. This analysis, in combination with prior investigations, suggests that the very act of fetal weight estimation may in and of itself lower the threshold for cesarean delivery. Our data suggest that to reduce the rate of primary cesarean delivery, ultrasonographic fetal weight estimation should be employed selectively, for example, only in those circumstances where there is a clinical suspicion of either fetal-pelvic disproportion or significant fetal overgrowth.
Supplementary Material
Acknowledgments
The project described was supported by grants from the Eunice Kennedy Shriver National Institute of Child Health and Human Development (NICHD) (HD21410, HD27869, HD27915, HD27917, HD34116, HD34208, HD36801, HD40500, HD40512, HD40544, HD40545, HD40560, HD40485, HD53097, HD53118) and the National Center for Research Resources (UL1 RR024989; 5UL1 RR025764) and its contents do not necessarily represent the official views of the NICHD, National Center for Research Resources, or the National Institutes of Health.
The authors thank Cynthia Milluzzi, RN, and Joan Moss, RNC, MSN for protocol development and coordination between clinical research centers; Elizabeth Thom, PhDand Madeline M. Rice, PhD for protocol and data management and statistical analysis; and Brian M. Mercer, MD, and Catherine Y. Spong, MD for protocol development and oversight.
Footnotes
Financial Disclosure
The authors did not report any potential conflicts of interest.
The project described was presented at the Society for Maternal-Fetal Medicine’s 36th Annual Pregnancy Meeting, Atlanta, GA. February 1–6, 2016.
References
- 1.Gregory KD, Jackson S, Korst L, Fridman M. Cesarean versus vaginal delivery: whose risks? Whose benefits? Am J Perinatol. 2012;29:7–18. doi: 10.1055/s-0031-1285829. [DOI] [PubMed] [Google Scholar]
- 2.Molina G, Weiser TG, Lipsitz SR, et al. Relationship Between Cesarean Delivery Rate and Maternal and Neonatal Mortality. Jama. 2015;314:2263–70. doi: 10.1001/jama.2015.15553. [DOI] [PubMed] [Google Scholar]
- 3.Osterman MJ, Kochanek KD, MacDorman MF, Strobino DM, Guyer B. Annual summary of vital statistics: 2012–2013. Pediatrics. 2015;135:1115–25. doi: 10.1542/peds.2015-0434. [DOI] [PMC free article] [PubMed] [Google Scholar]
- 4.American College of Obstetricians and Gynecologists, Society for Maternal-Fetal Medicine, et al. Safe prevention of the primary cesarean delivery. Am J Obstet Gynecol. 2014;210:179–93. doi: 10.1016/j.ajog.2014.01.026. [DOI] [PubMed] [Google Scholar]
- 5.Little SE, Edlow AG, Thomas AM, Smith NA. Estimated fetal weight by ultrasound: a modifiable risk factor for cesarean delivery? Am J Obstet Gynecol. 2012;207:309, e1–6. doi: 10.1016/j.ajog.2012.06.065. [DOI] [PubMed] [Google Scholar]
- 6.Blackwell SC, Refuerzo J, Chadha R, Carreno CA. Overestimation of fetal weight by ultrasound: does it influence the likelihood of cesarean delivery for labor arrest? Am J Obstet Gynecol. 2009;200:340, e1–3. doi: 10.1016/j.ajog.2008.12.043. [DOI] [PubMed] [Google Scholar]
- 7.Parry S, Severs CP, Sehdev HM, Macones GA, White LM, Morgan MA. Ultrasonographic prediction of fetal macrosomia. Association with cesarean delivery. J Reprod Med. 2000;45:17–22. [PubMed] [Google Scholar]
- 8.Weeks JW, Pitman T, Spinnato JA., 2nd Fetal macrosomia: does antenatal prediction affect delivery route and birth outcome? Am J Obstet Gynecol. 1995;173:1215–9. doi: 10.1016/0002-9378(95)91356-4. [DOI] [PubMed] [Google Scholar]
- 9.Weiner Z, Ben-Shlomo I, Beck-Fruchter R, Goldberg Y, Shalev E. Clinical and ultrasonographic weight estimation in large for gestational age fetus. Eur J Obstet Gynecol Reprod Biol. 2002;105:20–4. doi: 10.1016/s0301-2115(02)00140-9. [DOI] [PubMed] [Google Scholar]
- 10.Scifres CM, Feghali M, Dumont T, et al. Large-for-Gestational-Age Ultrasound Diagnosis and Risk for Cesarean Delivery in Women With Gestational Diabetes Mellitus. Obstetrics and gynecology. 2015;126:978–86. doi: 10.1097/AOG.0000000000001097. [DOI] [PubMed] [Google Scholar]
- 11.Grobman WA, Bailit JL, Rice MM, et al. Can differences in obstetric outcomes be explained by differences in the care provided? The MFMU Network APEX study. Am J Obstet Gynecol. 2014;211:147, e1–e16. doi: 10.1016/j.ajog.2014.03.017. [DOI] [PMC free article] [PubMed] [Google Scholar]
- 12.Coonrod DV, Drachman D, Hobson P, Manriquez M. Nulliparous term singleton vertex cesarean delivery rates: institutional and individual level predictors. Am J Obstet Gynecol. 2008;198:694, e1–11. doi: 10.1016/j.ajog.2008.03.026. discussion e11. [DOI] [PubMed] [Google Scholar]
Associated Data
This section collects any data citations, data availability statements, or supplementary materials included in this article.