Abstract
Purpose
To describe the enlargement of the dense scotoma over time in Stargardt disease, and to highlight methodological issues in tracking enlargement.
Methods
Retrospective study of patients with full mapping of the border of the dense scotoma using the MP-1 for at least two visits.
Results
Fourteen eyes of 7 patients met this criterion. Patients had median of 3 visits (range 2 to 5), with median total f/u of 4.5 years (range 1.5-8). Mean baseline visual acuity was 20/56 (range 20/25-20/200), mean baseline dense scotoma area was 2.23mm2 (range 0.41-5.48), and mean dense scotoma enlargement rate was 1.36mm2/year (range 0.22-2.91). The younger patients tended to have more rapid loss of visual acuity, which tended to plateau when the VA was 20/100 or worse. The patients who developed Stargardt before age 20, and the single patient who developed Stargardt disease after age 40, had more rapid enlargement rates, with preservation of central vision in the oldest patient. The ability to precisely define the dense scotoma area was dependent upon the density location of the points tested; this led to significant variability in the assessment of the scotoma enlargement rate in 3 of the 7 patients. The dense scotoma was not described adequately by the extent of the homogeneous dark area on fundus autofluorescence imaging.
Conclusion
Microperimetry is necessary for mapping the scotoma in patients with Stargardt disease, since current imaging is not adequate. Standardized grid testing, plus a standardized procedure for refining the border of the dense scotoma, should allow more precise testing and longitudinal assessment of enlargement rates.
Keywords: Stargardt disease, microperimetry, natural history
At first glance, one would think that Stargardt disease, the most common form of macular degeneration in young people, should be easy to approach in terms of designing clinical trials to treat it. It is essentially a one gene disease, unlike retinitis pigmentosa, and unlike complex conditions such as age-related macular degeneration. Stargardt disease is an autosomal recessive condition, and at least 75% of patients have the ABCA4 gene involved, an association which was first reported in 1997.1 The function of the ABCA4 gene product is known; it is a transporter protein involved in transporting retinoids so they may be ‘unbleached’ and used again in the visual cycle. 2 When the gene is defective, the retinoids accumulate in the photoreceptor outer segments and dimerize to form A2E, a component of lipofuscin which is found in the retinal pigment epithelium (RPE) at high levels, due to the difficulty of degrading A2E when the outer segment disks are phagocytized by the RPE. A2E can cause oxidative damage, and, whether due to its presence or another cause, at some critical time the RPE begins to atrophy with consequent photoreceptor loss and development of scotomas. There is an ABCA4 knockout mouse model, in which there is increased lipofuscin accumulation as in human Stargardt disease, and preclinical studies have shown that gene therapy3 and also raising the mice in the dark are associated with less lipofuscin accumulation. However, mice do not develop a similar macular degeneration, due perhaps to the structure of the mouse retina lacking a macula or to another unknown factor. There already are gene therapy4 and stem cell clinical trials5, enrolling patients with very advanced disease. However, the important issue of defining endpoints to track disease progression remains a difficult one in Stargardt disease.
A comparison to advanced atrophic age-related macular degeneration, or geographic atrophy (GA), helps to understand the greater difficulty of studying Stargardt disease. In GA, the visible atrophic lesion corresponds to the dense scotoma that is present, so measuring the enlargement of atrophy over time, whether by fundus photography or by fundus autofluorescence, is essentially identical to repeated mapping of the area of dense scotoma.6,7 Measuring of the enlargement rate of the atrophy in GA is equivalent to measuring the dense scotoma and thus is meaningful as a primary outcome measure for GA clinical trials. 8 While geographic atrophy’s pathophysiology and its genetic associations are still not well-understood, its progression and visual loss in terms of its dense scotoma can be followed in a reproducible and straightforward manner. Unlike GA from age-related macular degeneration, in Stargardt disease the dense scotoma is often much larger than the atrophic lesion seen on imaging with fundus photographs, fundus autofluorescence, or fluorescein angiography.7,9 This is not a transient phenomenon, in the sense of the appearance of atrophy eventually ‘catching up’ to the dense scotoma. Figure 1a shows the fundus photograph and microperimetry of an eye with Stargardt disease in 2006, in which the dense scotoma extends past the atrophic lesion. In 2014 (figure 1b), the dense scotoma is now far larger than the atrophic lesion imaged by fundus autofluorescence or fundus photography. Defining the progression by measuring the atrophic lesion yields a significant underestimate of the full extent of visual loss. There is, in addition to the homogeneously dark area of loss of autofluorescence, a large surrounding region of mottled loss of autofluorescence, but for this patient the mottled region is larger than the dense scotoma and therefore also does not demarcate the area of visual loss. This lack of matching of the dense scotoma with visible atrophy necessitates the use of microperimetry for following visual loss.
Figure 1.
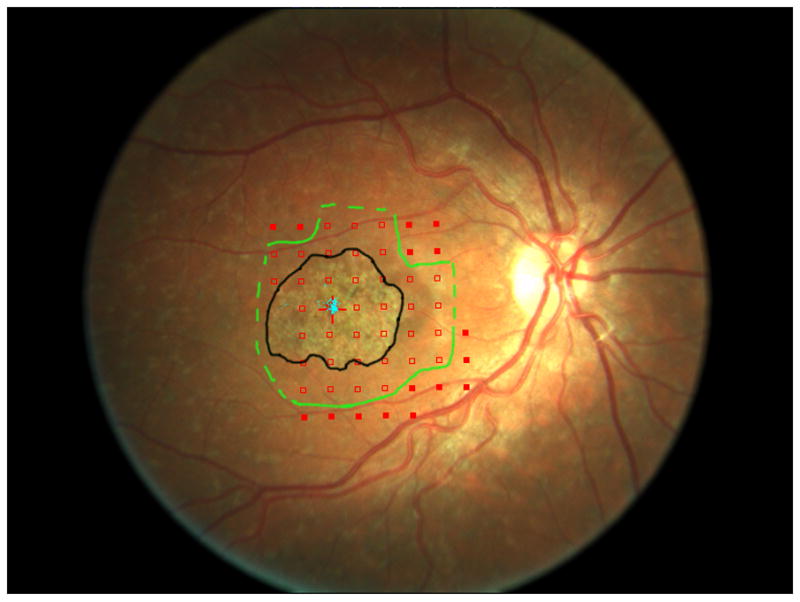
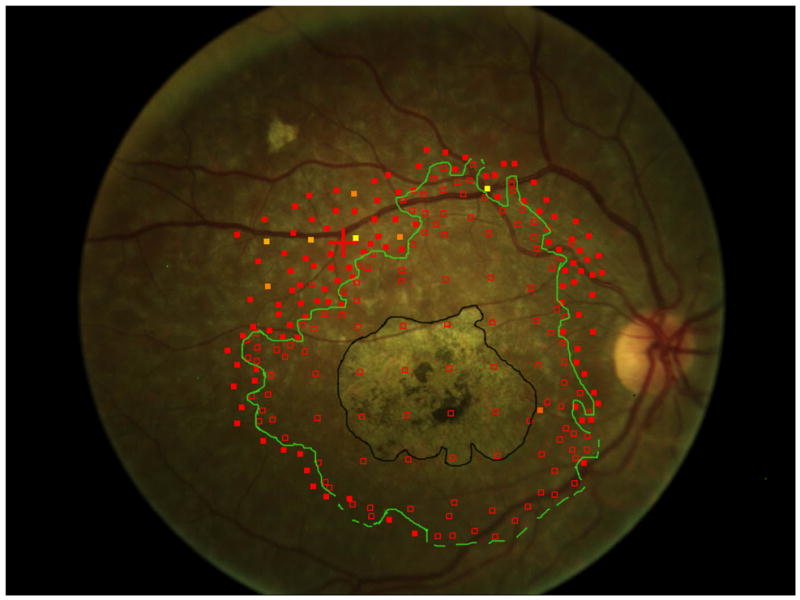
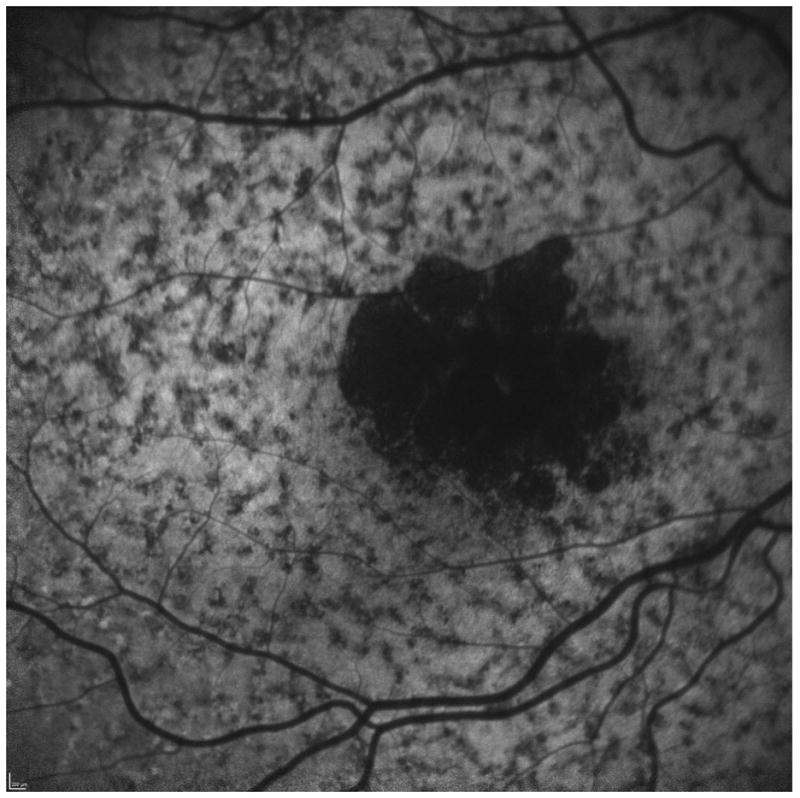
The area of the dense scotoma greatly exceeds the visible atrophic lesion.
a. In 2006, the atrophy visible on the fundus photograph (outlined in black) measured 4.5 mm2. The margins of the dense scotoma are outlined in green, with a dotted line indicating that the dense scotoma extended at least to the edge of the tested region (and could thus be larger than indicated by the dotted line). The area of definite dense scotoma measured 11.7 mm2. At this time, the patient had visual acuity of 20/40, with stable central fixation (blue dots) in a tiny spared central area.
b. Eight years later, the atrophy on the fundus photograph (outlined in black) measured 8.9 mm2. The area of the dense scotoma (outlined in green, with a dotted line indicating that the dense scotoma extended at least to the edge of the tested region) has enlarged more dramatically, with the definite dense scotoma measuring at least 31.5 mm2. Fixation is eccentric, with visual acuity 20/96.
c. The fundus autofluorescence image at 8 years. The homogeneously dark area corresponds to the visible atrophy. There is extensive mottled loss of autofluorescence; this mottled area includes the area of dense scotoma but extends further peripheral into seeing retinal areas, so it does not define the dense scotoma area.
There also is a second confounding issue in Stargardt disease. When the fovea is atrophic, the patient must use an eccentric fixation site. In GA from age-related macular degeneration, fixation generally is placed at the edge of the atrophy and corresponding dense scotoma; teleologically this would be an effort to place fixation as close as possible to the fovea to maximize visual acuity. Surprisingly, in Stargardt disease, fixation behavior is different. Patients often place fixation remote to the edge of the dense scotoma.10 That is, there is intervening seeing retina (often with good sensitivity, figure 2) between the edge of the dense scotoma and the fixation site. Patients fixate further away from the fovea than would seem to be needed, with presumed lower visual acuity than if fixation were placed at the edge of the scotoma. The reason for this is not yet clear; the intervening area with good retinal sensitivity often has the mottled FAF character, and perhaps resolution is not as good here as further peripheral. In any event, while knowing the fixation site in GA provides information about the edge of the dense scotoma, the fixation site in Stargardt disease does not provide similar information.
Figure 2.
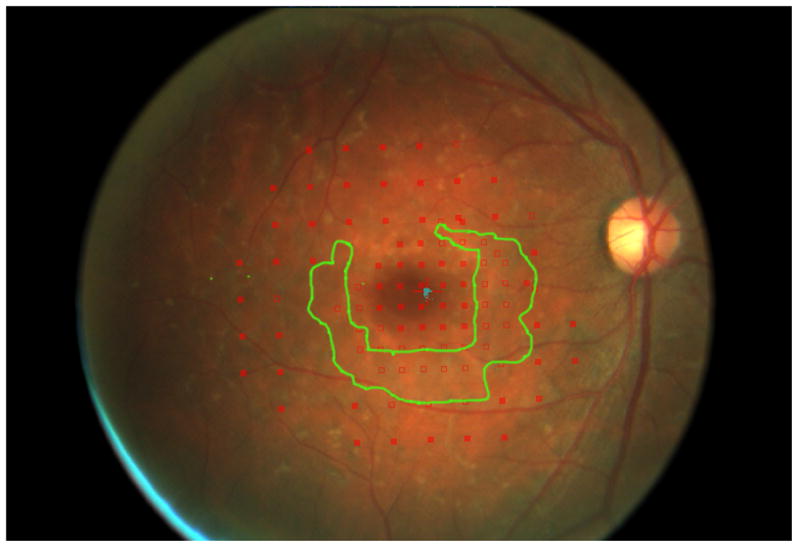
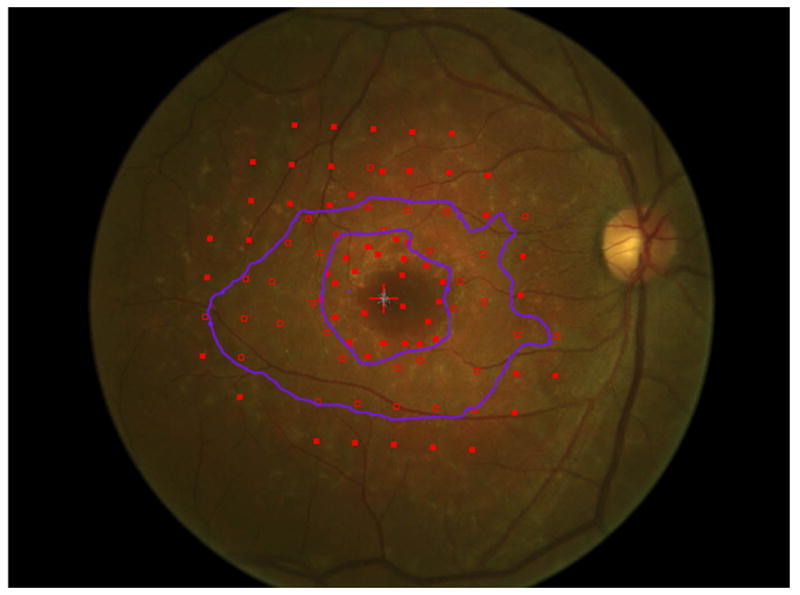
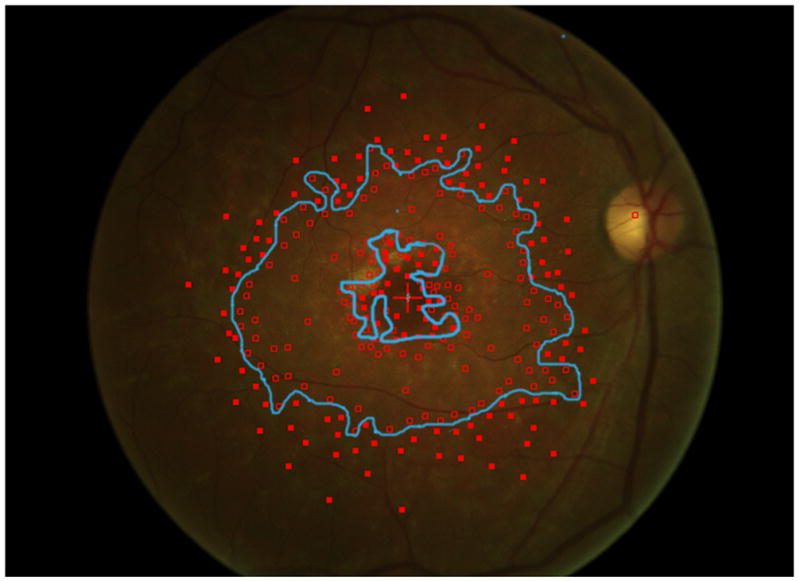
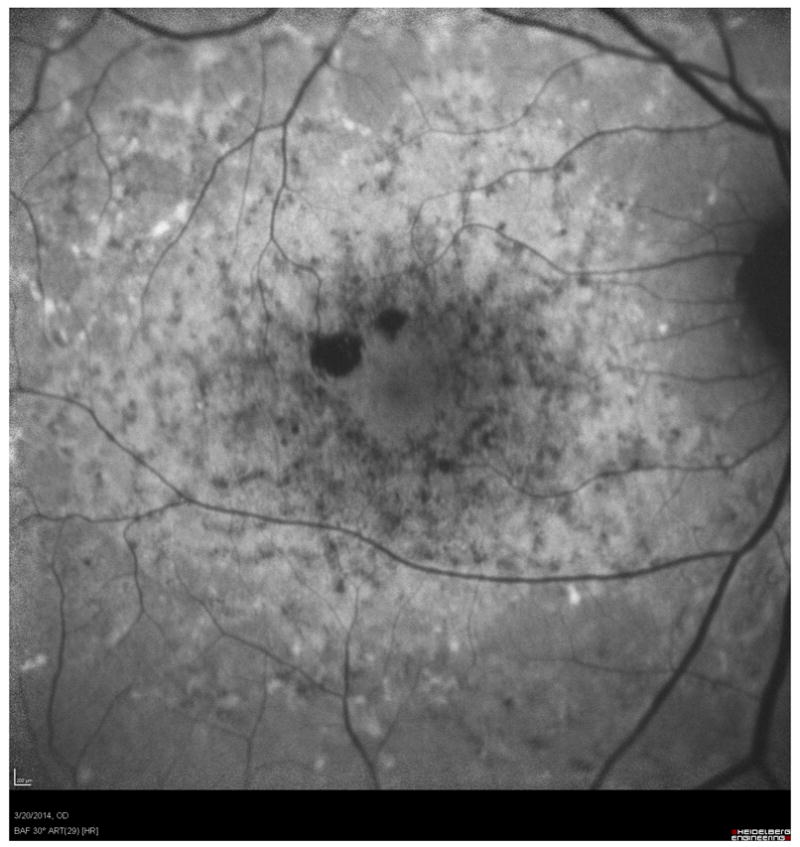
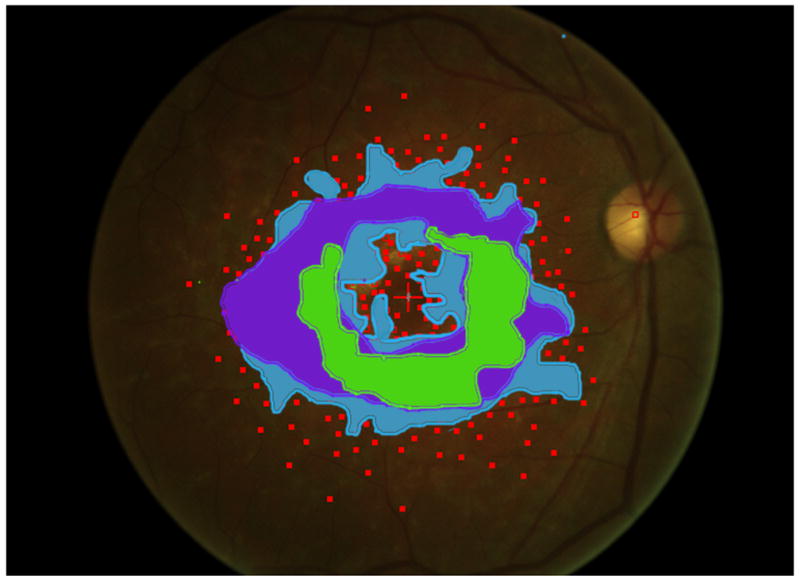
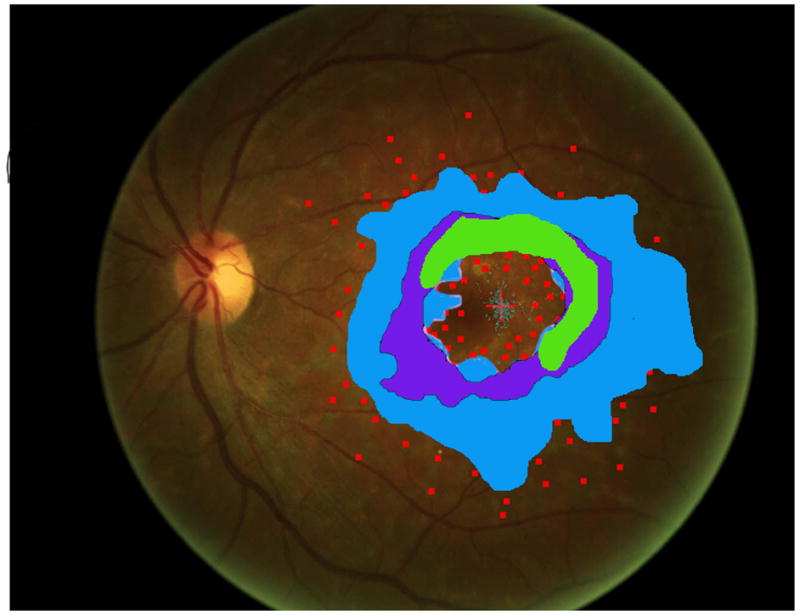
Mapping the dense scotoma. This 50 year old patient (patient 7 on the table and other figures) had a partial macular ring scotoma at baseline (a), which evolved into a ring scotoma 3 years later (b). At the last visit, 8 years after baseline, (c), there is a larger macular ring scotoma with preservation of the foveal region. Fundus autofluorescence done at the time of the last visit (d) shows only two small homogeneously dark areas. The rest of the image, although abnormal, does not provide information as to where scotomas might be. Figures e and f show the dense scotoma as solid filled areas colored based on the year tested for the right eye and left eye respectively. There is still sparing of both foveas, with greater sparing in the left eye.
Microperimetry thus is indispensable as a tool for assessing visual function in Stargardt disease. However, the testing can be tedious and fatiguing for the patient. Mapping just the dense scotoma (i.e. finding the area not seeing the brightest stimulus, but not doing threshold perimetry) is a rapid procedure. Mapping can be very precise, depending upon the amount of testing performed, the density of points tested, and the skill of the technician. But the mapping does not lend itself to repeat testing; if the dense scotoma enlarges, one would now want to concentrate test points further peripheral, not at the edges of the scotoma in the previous mapping, to capture the new border. Nonuniform density of points tested does not lend itself to quantifying the amount of enlargement in a systematic way. For a clinical trial, such as the current ProgSTAR natural history study of Stargardt disease, a standardized grid (such as a 10-2), positioned in a standardized manner (e.g., centered on the fovea, even if it is nonseeing), and tested with threshold microperimetry, allows comparisons from visit to visit and between patients, but at the expense of not defining the full area of atrophy. A combination of mapping the edge of the dense scotoma, and quantifying retinal sensitivity in a pre-specified manner at the border of the dense scotoma would maximize the information obtained regarding progression of vision loss. However, the threshold testing takes much longer and is fatiguing to the patient.
As part of the clinical assessment and follow-up of patients with Stargardt disease, dense scotoma mapping was often performed in our service. The mapping generally focused on the superior border of the scotoma, closest to the eccentric superior fixation site. For some patients, a full mapping of the dense scotoma was performed and a rate of enlargement of the dense scotoma could be calculated. This paper presents these results, explores the variability involved in dense scotoma mapping, and recommends a border dense scotoma mapping coupled with a grid threshold mapping.
METHODS
A retrospective review of charts of patients with Stargardt disease followed at the Greater Baltimore Medical Center (GBMC) was conducted. The review was approved by the GBMC Institutional Review Board and complies with the Declaration of Helsinki. Patients with Stargardt disease who had Nidek MP-1 (Nidek, Inc., Fremont, CA) microperimetry testing that defined fully the borders of the dense scotoma (Goldmann III stimulus, 0dB intensity) on at least two visits were identified. Twelve patients had extensive mapping of the dense scotoma; for seven patients (14 eyes) the full boundary of the scotoma was mapped, so that an enlargement rate could be determined, and these patients are the subject of this report. Median followup was 4.5 years (range 1.5 to 8.0), and median number of testing sessions was 3 (range 2-5). The patient illustrated in figure 1 did not qualify for the main analysis because the full extent of the dense scotoma was not captured in the initial testing.
Microperimetry testing was generally done as follows. An image of the fundus was captured. The ‘semiautomated’ mode of defining the testing grid was used. In this mode, the operator defines a polygon enclosing the area of desired testing, and can specify the number (or density) of points to be tested. Based on this, the software defines a grid with the desired number of points. Testing using the 0 dB stimulus was performed, with automated tracking of the retina and correction for eye movements. On completion of the grid testing, the operator is offered the option of adding points to refine the perimetry. Testing is then expanded by more intensive testing in the region between the nonseeing and seeing areas. If the initial grid did not extend to the edge of the dense scotoma, additional more peripheral points could be tested. In subsequent years, the same pattern as the first year could be used, which included all previously added points, or completely new testing could be performed.
The areas with dense scotoma were outlined, and the area was measured using Photoshop CC. The area in pixels was converted to mm2 on the retina, by calibrating a line from the foveal center to the center of the disc to be 4.5mm. If there were central spared seeing areas within the outlined area, the spared area was subtracted from the total outlined area. The symbol used for the stimulus is slightly smaller than the actual size of the stimulus. If the edges of the dense scotoma were intensively mapped (‘tight mapping’), there was little variability in terms of where to draw the line enclosing the dense scotoma. However, if there was less thorough mapping of the edges of dense scotoma (‘loose mapping’), there was great variability in terms of where to draw the boundary, and in calculation of area and enlargement rate.
Because the dense scotoma can only be quantified by measurement (i.e. does not correspond to an obvious fundus appearance that can be drawn in a continuous fashion), the delineation of the scotoma size for each eye is limited by the density of discrete points used for testing. Since this was a retrospective study, no specific effort had been made to precisely quantify the dense scotoma, except for patient 6 who participated in a separate study requiring good quantification. For each eye at each visit then, the minimum and maximum possible areas of dense scotoma were drawn (see figure 5 below). If there was some compelling reason to define a specific border between these as the best estimate, that drawing was used as the best estimate of the dense scotoma area. If there was no specific reason to define a boundary in a particular way, the best estimate of the dense scotoma area was taken as the average of the minimum and maximum areas.
Figure 5.
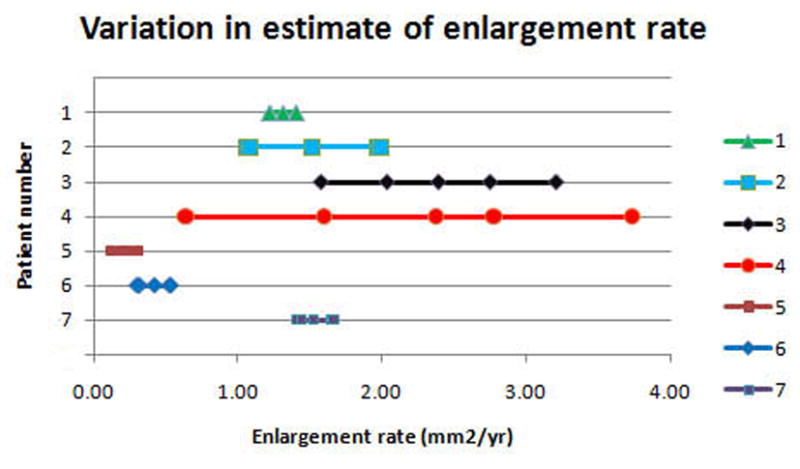
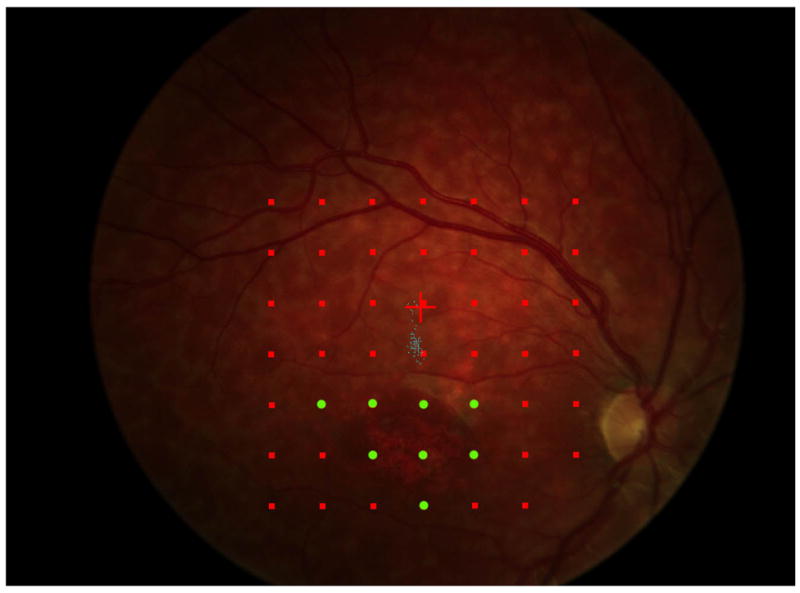
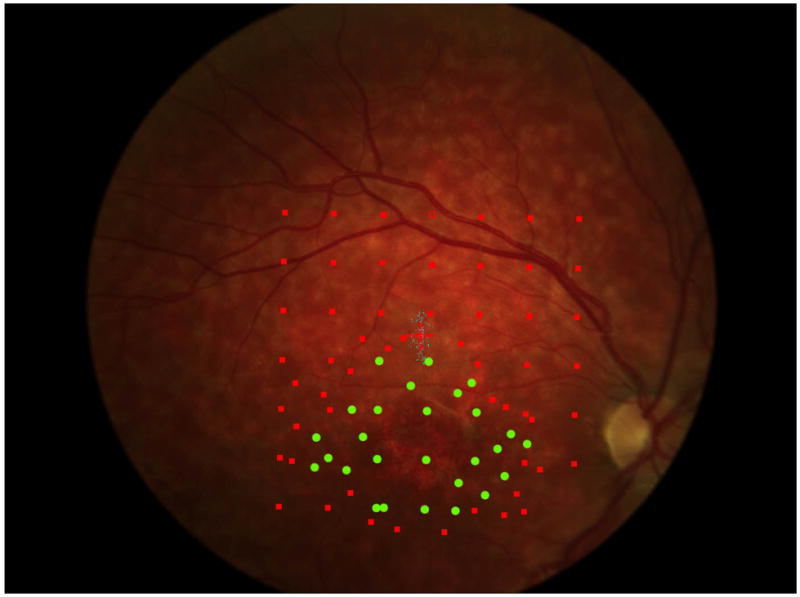
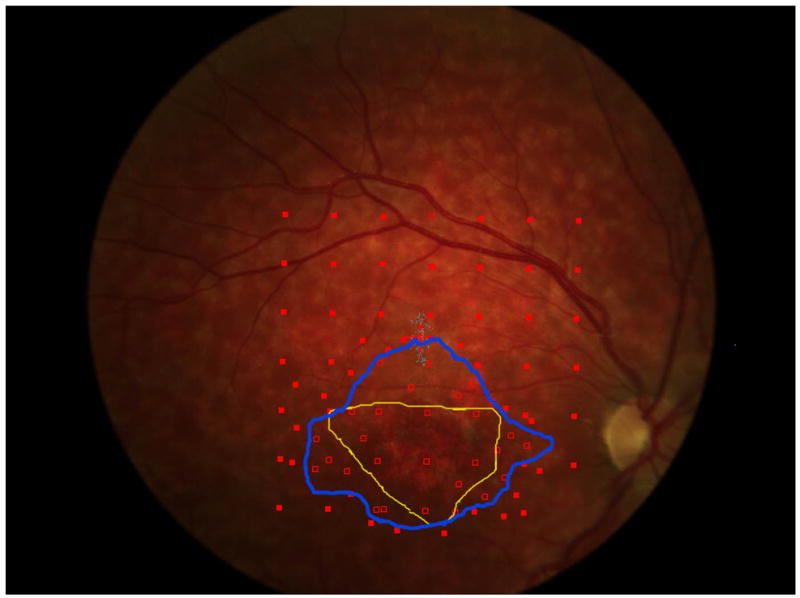
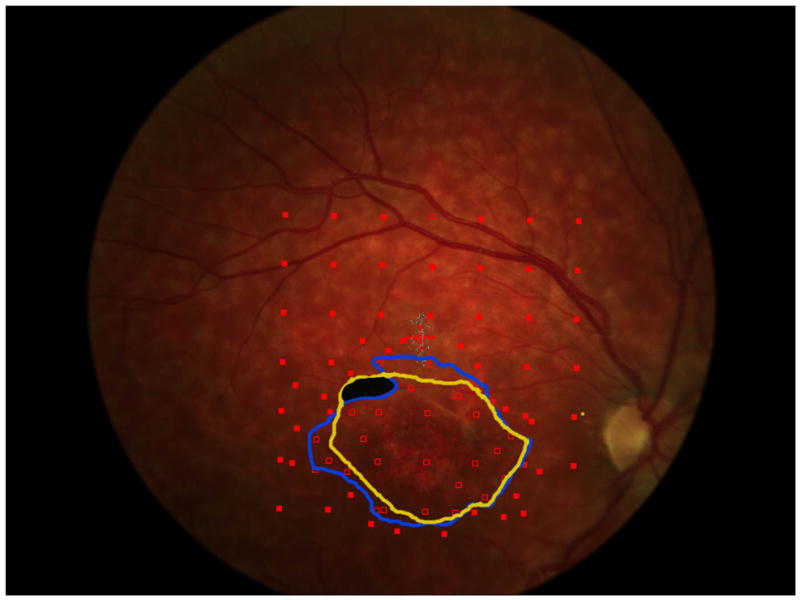
a. The precision of the estimate of enlargement rate depends upon how closely packed the stimulus sites were. For the right eye of each patient, 5 points are plotted (some are overlapping in the figure): the best estimate enlargement rate, maximum and minimum enlargement rates, and largest and smallest enlargement rates (see methods for definitions). Patients 1, 5, 6, and 7 show little difference among the estimates of enlargement rate. Patient 4 shows a large difference between the various enlargement rates.
b and c show, respectively, the initial and final microperimetry findings for patient 4. The nonseen points, normally displayed as hollow red symbols, are denoted by green circles for better visualization. The final testing used the grid of the initial testing as a starting point, and additional points were added to refine the border of the scotoma. Figure 5d shows the largest enlargement rate, defined as the slope using the minimum estimate of area at the initial visit and the maximum estimate of area at the final visit. Figure 5e shows the smallest enlargement rate, defined as the slope using the maximum estimate of area at the initial visit and the minimum estimate of area at the final visit. There is less difference in the final area estimates in regions where the testing was more thorough. The black shaded area defines a region that was not tested at either visit and is indeterminate in terms of its seeing status.
The drawings outlining the dense scotoma were first made for each visit independently. Once the borders were drawn, side by side comparison was performed and information gleaned at one visit was used to improve the drawing of the border at previous and subsequent visits. For example, if there was only a loose mapping at one visit, and the subsequent visit showed a retinal site that was not tested at the first visit that was still seeing, the edge drawing at the first visit was modified to reflect the seeing retinal area. Similarly, if the first visit showed a site to have a dense scotoma, and the subsequent visit did not test that point, it was assumed to have a dense scotoma at the second visit as well and the drawing was modified accordingly. Once these adjustments were made, the area of dense scotoma for each visit was calculated, and the rate of enlargement of the dense scotoma area was calculated by linear regression.
An estimate of the range of enlargement rates for each eye due to the tightness or looseness of the mapping was performed. The best estimate rate of enlargement rate was calculated by linear regression of the best estimates of dense scotoma area over time. To get a sense of the variability, for each eye four other enlargement rate estimates were made. The maximum enlargement rate used the maximum area for all visits, and the minimum enlargement rate used the minimum area for all visits, to compute the enlargement of the scotoma over time. Two additional slopes were calculated using only the first and last visit: the largest enlargement rate, using the minimum area at the first visit and the maximum area at the last visit; and the smallest enlargement rate, using the maximum area at the first visit and the minimum area at the last visit. The best estimate, minimum and maximum enlargement rates were computed using all visits, while the smallest and largest enlargement rates used only the first and last visits as described above.
Statistical analyses were performed using Microsoft Excel and JMP (SAS Institute, Cary, NC). Linear regression was used for calculating the enlargement rate of the dense scotoma. Descriptive statistics are used for presenting the data, particularly given the small number of patients. The large variation in estimation of scotoma area, and thus in calculating the enlargement rate, is illustrated by figure 5 below.
RESULTS
Both eyes of 7 patients qualified for entry into this analysis. Table 1 provides information about these patients and the status of their Stargardt disease, and Table 2 compares initial and final visual acuity and areas of dense scotoma. Four patients (young group) were younger than 20 with onset of disease beginning at age 9 or later. Two patients (middle group) were in their twenties, and had first developed symptoms in their twenties as well. One patient (older group) was 50 years old, and was diagnosed 5 years previous to her visit. Median length of f/u was 3.9 years (range 1.5 to 8), and median number of visits was 3 (range 2 to 5). The three patients in the middle and older group all had VA at the first visit better than 20/50 in each eye, while in the younger group two patients had VA worse than 20/100 in each eye at the first visit. At the final visit, 3 of 4 patients in the young group met legal blindness criteria, both patients in the middle group had moderately impaired visual acuity, and the patient in the older group maintained VA of 20/25+ in each eye. The mean absolute difference in VA between eyes of each patient was 1.2 lines (0.12 logMAR) at baseline, and 2 letters (0.04 logMAR) at the final visit.
Table 1.
Age, follow-up, mutation, ERG
| Pt number | Age symptoms first reported | Age at initial GBMC visit | Length of f/u at GBMC | Mutation | ERG |
|---|---|---|---|---|---|
| 1 | 13 | 13.4 | 5.1 | c.634C>T | Normal scotopic; abnormal photopic |
| c.1622T>C | |||||
| c.3113C>T | |||||
| 2 | 9 | 14.4 | 3.7 | R1108C | Normal both |
| IVS38-10T>C | |||||
| 3 | 11 | 15.0 | 2.9 | P1380L | no record |
| L1940Q | |||||
| 4 | 12 | 17.8 | 1.5 | not done | no record |
| 5 | 23 | 23.4 | 3.9 | c.6329G>A | Normal both |
| c.302+1G>A | |||||
| 6 | 27 | 29.2 | 6.1 | c.4793C>A | Normal both |
| c.5882G>A | |||||
| c.3758C>T | |||||
| 7 | 41 | 50.9 | 8.0 | c.5584+14G>A | Normal both |
| c.5018+8A>G |
GBMC is Greater Baltimore Medical Center, f/u is follow-up
Table 2.
Visual acuity, scotoma area, and scotoma enlargement rate
| Pt number | logMAR VA 1st visit (Snellen) RE | logMAR VA 1st visit (Snellen) LE | logMAR VA final visit (Snellen) RE | logMAR VA final visit (Snellen) LE | Dense scotoma area 1st visit RE (mm2) | Dense scotoma area 1st visit LE (mm2) | Dense scotoma enlargement rate RE (mm2/year) | Dense scotoma enlargement rate LE (mm2/year) |
|---|---|---|---|---|---|---|---|---|
| 1 | 0.44 (20/50-) | 0.30 (20/40) | 0.96 (20/200+) | 1.02 (20/200-) | 0.55 | 0.27 | 1.31 | 0.67 |
| 2 | 0.34 (20/50+) | 0.58 (20/80+) | 0.82 (20/160+) | 0.78 (20/120+) | 1.11 | 0.41 | 1.51 | 0.91 |
| 3 | 0.98 (20/200+) | 1.10 (20/240+) | 1.08 (20/240+) | 0.94 (20/160-) | 2.96 | 3.08 | 2.39 | 2.42 |
| 4 | 0.86 (20/160+) | 0.78 (20/120) | 0.90 (20/160) | 0.90 (20/160) | 6.91 | 5.44 | 2.38 | 2.91 |
| 5 | 0.14 (20/25-) | 0.34 (20/40-) | 0.74 (20/100-) | 0.72 (20/100-) | 0.78 | 0.89 | 0.22 | 0.48 |
| 6 | 0.32 (20/40-) | 0.36 (20/50+) | 0.68 (20/100+) | 0.64 (20/80-) | 0.77 | 0.52 | 0.42 | 0.39 |
| 7 | 0.04 (20/20-) | 0.06 (20/25+) | 0.08 (20/25+) | 0.08 (20/25+) | 5.48 | 2.1 | 1.53 | 1.56 |
| Mean | 0.45 (20/56) | 0.50 (20/63) | 0.75 (20/112) | 0.73 (20/107) | 2.65 (2.58) | 1.82 (1.90) | 1.39 (0.85) | 1.33 (1.00) |
| Median | 0.34 (20/44) | 0.36 (20/46) | 0.82 (20/132) | 0.78 (20/120) |
logMAR VA is visual acuity expressed as the log of the minimum angle of resolution. Snellen VA is in parentheses.
Parentheses for mean dense scotoma area and mean scotoma enlargement rate enclose the standard deviation
Figure 2 shows the progressive enlargement of the dense scotoma in patient 7. This patient had a partial macular ring scotoma at the first visit, which enlarged into a complete ring scotoma and then progressively enlarged over the 8 years of follow up, while still preserving the fovea. Fundus autofluorescence (FAF) (figure 2d), performed at the final visit, shows only two small areas of homogeneous loss of autofluorescence; although the FAF image is abnormal throughout, it has no specific feature that corresponds to the dense scotoma. Figures 2a and 2b show somewhat ‘loose’ delineation of the dense scotoma borders, because a grid was used without further points added to define the scotoma edge. Figure 2c shows ‘tight’ delineation of the dense scotoma borders, but no grid coverage of the entire lesion, so that there could conceivably be undetected spared seeing areas within the border of the dense scotoma.
Figure 3 shows the progressive enlargement of the dense scotoma in patient 6. This patient participated in a previous study of remapping of the visual cortex in macular disease (NIH R03 EY14145), and had a complete mapping of his dense scotoma and seeing area (figure 3e). The small size of the lesion facilitated this complete mapping. This patient had only a small enlargement of his dense scotoma over time, but he lost foveal fixation, and visual acuity fell, from 20/40- RE and 20/50+ LE, to 20/100+ RE and 20/80- LE at the last visit, 6 years after the initial visit. In this case the fundus autofluorescence (figure 3f), shows a mottled area corresponding roughly to the dense scotoma, but it is not homogeneously dark.
Figure 3.
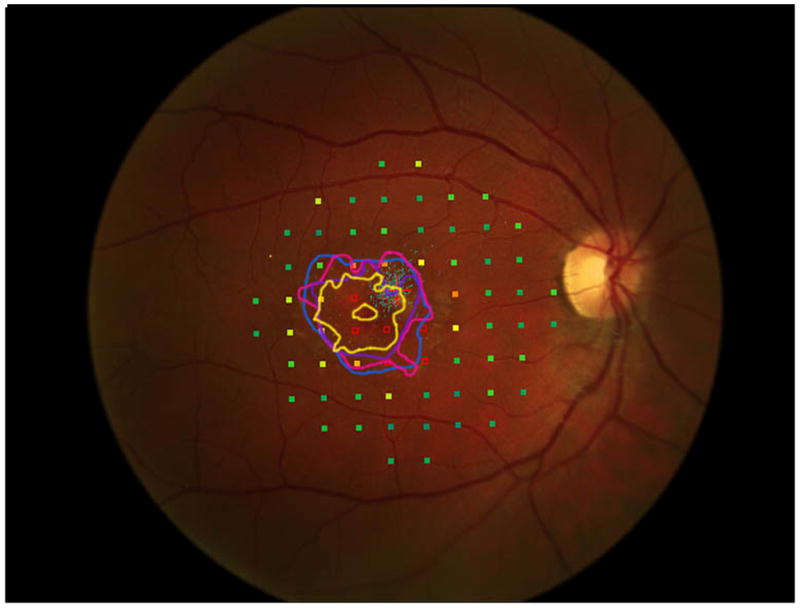
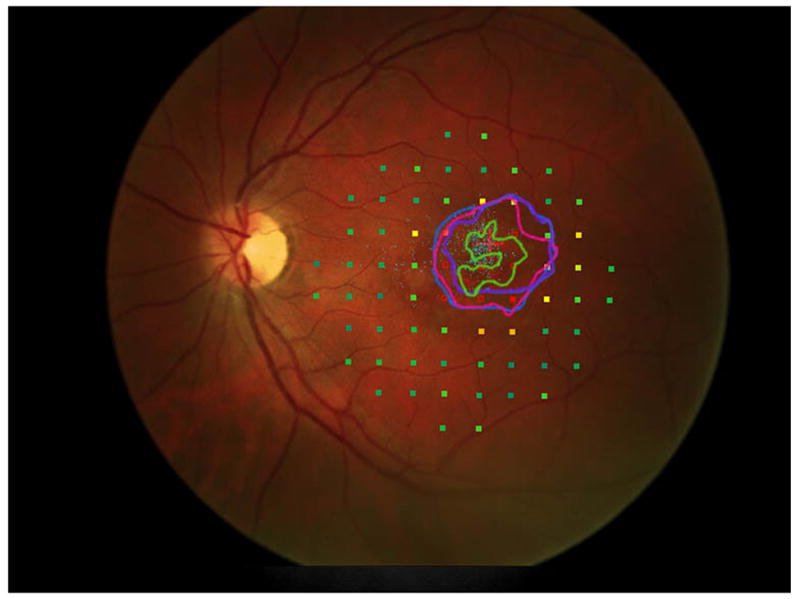
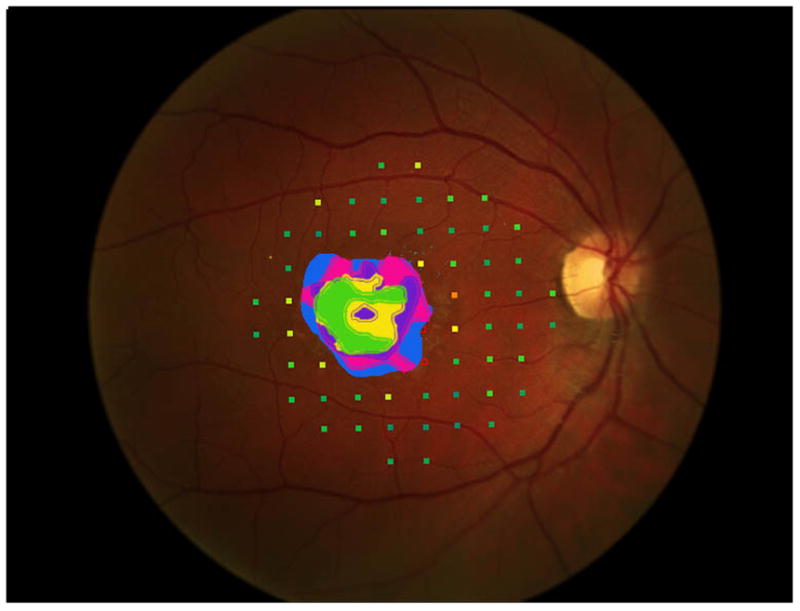
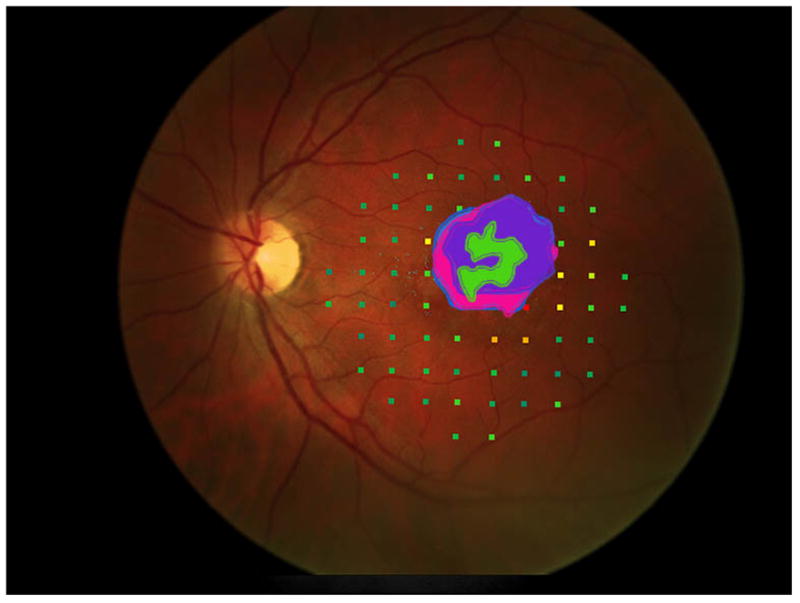
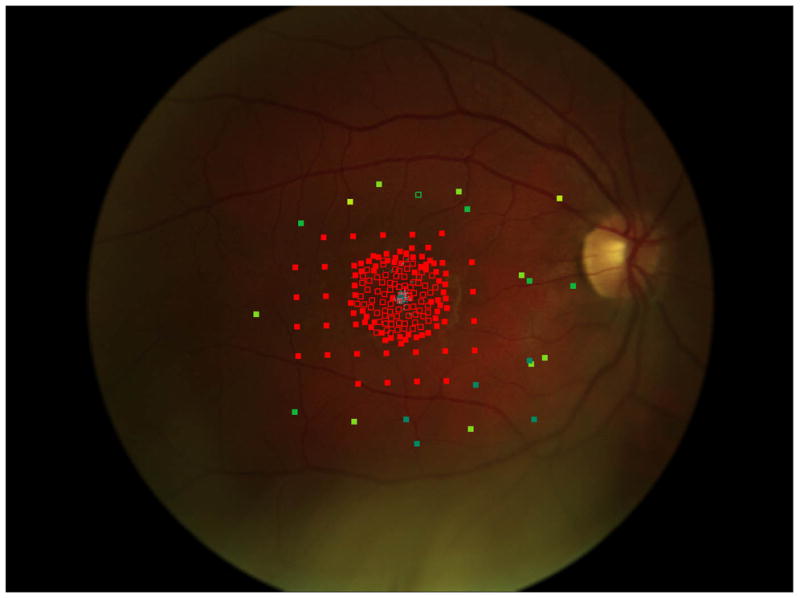
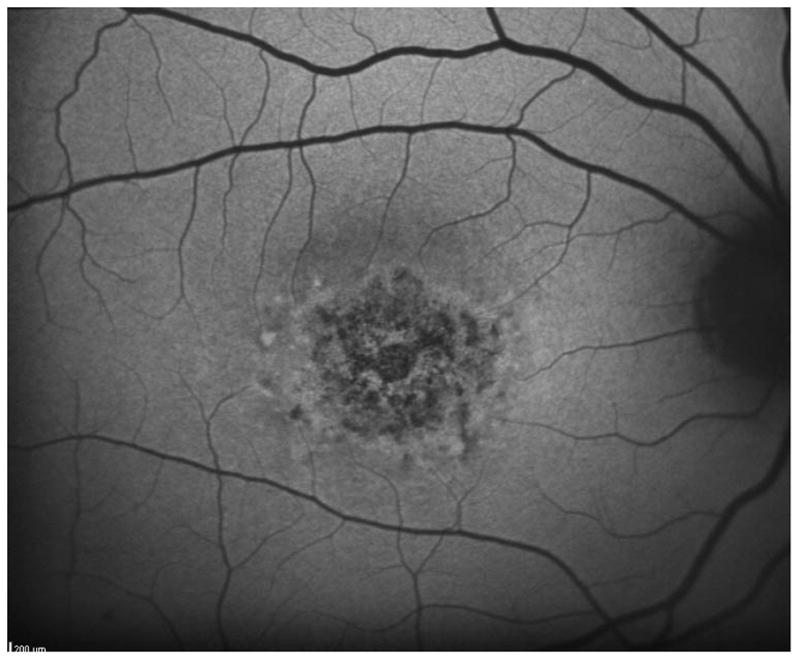
This 29 year old man had visual acuity of 20/40- right eye and 20/50+ left eye at baseline, when he had a macular ring scotoma RE and a partial ring scotoma (horseshoe) left eye. Over the succeeding 6 years, he lost foveal fixation, but had only a small degree of enlargement of the dense scotoma. Panels a and b show the outlines of the dense scotoma, and figures c and d show the scotomas filled in. Panel e shows a very good ‘tight’ mapping of both the borders of the scotoma and within the scotoma itself. Panel f shows a nonhomogeneous loss of autofluorescence, with some increased autofluorescence as well. The small dark areas do not explain the extent of the dense scotoma.
Figure 4a shows, for the right eye of each patient, the best estimate of the dense scotoma enlargement over time, with the x axis representing the age of the patient and the y axis representing the size of the area of dense scotoma. For this patient group, the 4 patients below 20 years of age had rapid enlargement of the scotoma, the 2 patients between 20 and 40 had low rates of enlargement of the dense scotoma, and the patient over 50 showed a rapid dense scotoma enlargement rate. Figure 4b shows the visual acuity as a function of age for each of the patients. Only the oldest patient had little worsening of visual acuity over time and retained 20/25 VA.
Figure 4.
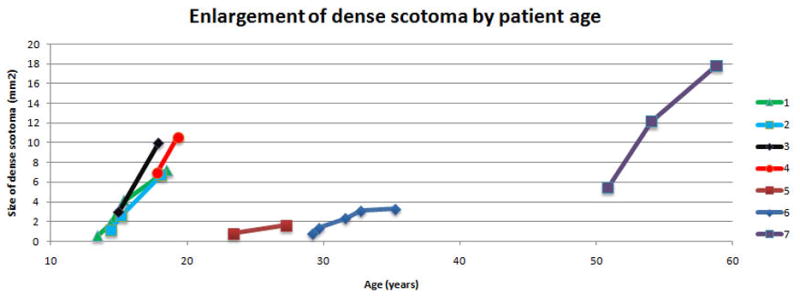
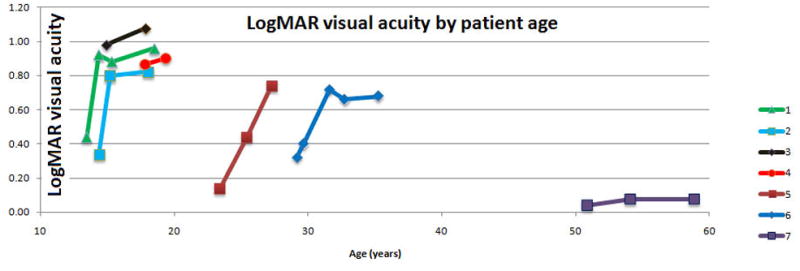
Progression of Stargardt disease over time
a. For the right eye of each of the patients, the area of dense enlargement is plotted as a function of age, using the best estimate of area at each visit. The four patients younger than 20 progressed rapidly, while the two patients between 20 and 40 had only a slow rate of enlargement. The oldest patient (figure 2) had progressive rapid enlargement of the dense scotoma, despite having preservation of good visual acuity throughout.
b. For the right eye of each of the patients, the logMAR visual acuity is plotted as a function of age. The 4 patients below 40 who started with VA of 20/50 or better had loss of VA to 20/80 or worse. Only the oldest patient had little worsening of visual acuity over time. For patients 1, 2, and 6, a rapid worsening occurred until visual acuity reached around 20/80, when the visual acuity loss slowed.
Figure 5 shows the inherent difficulty in using this type of dense scotoma mapping as an outcome measure in a clinical trial for Stargardt disease. While it is much more rapid than doing threshold grid mapping, the precision of the estimate of dense scotoma area is dependent upon the skill of the technician and the density of points tested, which may vary from visit to visit. For the 7 patients who had delineation of the full boundary of atrophy, five enlargement rates were calculated as described above and are shown arrayed in a horizontal line for each patient (all five rates may not be seen because they may overlap). For patients 1, 5, 6, and 7, the estimates are all very close to one another, while for patients 2, 3, and 4, there was a large variation among the estimates.
Table 2 compares the ’best estimate’ area and enlargement rate of the two eyes of each patient. The mean enlargement rate for all eyes was 1.36 mm2/year. The mean absolute difference in dense scotoma enlargement rates between eyes was 0.30 mm2/year, significantly more concordant than the baseline areas, which had a mean absolute difference in size of 0.90 mm2. The degree of detail used to test each eye may differ between eyes and may be an artifactual source of difference between the eyes.
DISCUSSION
The purpose of this paper was to show the feasibility of following the dense scotoma and its enlargement over time in Stargardt disease. There are a number of limitations of this study. This was a small retrospective study, and the microperimetry was not done in a specified predefined fashion, so that the precision of measurement varies between visits and between patients. A small dense scotoma lends itself to thorough mapping both within and at the border of the scotoma (fig 3), while with a larger scotoma extensive testing is required to do a thorough mapping of the whole border and of the lesion itself. By contrast, a grid such as the 10-2 centered on the fovea affords uniform testing within the lesion, the same retinal sites tested for each patient, and threshold retinal sensitivity measurements so that earlier decline in sensitivity can be detected. But such grid testing will not generally adequately define the border of the dense scotoma. If the scotoma extends past the edge of the grid at some sites, a calculation of the size of the scotoma cannot be made. Even if the scotoma is contained within the tested area, the density of points in the grid tested will limit the ability to define the border adequately. The ideal would be to have grid threshold testing, further refined by more thorough testing at the borders of the dense scotoma.
The microperimetry testing included in this paper was performed for clinical purposes, chiefly to characterize the location of eccentric fixation and remaining seeing retina near it. As such, the grid used for testing changed from visit to visit, depending upon the new location of fixation. These retrospective data do not allow for the point to point comparisons that using the same grid would allow. A study planned to characterize enlargement of the scotoma should include the same grid in all testing sessions, but must in addition include the new areas of interest as the scotoma enlarges.
Measuring the dense scotoma as an area relies upon interpolation and extrapolation of the data at a given site to surrounding retinal areas. Any perimetric test of necessity requires interpolation because continuous testing of a border cannot be accomplished. In order to quantify the size of a scotomatous area with static perimetry, there is a need for a spatially uniform distribution of spots tested, so that the average deviation, etc, gives equal weight to the entire area tested. A standardized protocol could be defined; for example, use a standardized grid, then test the region between seeing and nonseeing retina at one degree intervals. Such a testing pattern could be defined at a ‘microperimetry reading center’ using the results of the baseline testing, but one still has the problem of this grid not defining the edge of the scotoma adequately in subsequent years. Software modifications within the MP1 could accomplish this, but such software is not available at present.
The scotoma enlargement rate of 1.36 mm2/year falls in the same range as the reported enlargement rates of 0.94 mm2/year11and 1.58 mm2/year12 of the atrophic areas imaged by FAF. (However, one study using OCT measures of atrophic area had a much lower enlargement rate, but patients had more advanced disease at baseline. 13) There was good consistency between visits in terms of minimal false positives and false negatives; good reproducibility has been previously reported for Stargardt disease in threshold testing. 14
Though only a small number of patients were studied, the findings illustrate and corroborate many epidemiologic features of Stargardt disease. Visual acuity and visual acuity loss are similar between the two eyes of a given patient. 15 The young patients experienced a rapid decline in terms of both visual acuity and scotoma size; this more severe phenotype in young people has been found by a number of investigators. 16-18 There may be a rapid decline of VA, followed by a plateauing of visual acuity loss. Initial more rapid VA loss may occur before the diagnosis of Stargardt disease is even made; this, plus the slowing of VA loss once a level of 20/100 to 20/200 has been reached, is a barrier to using visual acuity as an endpoint in Stargardt treatment trials.
It remains to be understood why there are often no specific features in the color fundus photography , infrared reflectance, or fundus autofluorescence imaging that correspond to the dense scotoma. Near infrared autofluorescence shows a larger area of involvement of the RPE than short wave autofluorescence, 19 but this has not yet been correlated with the dense scotoma. The most likely reason for the lack of correspondence between FAF dark areas and dense scotoma areas is that there is photoreceptor loss over and above the extent of the retinal pigment epithelial loss. For example, Gomes20 showed that the area of ellipsoid zone loss correlates more closely with the total extent of FAF abnormality, rather than with the region of homogeneous loss of FAF alone. The patient illustrated in the Gomes paper however had only junctional abnormal autofluorescence, not the larger areas of abnormal autofluorescence seen in many patients with Stargardt disease (for example, figure 1 above). Given that the dense scotoma often ends within the region of FAF abnormality, not at its edge, it is unlikely that FAF will be adequate for defining the maximally impaired regions. Adaptive optics imaging of cones21 is beginning to provide additional information of early increased spacing of cones and other abnormalities. However, spectral domain OCT imaging, which is now ubiquitous, provides an opportunity for looking more carefully at structure/function correlation in terms of photoreceptor integrity. Studies using sdOCT have demonstrated that there are photoreceptor abnormalities (loss or disruption of the ellipsoid zone and thinning of outer retinal layers) present in areas with apparently intact RPE. General relationships between thinning of the outer retinal layers and mean microperimetric sensitivity loss have been demonstrated22, but these have not yet looked in a detailed way at the relationship of structure and function. The opportunity for studying the structural OCT characteristics that correlate with the dense scotoma or reduced sensitivity by overlaying microperimetric data on the OCT is likely to provide a better understanding of visual loss in Stargardt disease and in other macular and retinal disorders. While the en face image of the RPE atrophy is unlikely to be adequately informative, future development of en face imaging of other layers may be helpful.
The present level of knowledge leaves open the possibility that within the areas that have dense scotomas but have not as yet lost all autofluorescence, there are still viable photoreceptors, and that it might be possible to rescue these and reduce the size of the dense scotoma.
Summary Statement.
Microperimetry is necessary for mapping the scotoma in patients with Stargardt disease, since current imaging is not adequate. Standardized grid testing, plus a standardized procedure for refining the border of the dense scotoma, should allow more precise testing and longitudinal assessment of enlargement rates.
Acknowledgments
Supported in part by the ProgSTAR study (A Natural History Study of the Progression of Stargardt disease, sponsored by the Foundation Fighting Blindness (funding through Department of Defense) and by NIH R03 EY14148
Footnotes
Presented in part at the 2015 Annual Meeting of the Macula Society (Phoenix, AZ), at the 2015 Annual Meeting of the Association for Research in Vision and Ophthalmology (ARVO) (Denver, CO), and at the 2011 Annual Meeting of ARVO (Fort Lauderdale, FL)
The authors do not have a commercial relationship relevant to this manuscript.
References
- 1.Allikmets R, Singh N, Sun H, et al. A photoreceptor cell-specific ATP-binding transporter gene (ABCR) is mutated in recessive Stargardt macular dystrophy. Nat Genet. 1997;15:236–46. doi: 10.1038/ng0397-236. [DOI] [PubMed] [Google Scholar]
- 2.Sun H, Nathans J. Mechanistic studies of ABCR, the ABC transporter in photoreceptor outer segments responsible for autosomal recessive Stargardt disease. J Bioenergetics Biomembranes. 2001;33:523–30. doi: 10.1023/a:1012883306823. [DOI] [PubMed] [Google Scholar]
- 3.Han Z, Conley SM, Makkia RS, Cooper MJ, Naash MI. DNA nanoparticle-mediated ABCA4 delivery rescues Stargardt dystrophy in mice. J Clin Invest. 2012;122:3221–6. doi: 10.1172/JCI64833. [DOI] [PMC free article] [PubMed] [Google Scholar]
- 4.Han Z, Conley SM, Naash MI. Gene therapy for Stargardt disease associated with ABCA4 gene. Adv Exp Med Biol. 2014;801:719–24. doi: 10.1007/978-1-4614-3209-8_90. [DOI] [PubMed] [Google Scholar]
- 5.Schwartz SD, Regillo CD, Lam BL, et al. Human embryonic stem cell-derived retinal pigment epithelium in patients with age-related macular degeneration and Stargardt’s macular dystrophy: follow-up of two open-label phase 1/2 studies. Lancet. 2015;385:509–16. doi: 10.1016/S0140-6736(14)61376-3. [DOI] [PubMed] [Google Scholar]
- 6.Sunness JS, Schuchard R, Shen N, Rubin G, Dagnelie G, Haselwood D. Landmark-driven fundus perimetry using the scanning laser ophthalmoscope (SLO) Invest Ophthalmol Vis Sci. 1995;36:1863–74. [PMC free article] [PubMed] [Google Scholar]
- 7.Sunness JS. What you see is not always what you get in atrophic macular disease. Retinal Cases & Brief Reports. 2008;2:205–8. doi: 10.1097/ICB.0b013e31806011e6. [DOI] [PubMed] [Google Scholar]
- 8.Csaky KG, Richman EA, Ferris FL., 3rd Report from the NEI/FDA Ophthalmic Clinical Trial Design and Endpoints Symposium. Invest Ophthalmol Vis Sci. 2008;49:479–89. doi: 10.1167/iovs.07-1132. [DOI] [PubMed] [Google Scholar]
- 9.Sunness JS, Steiner JN. Retinal function and loss of autofluorescence in Stargardt disease. RETINA. 2008;28:794–800. doi: 10.1097/IAE.0b013e31816690bd. [DOI] [PubMed] [Google Scholar]
- 10.Sunness JS, Applegate CA, Haselwood D, Rubin GS. Fixation patterns and reading rates in eyes with central scotomas from advanced atrophic age-related macular degeneration and Stargardt’s disease. Ophthalmol. 1996;103:1458–66. doi: 10.1016/s0161-6420(96)30483-1. [DOI] [PMC free article] [PubMed] [Google Scholar]
- 11.Chen B, Tosha C, Gorin MB, Nusinowitz S. Analysis of autofluorescent retinal images and measurement of atrophic lesion growth in Stargardt disease. Exp Eye Res. 2010;91:143–52. doi: 10.1016/j.exer.2010.03.021. [DOI] [PubMed] [Google Scholar]
- 12.McBain VA, Townend J, Lois N. Progression of retinal pigment epithelial atrophy in stargardt disease. Am J Ophthalmol. 2012;154:146–54. doi: 10.1016/j.ajo.2012.01.019. [DOI] [PubMed] [Google Scholar]
- 13.Testa F, Melillo P, Di Iorio V, et al. Macular function and morphologic features in juvenile stargardt disease: longitudinal study. Ophthalmology. 2014;121:2399–405. doi: 10.1016/j.ophtha.2014.06.032. [DOI] [PMC free article] [PubMed] [Google Scholar]
- 14.Cideciyan AV, Swider M, Aleman TS, et al. Macular function in macular degenerations: repeatability of microperimetry as a potential outcome measure for ABCA4-associated retinopathy trials. Invest Ophthalmol Vis Sci. 2012;53:841–52. doi: 10.1167/iovs.11-8415. [DOI] [PMC free article] [PubMed] [Google Scholar]
- 15.Hajali M, Fishman GA, Anderson RJ, McAnany JJ. Interocular difference and duration for doubling of the minimal angle of visual resolution in patients with Stargardt disease. Invest Ophthalmol Vis Sci. 2009;50:3374–7. doi: 10.1167/iovs.08-2775. [DOI] [PubMed] [Google Scholar]
- 16.Fujinami K, Zernant J, Chana RK, et al. Clinical and molecular characteristics of childhood-onset Stargardt disease. Ophthalmology. 2015;122:326–34. doi: 10.1016/j.ophtha.2014.08.012. [DOI] [PMC free article] [PubMed] [Google Scholar]
- 17.Lambertus S, van Huet RA, Bax NM, et al. Early-onset stargardt disease: phenotypic and genotypic characteristics. Ophthalmology. 2015;122:335–44. doi: 10.1016/j.ophtha.2014.08.032. [DOI] [PubMed] [Google Scholar]
- 18.Rotenstreich Y, Fishman GA, Anderson RJ. Visual acuity loss and clinical observations in a large series of patients with Stargardt disease. Ophthalmology. 2003;110:1151–8. doi: 10.1016/S0161-6420(03)00333-6. [DOI] [PubMed] [Google Scholar]
- 19.Cukras CA, Wong WT, Caruso R, Cunningham D, Zein W, Sieving PA. Centrifugal expansion of fundus autofluorescence patterns in Stargardt disease over time. Arch Ophthalmol. 2012;130:171–9. doi: 10.1001/archophthalmol.2011.332. [DOI] [PMC free article] [PubMed] [Google Scholar]
- 20.Gomes NL, Greenstein VC, Carlson JN, et al. A comparison of fundus autofluorescence and retinal structure in patients with Stargardt disease. Invest Ophthalmol Vis Sci. 2009;50:3953–9. doi: 10.1167/iovs.08-2657. [DOI] [PMC free article] [PubMed] [Google Scholar]
- 21.Chen Y, Ratnam K, Sundquist SM, et al. Cone photoreceptor abnormalities correlate with vision loss in patients with Stargardt disease. Invest Ophthalmol Vis Sci. 2011;52:3281–92. doi: 10.1167/iovs.10-6538. [DOI] [PMC free article] [PubMed] [Google Scholar]
- 22.Burke TR, Rhee DW, Smith RT, et al. Quantification of peripapillary sparing and macular involvement in Stargardt disease (STGD1) Invest Ophthalmol Vis Sci. 2011;52:8006–15. doi: 10.1167/iovs.11-7693. [DOI] [PMC free article] [PubMed] [Google Scholar]


