Fig. 5.

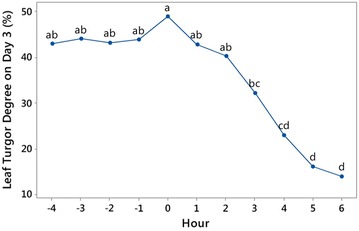
Main effect plot of time on Day 3 leaf turgor (%) showing trends of the mean values for 11 h. Means sharing the same letter are not significantly different

Main effect plot of time on Day 3 leaf turgor (%) showing trends of the mean values for 11 h. Means sharing the same letter are not significantly different