Abstract
Assessment of level of consciousness is very important in predicting patient's outcome from neurological illness. Glasgow coma scale (GCS) is the most commonly used scale, and Full Outline of UnResponsiveness (FOUR) score is also recently validated as an alternative to GCS in the evaluation of the level of consciousness. We carried out a prospective study in 97 patients aged above 16 years. We measured GCS and FOUR score within 24 h of Intensive Care Unit admission. The mean GCS and the FOUR scores were lower among nonsurvivors than among the survivors and were statistically significant (P < 0.001). Discrimination for GCS and FOUR score was fair with the area under the receiver operating characteristic curve of 0.79 and 0.82, respectively. The cutoff point with best Youden index for GCS and FOUR score was 6.5 each. Below the cutoff point, mortality was higher in both models (P < 0.001). The Hosmer-Lemeshow Chi-square coefficient test showed better calibration with FOUR score than GCS. A positive correlation was seen between the models with Spearman's correlation coefficient of 0.91 (P < 0.001).
Key words: Coma, consciousness, Full Outline of UnResponsiveness score, Glasgow coma scale
Introduction
Glasgow coma scale (GCS) was introduced in 1974 and revised in 1976 as a method to objectively determine the severity of brain dysfunction and coma 6 h after the occurrence of head trauma.[1] Although initially devised for the patients with traumatic brain injury, it has now been validated for most of other primary neurological disorders such as intracerebral hemorrhage, subarachnoid hemorrhage, neurodegenerative diseases, drowning, cardiac arrest, ethanol poisoning, and tubercular meningitis. It scores from 3 to 15, three being the worst. It has widespread acceptance because of highly accurate characterization of patients and its high level of inter-observer reliability.[2] It can be utilized by any health-care provider due to its simplicity.[3] It can be used in any setting[4] but has its own limitations.[5]
Recognizing the shortcomings of GCS, Wijdicks et al.[1] published a new scoring system in 2005, the Full Outline of UnResponsiveness (FOUR) score which was first validated by Mayo Clinic. It is a 17-point scale (with potential scores ranging from 0 to 16). The FOUR score assesses four domains of the neurological functions: Eye responses, motor responses, brainstem reflexes, and breathing pattern. Each of the domains carries five parameters with total points ranging from 0 to 4. It is applicable for both traumatic[6] and nontraumatic brain injuries.[7] Construct and face validity of the scale have been established among neurologists,[7] nurses, and medical Intensive Care Unit (ICU) and emergency care staffs. The FOUR adds eye-tracking to eye opening, thus incorporating the brain and pontine functions.[8] It detects the locked-in syndrome as well as the presence of vegetative state where the eyes open spontaneously but do not track the examiner's finger.[9] Incorporation of hand gestures into the evaluation of motor functions is validated to assess alertness.[10]
Subjects and Methods
The study was prospectively conducted on 97 patients with the diagnosis of primary neurological/neurosurgical disease managed in the ICU for more than 24 h, all aged above 16 years. GCS and FOUR score were measured once within 24 h of admission to ICU. Each component of both scores was tested independently and recorded. If patient was under the effect of a sedative and/or neuromuscular blocking agent, the scores were taken at the earliest possible time of spontaneous awakening trial. All enrolled patients were followed during the ICU stay, and outcome was recorded as survivors and nonsurvivors.
Statistical analysis
Statistical analysis was done using SPSS version 17 (SPSS Inc., Chicago, IL, USA), and P < 0.05 was considered statistically significant. Descriptive statistics were calculated where applicable. Discrimination was tested by calculating area under receiver operating characteristics (ROC) curve, a graphical plot of true positive (sensitivity) against false positive rate (1-specificity). The best cutoff value was derived by the best Youden index. Calibration was tested by Hosmer-Lemeshow goodness of fit test. Student's paired t-test was used to compare the scores. Correlation between the models was calculated by Spearman's rho coefficient.
Results
Among 97 patients, there were 50 male and 47 female patients. GCS value among the patients varied from 3 to 15, with a mean value of 8.27 with standard deviation (SD) 3.82. FOUR score varied from 1 to 16, with a mean value of 7.89 with SD 3.87. There were 68 survivors (70.1%). Mean GCS score among survivors was 9.56 ± 3.63 and among the nonsurvivors was 5.24 ± 2.20 (P < 0.001) [Table 1]. Mean FOUR score among survivors was 9.13 ± 3.61 and among nonsurvivors was 4.97 ± 2.76 (P < 0.001) [Table 1]. Both GCS and FOUR scores were lower among nonsurvivors than among survivors, and they were statistically significant. With the total GCS score, the odds ratio (OR) of experiencing in-hospital mortality under the unadjusted model was 0.66 (0.55-0.79 95% confidence interval [CI]; P < 0.001). Similarly, considering the total FOUR score, the OR of experiencing in-hospital mortality under the unadjusted model was 0.70 (0.60-0.82 95% CI; P < 0.001).
Table 1.
Mean GCS and FOUR score among the survivors and non-survivors

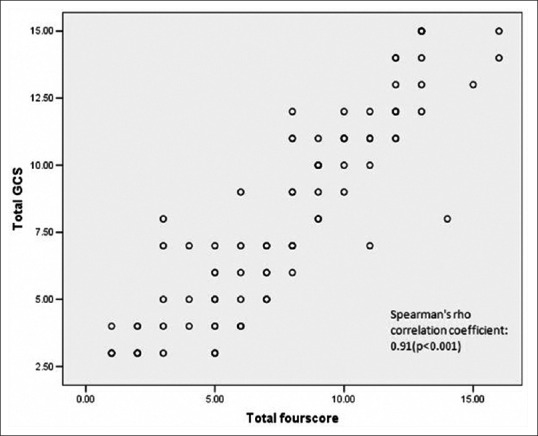
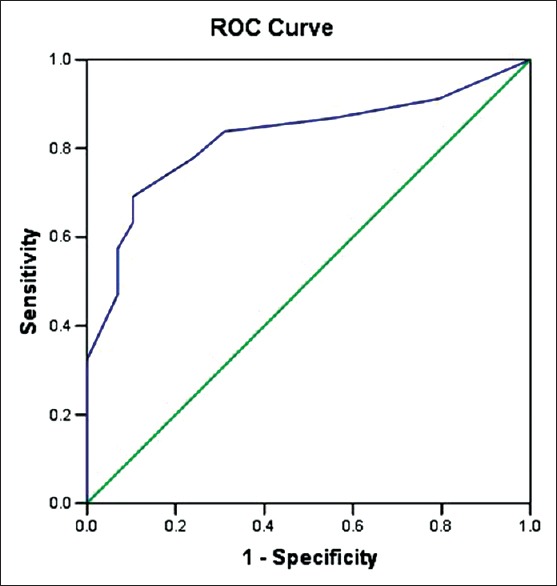
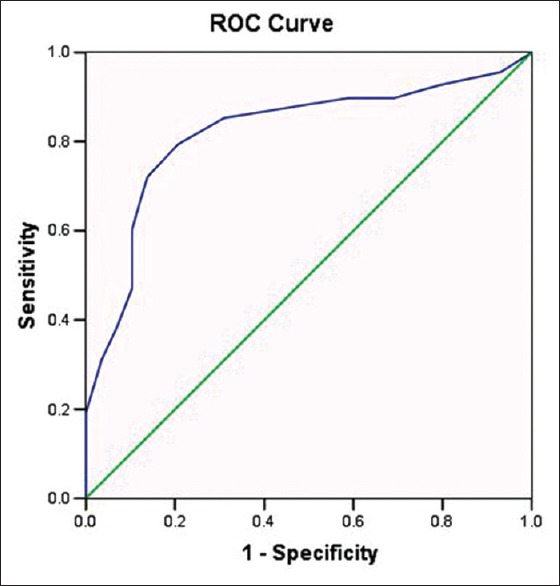
The overall correlation between GCS and FOUR score was good, with Spearman's rho correlation coefficient of 0.91 (P < 0.001) [Figure 1]. Discrimination for GCS and FOUR score was fair with area under the ROC curve of 0.79 and 0.82, respectively [Figures 2 and 3]. The cutoff point with best Youden index for GCS and FOUR score was 6.5 each. Of the 37 patients with GCS <6.5, there were 22 nonsurvivors, and of the 60 patients with GCS ≥6.5, there were 7 nonsurvivors (P < 0.001). Of the 37 patients with FOUR score <6.5, there were 23 nonsurvivors, and of the 60 patients with FOUR ≥6.5, there were 6 nonsurvivors, which was statistically significant (P < 0.001). The overall sensitivity, specificity, positive predictive value, negative predictive value, and accuracy of GCS were 75.86%, 77.94%, 59.46%, 88.33%, and 77.32%, respectively, while that for FOUR score was 79.31, 79.41%, 62.16%, 90.00%, and 79.38%, respectively. The Hosmer-Lemeshow Chi-square coefficient value calculated for calibration of GCS was 7.84 (P = 0.35) and of FOUR score was 9.82 (P = 0.28).
Figure 1.

Correlation between Glasgow coma scale and Full Outline of UnResponsiveness score
Figure 2.

Receiver operating characteristic curve of Glasgow coma scale to test the discrimination of the model (area under the curve = 0.79)
Figure 3.

Receiver operating characteristic curve of Full Outline of UnResponsiveness score model to test the discrimination of the model (area under the curve = 0.82)
Discussion
Both mean GCS and FOUR score were significantly lower among nonsurvivors than survivors. There are a few studies done comparing GCS and FOUR score to predict the mortality in the ICU. Mean GCS score among survivors was 9.56 ± 3.63 and among nonsurvivors was 5.24 ± 2.20 (P < 0.001). Mean FOUR score among survivors was 9.13 ± 3.61 and among the nonsurvivors was 4.97 ± 2.76 (P < 0.001). Both GCS and FOUR scores were low among the nonsurvivor than among the survivors and they were statistically significant.
Considering the total GCS in our study, for every 1-point increase in total score, there was an estimated 34% reduced odds of experiencing in-hospital mortality under the unadjusted model (OR = 0.66; 0.55-0.79 95% CI; P < 0.001). Considering the total FOUR score in our study, for every 1-point increase in total score, there was an estimated 30% reduced odds of experiencing in-hospital mortality under the unadjusted model (OR = 0.70; 0.60-0.82 95% CI; P < 0.001). Both results were also consistent with Wijdicks et al.[1] and Sadaka et al.[6] study.
Overall mortality observed in our study was 29.9%, which was 21% in Wijdicks et al.[1] study, 7.8% in Sadaka et al.[6] study, and 10% in Büyükcam et al.[11] study. The higher mortality in our study may be due to inclusion of more emergency postoperative neurosurgical cases in our study.
In our study, the overall predictive performances of both the GCS and FOUR score for hospital mortality were fair with area under the ROC curve of 0.79 (0.74-0.91 95% CI; P < 0.001) and 0.82 (0.73-0.91 95% CI; P < 0.001), respectively. These findings were comparable with findings of Wijdicks et al.[1] in which area under ROC curve was 0.89 for both scores and Bruno et al.[12] in which an area under ROC curve were 0.68 and 0.70 for GCS and FOUR scores, respectively.
We have good correlation between GCS and FOUR score, with Spearman's rho correlation coefficient of 0.91 (P < 0.001). This result was consistent with Wijdicks et al.[1] (Spearman's rho = 0.92) and Bruno et al.[12] (Spearman's rho = 0.81).
The best cutoff point calculated from Youden index in our study was 6.5 for both GCS and FOUR scores. However, this is not compatible with Wijdicks et al.[1] where the best cutoff point was 7 and 9 for GCS and FOUR score, respectively, and with Akavipat et al.[13] where the best cutoff point was 10 and 14 for GCS and FOUR score, respectively. This inconsistency may be due to the inclusion of more critically ill patients in our ICU.
Conclusion
Mortality of patients was significantly higher when the GCS and the FOUR score each was <6.5. Discrimination was fair for both scores, but FOUR score was superior to GCS. Calibration was better for FOUR score than GCS in our ICU. The sensitivity, specificity, positive predictive value, negative predictive value, and accuracy were also better for FOUR score as compared to GCS. A good correlation was observed between the two scores. However, further multicenter studies involving larger population of various disease categories may be helpful to justify the result of the study.
Financial support and sponsorship
Nil.
Conflicts of interest
There are no conflicts of interest.
References
- 1.Wijdicks EF, Bamlet WR, Maramattom BV, Manno EM, McClelland RL. Validation of a new coma scale: The FOUR score. Ann Neurol. 2005;58:585–93. doi: 10.1002/ana.20611. [DOI] [PubMed] [Google Scholar]
- 2.Buechler CM, Blostein PA, Koestner A, Hurt K, Schaars M, McKernan J, et al. Variation among trauma centers’ calculation of Glasgow Coma Scale score: Results of a national survey. J Trauma. 1998;45:429–32. doi: 10.1097/00005373-199809000-00001. [DOI] [PubMed] [Google Scholar]
- 3.Fischer J, Mathieson C. The history of the Glasgow Coma Scale: Implications for practice. Crit Care Nurs Q. 2001;23:52–8. doi: 10.1097/00002727-200102000-00005. [DOI] [PubMed] [Google Scholar]
- 4.Bazarian JJ, Eirich MA, Salhanick SD. The relationship between pre-hospital and emergency department Glasgow Coma Scale scores. Brain Inj. 2003;17:553–60. doi: 10.1080/0269905031000070260. [DOI] [PubMed] [Google Scholar]
- 5.Teasdale G, Jennett B. Assessment of coma and impaired consciousness. A practical scale. Lancet. 1974;2:81–4. doi: 10.1016/s0140-6736(74)91639-0. [DOI] [PubMed] [Google Scholar]
- 6.Sadaka F, Patel D, Lakshmanan R. The FOUR score predicts outcome in patients after traumatic brain injury. Neurocrit Care. 2012;16:95–101. doi: 10.1007/s12028-011-9617-5. [DOI] [PubMed] [Google Scholar]
- 7.Idrovo L, Fuentes B, Medina J, Gabaldón L, Ruiz-Ares G, Abenza MJ, et al. Validation of the FOUR score (Spanish Version) in acute stroke: An interobserver variability study. Eur Neurol. 2010;63:364–9. doi: 10.1159/000292498. [DOI] [PubMed] [Google Scholar]
- 8.Kornbluth J, Bhardwaj A. Evaluation of coma: A critical appraisal of popular scoring systems. Neurocrit Care. 2011;14:134–43. doi: 10.1007/s12028-010-9409-3. [DOI] [PubMed] [Google Scholar]
- 9.Matheesiriwat N. The FOUR score and Glasgow Coma Scale to evaluate the patients with intubation at emergency room. R Thai Army Med J. 2012;65:145–52. [Google Scholar]
- 10.Wijdicks EF, Kokmen E, O’Brien PC. Measurement of impaired consciousness in the neurological intensive care unit: A new test. J Neurol Neurosurg Psychiatry. 1998;64:117–9. doi: 10.1136/jnnp.64.1.117. [DOI] [PMC free article] [PubMed] [Google Scholar]
- 11.Büyükcam F, Kaya U, Karakiliç ME, Cavus UY, Turan Sönmez F, Odabas O, et al. Predicting the outcome in children with head trauma: Comparison of FOUR score and Glasgow Coma Scale. Ulus Travma Acil Cerrahi Derg. 2012;18:469–73. doi: 10.5505/tjtes.2012.23169. [DOI] [PubMed] [Google Scholar]
- 12.Bruno MA, Ledoux D, Lambermont B, Damas F, Schnakers C, Vanhaudenhuyse A, et al. Comparison of the full outline of unresponsiveness and Glasgow Liege Scale/Glasgow Coma Scale in an intensive care unit population. Neurocrit Care. 2011;15:447–53. doi: 10.1007/s12028-011-9547-2. [DOI] [PubMed] [Google Scholar]
- 13.Akavipat P, Sookplung P, Kaewsingha P, Maunsaiyat P. Prediction of discharge outcome with the full outline of unresponsiveness (FOUR) score in neurosurgical patients. Acta Med Okayama. 2011;65:205–10. doi: 10.18926/AMO/46633. [DOI] [PubMed] [Google Scholar]


