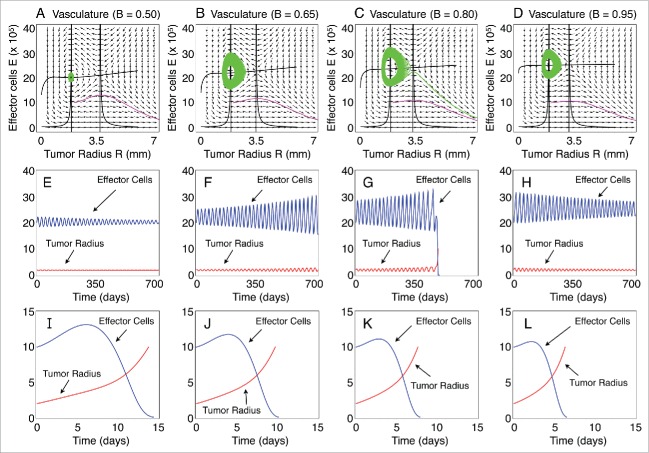
Figure 1.
Phase portraits and long-term characteristic dynamics. (A–D) Phase portraits of the tumor radius R versus the concentration of effector cells E for different functional levels of the tumor-associated vasculature B. Trajectories starting with the initial conditions IC1 = (R0, E0) = (2.0 mm, 20×105 cells) and IC2 = (R0, E0) = (2.0 mm, 10×105 cells) are resented. The nullclines (zero-growth isoclines) of the dynamical system are also plotted. (E–H) Temporal evolution of R and E, that corresponds to the trajectories in panels (A–D) starting at the initial condition IC1. (I–L) Temporal evolution of R and E, that correspond to the trajectories in panels (A–D), starting at the initial condition IC2. The immune recruitment rate is r = 0.57 days-1 and the remaining parameters are as in Table 1.

