Abstract
We tested the hypothesis that combined treatment with melatonin, an anti-oxidant, and exendin-4, an anti-inflammatory agent, was superior to either alone for protecting the kidney from ischemia–reperfusion (IR) injury. Male adult Sprague-Dawley rats (n=40) were equally divided into group 1 (sham-operated control), group 2 (IR only, IR=1h/72h), group 3 (IR–exendin-4, 10 µg/kg at 30 min, 24 h, 48 h after IR procedure), group 4 (IR–melatonin, i.p. 50 mg at 30 min, then 20 mg at 6 and 18 h after IR procedure), and group 5 (combined IR–exendin-4–melatonin). All animals were sacrificed by 72 h after IR/sham procedure. The results showed that the kidney injury score, plasma creatinine, and blood urea nitrogen (BUN) levels were highest in group 2 and lowest in group 1, significantly higher in groups 3 and 4 than those in group 5 and significantly higher in group 3 than those in group 4 (all p < 0.001). The protein expressions of inflammatory (toll-like receptor 4, inducible nitric oxide synthase, interleukin-1β), apoptotic (mitochondrial Bax, cleaved caspase-3 and poly(ADP-ribose) polymerase, p53), podocyte integrity (E-cadherin, P-cadherin), and cell survival (phosphatidylinositol-3-kinase/AKT/mammalian target of rapamycin) biomarkers, as well the podocyte dysfunction biomarkers (Wnt1/Wnt4/β-catenin) displayed a pattern identical to that of creatinine level among the five groups (all p < 0.001). Microscopic findings demonstrated that podocyte dysfunction (Wnt1/Wnt4/β-catenin expression) and inflammatory (CD14 and F4/80-positively stained cells) biomarkers exhibited an identical pattern, whereas that of antioxidant (HO-1+, NQO-1+ cells) biomarkers showed an opposite pattern compared to that of creatinine level among the five groups (all p < 0.001). Combined melatonin–exendin-4 therapy offered an additional benefit in protecting the kidney from acute IR injury.
Keywords: Acute kidney ischemia–reperfusion injury, inflammation, apoptosis, phosphatidylinositol-3-kinase/AKT/mammalian target of rapamycin signaling pathway
Introduction
Acute kidney injury (AKI), which is common in hospitalized patients, includes a group of clinical syndromes that primarily manifest as a rapid decline in renal function in association with the accumulation of metabolic waste.1,2 Previous study has shown that in the U.S. about 17 million hospital admissions a year are complicated by AKI, resulting in additional costs to the health care system of up to $10 billion.1 Additionally, the incidence of AKI has been reported to rise from approximately 60 to 500 per 100,000 population in the last decade.3,4
The aetiology of AKI has been found to be multifactorial.5–10. Acute ischemia–reperfusion (IR) injury of the kidney, in particular, not only is a common cause of AKI, but it also remains a major health care problem with a high rate of in-hospital mortality7,8,11,12 and increased risk of long-term mortality8,13–16 despite current advances in medical treatment. This situation, therefore, warrants the development of new treatment modalities for improving the kidney function after AKI.17–19
The mechanism underlying acute IR injury of organs, including that of the kidney, has been found to be mainly due to the burst of oxidative stress/reactive oxygen species (ROS)20–22 and rigorously inflammatory reaction19 during reperfusion of ischemic tissues. A reduced blood supply causes severe hypoxia, generation of ROS, and oxidative stress as well as microvascular dysfunction20,23 and mitochondrial damage19 which, in turn, elicits more ROS production. Paradoxically, the subsequent reperfusion enhances, rather than alleviates, the damage through activating a vicious cycle of increased production of ROS and oxidative reaction, vigorous inflammatory reaction, complement activation, immune cell infiltration in ischemic tissue, and upregulation of innate and adaptive immune response that elicit cellular apoptosis and death and ultimately organ failure.1,18–26 Accordingly, inhibition of inflammatory reaction and suppression of the generations of pro-inflammatory cytokines and ROS/oxidative stress using pharmaco-modulation may significantly protect the kidney from acute IR injury.
Exendin-4 (Ex4), a glucagon-like peptide-1 (GLP-1) analog, was originally developed as a therapeutic agent for type 2 diabetes mellitus. Interestingly, growing data have shown that exendin-4 therapy has additional beneficial effects other than blood sugar regulation on the protection of tissues and organs from ischemic damage25,27 mainly through its antioxidative and anti-inflammatory properties.25,27–29 On the other hand, melatonin, an indole mainly secreted from the pineal gland, is a free radical scavenger and anti-inflammatory agent that has been demonstrated to play an essential role in maintaining cell membrane stability and protecting the cell from senescence and death mainly through a reduction in the susceptibility to oxidative stress and free radical damage as well as a suppression of inflammatory reaction.15–18 Furthermore, multiple signaling pathways mainly related to the generation of ROS/oxidative stress and inflammatory reaction have been shown to be involved in acute kidney IR injury.1,18–26 Thus, it is rational to hypothesize that combined therapy with melatonin and exendin-4 would be superior to either alone for protecting the kidney from acute IR injury mainly through the suppressions of (1) inflammatory reaction, (2) generation of ROS and oxidative stress, (3) cell apoptosis, and (4) regulating the PI3K/AKT/mTOR intracellular signaling pathway which plays a central role in the regulation of cell cycle, cell proliferation, survival, and growth in response to extracellular stimulation.
Methods
Ethics
All animal experimental procedures were approved by the Institute of Animal Care and Use Committee at Kaohsiung Chang Gung Memorial Hospital (Affidavit of Approval of Animal Use Protocol No. 2011053001) and performed in accordance with the Guide for the Care and Use of Laboratory Animals (The Eighth Edition of the Guide for the Care and Use of Laboratory Animals [NRC 2011]).
Animals were housed in an Association for Assessment and Accreditation of Laboratory Animal Care International-approved animal facility in our hospital with controlled temperature and light cycle (24℃ and 12/12 light cycle).
Procedure and protocol of kidney IR and treatment strategy
Pathogen-free, adult male Sprague-Dawley (SD) rats (n = 40) weighing 320–350 g (Charles River Technology, BioLASCO Taiwan Co. Ltd, Taiwan) were equally categorized into five groups (i.e. n=8/each group): sham control (SC) (receiving laparotomy plus intraperitoneal administration of 3.0 mL normal saline at 30 min and days 1–3 after IR procedure), IR (receiving similar treatment as SC except for IR of both kidneys), IR + exendin-4 ([IR + Ex4], subcutaneous administration of exendin-4 10 µg/kg at 30 minute and at days 1–3 after IR procedure), IR + melatonin ([IR–Mel], 20 mg/kg at 0.5 h after IR and 50 mg/kg at 6 and 18 h after IR procedure), and IR + Ex4 + Mel.
The procedure and protocol of acute kidney IR procedure have been described in detail in our previous reports.18,25,26 Briefly, animals in groups 1–5 were anesthetized by inhalational 2.0% isoflurane, placed in a supine position on a warming pad at 37℃ for midline laparotomies. The SC received laparotomy only, while acute IR injury of both kidneys was induced in all animals in groups 2–5 by clamping the renal pedicles for 1 h using non-traumatic vascular clips. The animals in each group were euthanized and kidney specimens were collected for individual study by day 3 after the IR procedure.
The dosage and time points of melatonin administration to the animals at 30 min and 6 and 18 h after acute kidney IR were based on our recent reports.19,30 Similarly, the dosage of exendin-4 administration was based on our recent reports with minimal modifications.25,27
Examination of circulating levels of creatinine and blood urea nitrogen (BUN), and collection of 24 h urine for the ratio of urine protein to creatinine at 72 h after acute kidney IR injury
Blood samples were collected from all animals in each group for measuring the changes in serum creatinine and BUN levels at 72 h after IR procedure.
For the collection of 24 h urine for individual study, each animal was put into a metabolic cage (DXL-D, space: 19 cm × 29 cm × 55 cm, Suzhou Fengshi Laboratory Animal Equipment Co. Ltd, Mainland China) for 24 h with free access to food and water. Urine in 24 h was collected in all animals at from 48 to 72 h after the IR procedure for determining the daily urine volume and the ratio of urine protein to urine creatinine.
Qualitative analysis of kidney injury scores at 72 h after IR procedure
Histopathology scoring of kidney injury was assessed in a blinded fashion as we previously reported.18,19,25,26 Briefly, the kidney specimens from all animals were fixed in 10% buffered formalin, embedded in paraffin, sectioned at 5 µm, and stained with hematoxylin and eosin (H&E) for light microscopy. The scoring system reflecting the grading of tubular necrosis, loss of brush border, cast formation, and tubular dilatation in 10 randomly chosen, non-overlapping fields (200x) was as follows: 0 (none), 1 (≤10%), 2 (11–25%), 3 (26–45%), 4 (46–75%), and 5 (≥76%).
Western blot analysis
The procedure and protocol for Western blot analysis were based on our recent reports.18,19,25–27 Briefly, equal amounts (50 mg) of protein extracts were loaded and separated by SDS-PAGE using acrylamide gradients. After electrophoresis, the separated proteins were transferred electrophoretically to a polyvinylidene difluoride membrane (GE Healthcare Bio-Sciences, Marlborough, MA, USA). Non-specific sites were blocked by incubation of the membrane in blocking buffer (5% nonfat dry milk in T-TBS [TBS containing 0.05% Tween 20]) overnight. The membranes were incubated with the indicated primary antibodies (Toll-like receptor [TLR]-2 [1:1000, Abcam, Cambridge, MA, USA], toll-like receptor 4 [TLR-4] [1:500, Novus, Littleton, CO, USA], Interleukin [IL]-1β [1:1000, Cell Signaling, Danvers, MA, USA], inducible nitric oxide synthase [iNOS] [1:200, Abcam, Cambridge, MA, USA], mitochondrial Bax [1:1000, Abcam, Cambridge, MA, USA], cleaved caspase 3 [1:1000, Cell Signaling, Danvers, MA, USA], cleaved Poly [ADP-ribose] polymerase [PARP] [1:1000, Cell Signaling, Danvers, MA, USA], phosphatidylinositol-3-kinase [PI3K] [1:1000, Cell Signaling, Danvers, MA, USA], phosphorylated AKT [1:1000, Cell Signaling, Danvers, MA, USA], mammalian target of rapamycin [mTOR] [1:500, Cell Signaling, Danvers, MA, USA], p53 [1:1000, Cell Signaling, Danvers, MA, USA], NOX-1 [1:1500, Sigma, St. Louis, Mo, USA], NOX-2 [1:500, Sigma, St. Louis, Mo, USA], P-cadherin [1:1000, Abcam, Cambridge, MA, USA], E-cadherin [1:1000, Abcam, Cambridge, MA, USA], Wnt1 [1:1000, Sigma, St. Louis, Mo, USA], Wnt4 [1:1000, Novus, Littleton, CO, USA], β-catenin [1:1000, Cell Signaling, Danvers, MA, USA], and actin [1: 10000, Chemicon, Billerica, MA, USA]) for 1 h at room temperature. Horseradish peroxidase-conjugated anti-rabbit immunoglobulin IgG (1:2000, Cell Signaling, Danvers, MA, USA) was used as a secondary antibody for 1 h incubation at room temperature. The washing procedure was repeated eight times within 1 h. Immunoreactive bands were visualized by enhanced chemiluminescence (ECL; Thermo Scientific Pierce, Waltham, MA, USA) and exposed to Super RX film (FUJIFILM Super RX, Minato-ku, Tokyo, Japan). For the purpose of quantification, ECL signals were digitized using Labwork software (UVP, Waltham, MA, USA).
Immunohistochemical (IHC) and immunofluorescent (IF) staining
The procedure and protocol of IF staining have been described in detail in our previous reports.18,19,25,26,30 For IHC and IF staining, rehydrated paraffin sections were first treated with 3% H2O2 for 30 min and incubated with Immuno-Block reagent (BioSB, Santa Barbara, CA, USA) for 30 min at room temperature. Sections were then incubated with primary antibodies specifically against CD14 (1/200, BioSS, Massachusetts, USA), F4/80 (1/100, Abcam, Massachusetts, USA), Wnt1 (1/200,Santa Cruz, CA, USA), Wnt4 (1/200, BioSS, Massachusetts, USA), β-catenin (1/100, Abcam, Massachusetts, USA), heme oxygenase (HO)-1 (1/250, Abcam, Massachusetts, USA), NAD(P)H dehydrogenase, (quinone 1) (NQO 1) (1/400, Abcam, Massachusetts, USA), GLP-1R (1/400, Abcam, Massachusetts, USA), apoptotic nuclei (In Situ Cell Death Detection kit, POD, Roche, Basel, Switzerland), while sections incubated with the use of irrelevant antibodies served as controls. Three sections of kidney specimen from each rat were analyzed. For quantification, three randomly selected HPFs (200× or 400× for IHC and IF studies) were analyzed in each section. The mean number of positively stained cells per HPF for each animal was then determined by summation of all numbers divided by 9.
Assessment of oxidative stress
The procedure and protocol for evaluating the protein expression of oxidative stress have been described in detail in our previous reports.27,30,31 The Oxyblot Oxidized Protein Detection Kit was purchased from Chemicon, Billerica, MA, USA (S7150). DNPH derivatization was carried out on 6 µg of protein for 15 min according to the manufacturer's instructions. One-dimensional electrophoresis was carried out on 12% SDS/polyacrylamide gel after DNPH derivatization. Proteins were transferred to nitrocellulose membranes that were then incubated in the primary antibody solution (anti-DNP 1: 150) for 2 h, followed by incubation in secondary antibody solution (1:300) for 1 h at room temperature. The washing procedure was repeated eight times within 40 min. Immunoreactive bands were visualized by ECL (Thermo Scientific Pierce, Waltham, MA, USA) which was then exposed to Super RX film (FUJIFILM Super RX, Minato-ku, Tokyo, Japan). For quantification, ECL signals were digitized using Labwork software (UVP, Waltham, MA, USA). For oxyblot protein analysis, a standard control was loaded on each gel.
In vitro study for determining the effect of TNF-α on stimulating the expressions of PI3K/AKT/mTOR signaling pathway
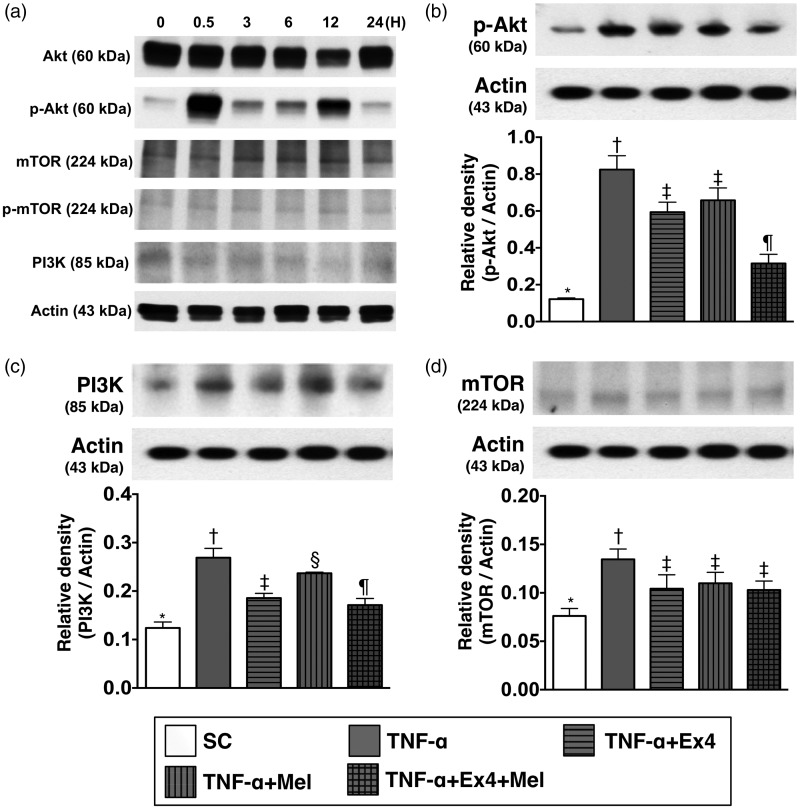
The normal rat kidney epithelial cells (NRK, ATCC CRL-6509) were utilized in the in vitro study for assessing the effect of TNF-α (i.e. an indicator of inflammatory mediator) on activating the PI3K/AKT/mTOR signaling pathway that mimicked the setting of acute kidney IR injury mainly through inflammatory reaction. In this in vitro study, we first performed time courses of PI3K/AKT/mTOR expressions (see Figure 1) undergoing the stimulation of TNF-α (10 ng/mL) (i.e. co-culture with the cells). In this way, we found that 30 min after TNF-α stimulation was the first time point for the peak-level expressions of PI3K/AKT/mTOR signaling. Accordingly, this time interval was utilized for assessing the impact of Mel-Ex4 therapy on regulating the expressions of PI3K/AKT/mTOR signaling undergoing the TNF-α treatment (Figure 1).
Figure 1.
Time courses of PI3K/AKT/mTOR expressions with respect to TNF-α stimulation and the impact of Ex4–Mel treatment on regulating PI3K/AKT/mTOR signaling pathway. (a) The protein expression of p-AKT and PI3K were unregulated at the time intervals of 30 m, 3, 12, and 24 h, whereas the protein expression of mTOR at these time intervals was not obviously changed. Two peak levels of p-AKT protein were identified at 30 min and 12 h with respect to TNF-α stimulation. (b) The protein expression of p-AKT, control vs. TNF-α treated group, p < 0.001; * vs. other groups with different symbols (†, ‡, §), p < 0.001. (c) The protein expression of PI3K, control vs. TNF-α treated group, p < 0.008; * vs. other groups with different symbols (†, ‡, §, ¶), p < 0.008. (d) The protein expression of mTOR, control vs. TNF-α treated group, p < 0.01; * vs. other groups with different symbols (†, ‡), p < 0.01. All statistical analyses were performed by one-way ANOVA, followed by Bonferroni multiple comparison post hoc test (n=4 for each group). Symbols (*, †, ‡, §, ¶) indicate significance (at 0.05 level). Ex4: exendin-4; Mel: melatonin; TNF: tumor necrosis factor
Statistical analysis
Quantitative data are expressed as mean ± SD. Statistical analysis was adequately performed by ANOVA, followed by Bonferroni multiple-comparison post hoc test. SAS statistical software for Windows version 8.2 (SAS institute, Cary, NC) was utilized. A probability value < 0.05 was considered statistically significant.
Results
Time courses of PI3K/AKT/mTOR expressions with respect to TNF-α stimulation and the impact of Ex4–Mel treatment on regulating PI3K/AKT/mTOR signaling pathway in in vitro study (Figure 1)
The western blot results (Figure 1(a)) showed that as compared with baseline (i.e. at 0 min) the protein expression of p-AKT and PI3K were unregulated at the time intervals of 30 min, 3, 12, and 24 h, respectively. On the other hand, the upregulation of mTOR at these time intervals was not obvious. Additionally, two peak levels of p-AKT protein were identified at 30 min and 12 h, respectively.
By the time point of 30 min after TNF-α treatment, the protein of p-AKT (0.122 ± 0.007 versus 0.824 ± 0.075 versus 0.594 ± 0.054 versus 0.658 ± 0.067 versus 0.316 ± 0.049, p < 0.01) was lowest in control group and highest in TNF-α-treated group, and significantly higher in TNF-α-Mel and TNF-α-Ex4 groups than in TNF-α-Ex4–Mel group, but it showed no difference between TNF-α-Mel group and TNF-α-Ex4 group (Figure 1(b)).
Additionally, by the time point of 30 min after TNF-α treatment, the protein expression of PI3K (0.124 ± 0.016 versus 0.269 ± 0.025 vs. 0.186 ± 0.012 vs. 0.237 ± 0.003 vs. 0.171 ± 0.017, p < 0.01) showed an identical pattern of p-AKT among the five groups (Figure 1(c)).
Furthermore, by the time point of 30 min after TNF-α treatment, the protein expression of mTOR (0.076 ± 0.008 vs. 0.125 ± 0.011 vs. 0.104 ± 0.014 vs. 0.111 ± 0.012 vs. 0.103 ± 0.009, p < 0.01) was significantly lower in control group than in other four groups, and significantly higher in TNF-α-treated group than in TNF-α-Mel, TNF-α-Ex4, and TNF-α-Ex4–Mel groups, but it showed no difference among the later three groups (Figure 1(d)).
Serum level of creatinine and BUN, urine amount, and the ratio of urine protein to creatinine at 72 h after IR procedure (Figure 2)
Figure 2.
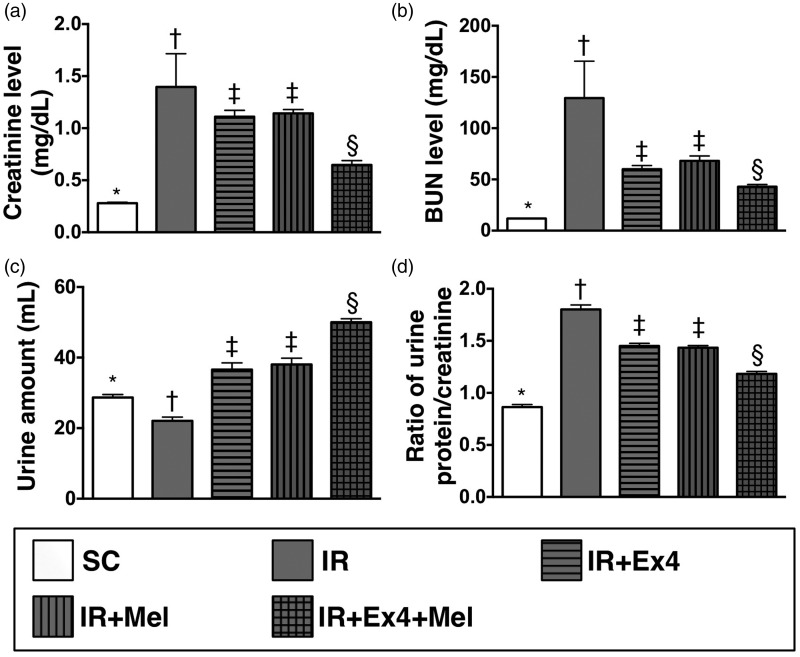
Measured circulating levels of creatinine and blood urea nitrogen (BUN) and the ratio of urine protein to creatinine at 72 h after ischemia–reperfusion (IR) procedure. (a) Circulating level of creatinine by 72 h after IR procedure, SC vs. IR, p < 0.0001; *vs. other groups with different symbols (†, ‡, §), p < 0.0001. (b) Circulating BUN level by 72 h after IR procedure, SC vs. IR, p < 0.0001; *vs. other groups with different symbols (†, ‡, §), p < 0.0001. (c) The urine amount at 72 h, SC vs. IR, p < 0.0001; *vs. other groups with different symbols (†, ‡, §), p < 0.0001. (d) By 72 h, the ratio of urine protein to creatinine, SC vs. IR, p < 0.001; *vs. other groups with different symbols (†, ‡, §), p < 0.001. All statistical analyses were performed by one-way ANOVA, followed by Bonferroni multiple comparison post hoc test (n=8 for each group). Symbols (*, †, ‡, §) indicate significance (at 0.05 level). Ex4: exendin-4; IR: ischemia–reperfusion; Mel: melatonin; SC: sham control
By 72 h after the IR procedure, the serum levels of creatinine (0.279 ± 0.028 vs. 2.271 ± 2.551 vs. 1.112 ± 0.171 vs. 1.142 ± 0.105 vs. 0.648 ± 0.116, p < 0.0001) and BUN (11.870 ± 0.344 vs. 129.471 ± 101.964 vs. 60.026 ± 10.124 vs. 68.186 ± 13.414 vs. 42.889 ± 6.125, p < 0.0001), two indices of renal dysfunction, were highest in the IR only group and lowest in SC, and significantly higher in IR–Ex4 and IR–Mel groups than those in the IR–Ex4–Mel group, but there was no notable difference in the two parameters between IR–Ex4 and IR–Mel groups.
The 24 h urine volume by 72 h was highest in the IR–Ex4–Mel group and lowest in IR only, significantly higher in IR–Ex4 and IR–Mel groups than that in SC, but it showed no difference between IR–Ex4 and IR–Mel animals (28.663 ± 2.315 vs. 22.063 ± 3.077 vs. 36.600 ± 5.381 vs. 38.038 ± 5.015 vs. 50.025 ± 2.816, p < 0.0001). Additionally, the ratio of urine protein to urine creatinine, an indicator of integrity of renal function, expressed an identical pattern compared to that of creatinine level among the five groups (0.864 ± 0.068 vs. 1.802 ± 0.122 vs. 1.451 ± 0.071 vs. 1.434 ± 0.057 vs. 1.183 ± 0.064, p < 0.001). These findings imply that combined melatonin–exendin-4 treatment offered an additional benefit of protecting the kidney from acute IR injury.
Histopathological findings of kidney parenchymal injury at 72 h after IR procedure (Figure 3)
Figure 3.
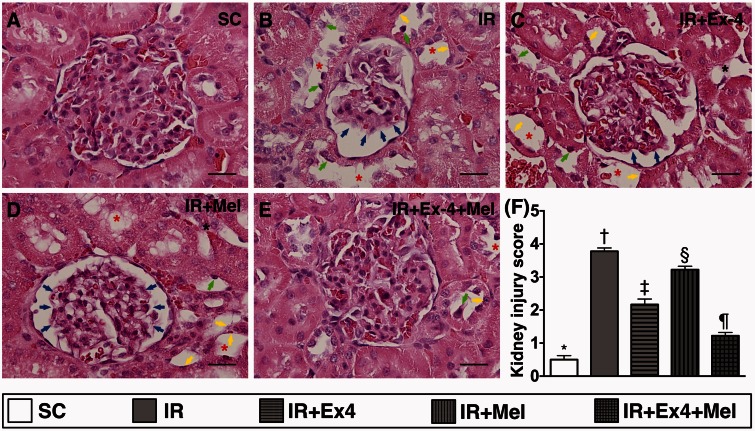
Histopathological findings of kidney parenchymal injury score at 72 h after ischemia–reperfusion (IR) procedure. (a) to (e) Light microscopic findings of H&E stain (400×) demonstrating remarkably higher degree of loss of brush border in renal tubules (yellow arrows), tubular necrosis (green arrows), tubular dilatation (red asterisk) protein cast formation (black asterisk), and dilatation of Bowman's capsule (blue arrows) in IR group than in other four groups. (f) SC vs. IR, p < 0.0001; * vs. other groups with different symbols (†, ‡, §, ¶), p < 0.0001. Scale bars in right lower corner represent 20 µm. All statistical analyses were performed by one-way ANOVA, followed by Bonferroni multiple comparison post hoc test (n=8 for each group). Symbols (*, †, ‡, §, ¶) indicate significance (at 0.05 level). Ex4: exendin-4; IR: ischemia–reperfusion; Mel: melatonin; SC: sham control. (A color version of this figure is available in the online journal.)
H&E staining showed that the kidney injury score was highest in IR only animals and lowest in SC, significantly higher in IR–Ex4 and IR–Mel groups than that in IR–Ex4–Mel group, and significantly higher in IR–Mel group than that in IR–Ex4 group (0.5± 0.210 vs. 3.778 ± 0.175 vs. 2.333 ± 0.289 vs. 3.222 ± 0.175 vs. 1.222 ± 0.175, p < 0.0001). These findings once again suggest that combined melatonin–exendin-4 treatment was superior to either alone for protecting the kidney from acute IR injury.
The protein expressions of inflammatory biomarkers in kidney parenchyma at 72 h after IR procedure (Figure 4)
Figure 4.
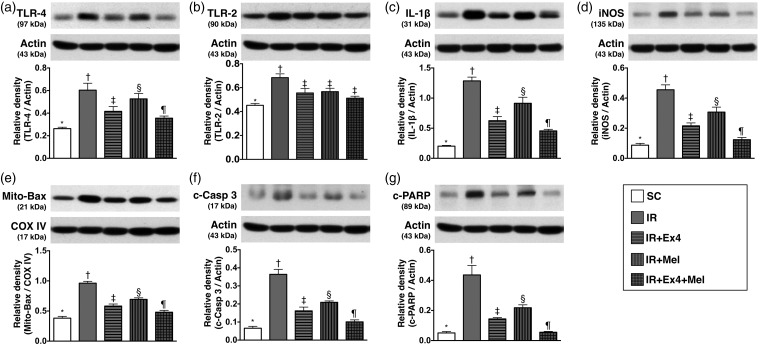
Protein expressions of inflammatory biomarkers in kidney parenchyma at 72 h after IR procedure. (a) Protein expressions of toll-like receptor 4 (TLR-4), SC vs. IR, p < 0.001; * vs. other groups with different symbols (†, ‡, §, ¶), p < 0.001. (b) Protein expression of TLR-2, SC vs. IR, p < 0.002; * vs. other groups with different symbols (†, ‡), p < 0.002. (c) Protein expression of interleukin (IL)-1β, SC vs. IR, p < 0.0001; * vs. other groups with different symbols (†, ‡, §, ¶), p < 0.0001. (d) Protein expression of inducible nitric oxide synthase (iNOS), SC vs. IR, p < 0.0001; * vs. other groups with different symbols (†, ‡, §, ¶), p < 0.0001. (e) Protein expression of mitochondrial Bax (Mit-Bax), SC vs. IR, p < 0.001; * vs. other groups with different symbols (†, ‡, §, ¶), p < 0.001. (f) Protein expression of cleaved caspase (c-Casp) 3, SC vs. IR, p < 0.0001; * vs. other groups with different symbols (†, ‡, §, ¶), p < 0.0001. (g) Cleaved protein expression of Poly (ADP-ribose) polymerase (c-PARP), SC vs. IR, p < 0.0001; * vs. other groups with different symbols (†, ‡, §, ¶), p < 0.0001. All statistical analyses were performed by one-way ANOVA, followed by Bonferroni multiple comparison post hoc test (n=8 for each group). Symbols (*, †, ‡, §, ¶) indicate significance (at 0.05 level). Ex4: exendin-4; IR: ischemia–reperfusion; Mel: melatonin; SC: sham control
The protein expressions of TLR-4 (0.263 ± 0.013 vs. 0.605 ± 0.061 vs. 0.415 ± 0.043 vs. 0.526 ± 0.048 vs. 0.356 ± 0.019, p < 0.001), IL-1β (0.202 ± 0.013 vs. 1.285 ± 0.063 vs. 0.625 0.068 vs. 0.914 ± 0.099 vs. 0.456 ± 0.026, p < 0.0001), and iNOS (0.087 ±0.012 vs. 0.455 ± 0.033 vs. 0.216 ± 0.019 vs. 0.307 ± 0.033 vs. 0.124 ± 0.015, p < 0.0001), three indicators of inflammation, were highest in IR only and lowest in SC animals, significantly higher in IR–Ex4 and IR–Mel groups than those in IR–Ex4–Mel group, and significantly higher in IR–Mel group than those in IR–Ex4 group. On the other hand, the expression of TLR-2 (0.452 ± 0.016 vs. 0.684 ± 0.032 vs. 0.555 ±0.038 vs. 0.567 ± 0.028 vs. 0.512 ± 0.016, p < 0.002), another indicator of inflammation, was significantly higher in IR only group than in other groups, and significantly lower in SC group than in IR–Ex4, IR–Mel, and IR–Ex4–Mel groups, but it showed no difference among these later three groups.
The protein expressions of mitochondrial Bax (0.382 ± 0.029 vs. 0.962 ± 0.030 vs. 0.582 ±0.035 vs. 0.694 ± 0.025 vs. 0.480 ± 0.031, p < 0.001), cleaved caspase 3 (0.066 ± 0.011 vs. 0.364 ± 0.060 vs. 0.162 ± 0.021 vs. 0.209 ± 0.008 vs. 0.101 ± 0.011, p < 0.0001), and PARP (0.051 ± 0.009 vs. 0.436 ± 0.063 vs. 0.144 ± 0.009 vs. 0.218 ± 0.019 vs. 0.055 ± 0.005, p < 0.0001), three indices of apoptotic biomarkers, showed an identical pattern compared to that of TLR-4 biomarker among the five groups.
Protein expressions of intracellular signaling of PI3K/AKT/mTOR, p53 and oxidative stress in kidney parenchyma at 72 h after IR procedure (Figure 5)
Figure 5.
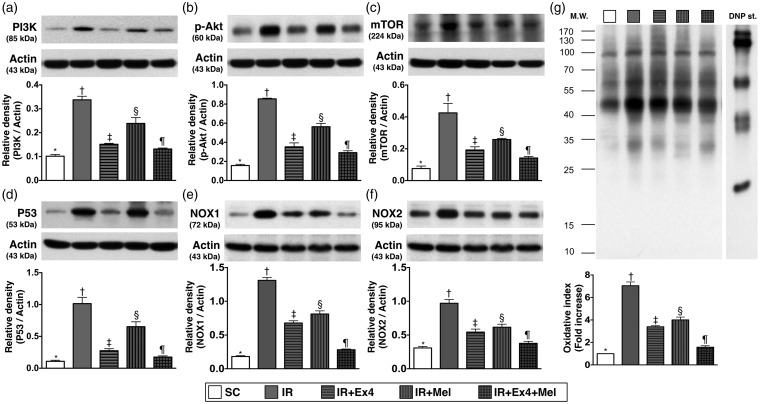
Protein expressions of PI3K, AKT, mTOR, p53, and oxidative stress in kidney parenchyma at 72 h after IR procedure. (a) Protein expression of phosphoinositide 3-kinase (PI3K), SC vs. IR, p < 0.001; * vs. other groups with different symbols (†, ‡, §, ¶), p < 0.001. (b) Protein expression of phosporylated (p)-AKT, SC vs. IR, p < 0.0001; * vs. other groups with different symbols (†, ‡, §, ¶), p < 0.0001. (c) Protein expression of mammalian target of rapamycin (mTOR), SC vs. IR, p < 0.0001; * vs. other groups with different symbols (†, ‡, §, ¶), p < 0.0001. (d) Protein expression of p53, SC vs. IR, p < 0.0001; * vs. other groups with different symbols (†, ‡, §, ¶), p < 0.0001. (e) Protein expression of NOX-1, SC vs. IR, p < 0.0001; * vs. other groups with different symbols (†, ‡, §, ¶), p < 0.0001. (f) Protein expression of NOX-2, SC vs. IR, p < 0.0001; * vs. other groups with different symbols (†, ‡, §, ¶), p < 0.0001. (g) Protein expression of oxidative index (protein carbonyls) in renal parenchyma, SC vs. IR, p < 0.0001; * vs. other groups with different symbols (†, ‡, §, ¶), p < 0.0001. (Note: right and left lanes shown on the upper panel represent control oxidized molecular protein standard and protein molecular weight marker, respectively). DNP: 1–3 dinitrophenylhydrazone. All statistical analyses were performed by one-way ANOVA, followed by Bonferroni multiple comparison post hoc test (n=8 for each group). Symbols (*, †, ‡, §, ¶) indicate significance (at 0.05 level). Ex4: exendin-4; IR: ischemia–reperfusion; Mel: melatonin; SC: sham control
The protein expressions of phosphoinositide 3-kinase (PI3K) (0.102 ± 0.007 vs. 0.338 ± 0.015 vs. 0.151 ± 0.004 vs. 0.239 ± 0.025 vs. 0.132 ± 0.004, p < 0.001), AKT (0.157 ± 0.014 vs. 0.854 ± 0.007 vs. 0.353 ± 0.041 vs. 0.563 ± 0.035 vs. 0.292 ± 0.020, p < 0.0001), and mTOR (0.076 ± 0.016 vs. 0.425 ± 0.060 vs. 0.192 ± 0.020 vs. 0.258 ± 0.007 vs. 0.142 ± 0.010, p < 0.0001), three indicators of intracellular signaling pathways important in regulating cellular growth and survival, were highest in IR group and lowest in the SC, and significantly higher in IR–Ex4 and IR–Mel groups than those in IR–Ex4–Mel group, and significantly higher in IR–Mel group than those in IR–Ex4 group. Besides, the protein expression of p53 (0.109 ± 0.017 vs. 1.015 ± 0.098 vs. 0.275 ± 0.031 vs. 0.652 ± 0.078 vs. 0.175 ± 0.020, p < 0.0001), a molecule with an important role to play in apoptosis, exhibited a pattern identical to that of PI3K/AKT/mTOR among the five groups. We suggest that an upregulation of these parameters in kidney parenchyma is the result of IR injury. Elevated levels of these parameters implicate aggravated renal injury in the animals.
The protein expressions of NOX-1 (0.182 ± 0.006 vs. 1.310 ± 0.020 vs. 0.678 ± 0.017 vs. 0.811 ± 0.023 vs. 0.282 ± 0.005, p < 0.0001), NOX-2 (0.309 ± 0.011 vs. 0.970 ± 0.028 vs. 0.543 ± 0.022 vs. 0.616 ± 0.022 vs. 0.377 ± 0.014, p < 0.0001), and oxidized protein (Oxyblot, 1 ± 0 vs. 7.045 ± 0.303 vs. 3.394 ± 0.090 vs. 4.005 ± 0.227 vs. 1.576 ± 0.120, p < 0.001), three indicators of oxidative stress, were highest in IR group and lowest in the SC, and significantly higher in IR–Ex4 and IR–Mel groups than those in IR–Ex4–Mel group, and significantly higher in IR–Mel group than those in IR–Ex4 group.
The protein expressions of markers for podocyte integrity and renal tubular injury at 72 h after IR procedure (Figure 6)
Figure 6.
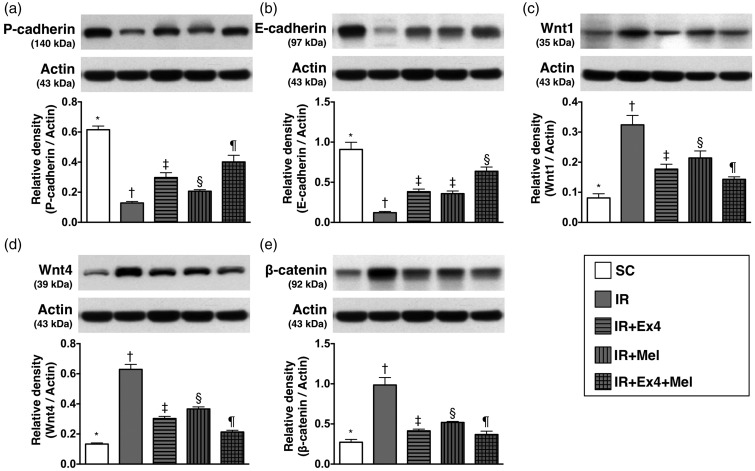
The protein expressions of biomarkers for podocyte integrity and renal tubular injury at 72 h after IR procedure. (a) Protein expression of P-cadherin, SC vs. IR, p < 0.0001; * vs. other groups with different symbols (†, ‡, §, ¶), p < 0.0001. (b) Protein expression of E-cadherin, SC vs. IR, p < 0.0001; * vs. other groups with different symbols (†, ‡, §, ¶), p < 0.0001. (c) Protein expression of Wnt1, SC vs. IR, p < 0.0001; * vs. other groups with different symbols (†, ‡, §, ¶), p < 0.001. (d) Protein expression of Wnt4, SC vs. IR, p < 0.0001; * vs. other groups with different symbols (†, ‡, §, ¶), p < 0.0001. (e) Protein expression of β-catenin, SC vs. IR, p < 0.0001; * vs. other groups with different symbols (†, ‡, §, ¶), p < 0.0001. All statistical analyses were performed by one-way ANOVA, followed by Bonferroni multiple comparison post hoc test (n=8 for each group). Symbols (*, †, ‡, §, ¶) indicate significance (at 0.05 level). Ex4: exendin-4; IR: ischemia–reperfusion; Mel: melatonin; SC: sham control
The protein expression of P-cadherin (0.615 ± 0.025 vs. 0.129 ± 0.010 vs. 0.298 ± 0.032 vs. 0.206 ± 0.010 vs. 0.401 ± 0.044, p < 0.0001) one indicator of functional integrity of podocyte, was lowest in IR animals and highest in the SC group, significantly higher in IR–Ex4–Mel group than in IR–Ex4 and IR–Mel groups, and significantly higher in IR–Ex4 group than in IR–Mel group. Additionally, the protein expression of E-cadherin (0.093 ± 0.012 vs. 0.780 ± 0.036 vs. 0.227 ± 0.006 vs. 0.416 ± 0.026 vs. 0.182 ± 0.012, p < 0.0001), another indicator of functional integrity of podocyte, was lowest in IR animals and highest in the SC group, and significantly lower in IR–Ex4 and IR–Mel groups than in IR–Ex4–Mel group, but it showed no difference between IR–Ex4 group and IR–Mel group. On the other hand, the protein expressions of Wnt1 (0.081 ± 0.014 vs. 0.324 ± 0.031 vs. 0.177 ± 0.016 vs. 0.214 ± 0.023 vs. 0.143 ± 0.008, p < 0.001), Wnt4 (0.133 ± 0.008 vs. 0.629 ± 0.033 vs. 0.303 ± 0.015 vs. 0.367 ± 0.013 vs. 0.213 ± 0.012, p < 0.0001), and β-catenin (0.272 ± 0.036 vs. 0.985 ± 0.093 vs. 0.414 ± 0.021 vs. 0.519 ± 0.013 vs. 0.369 ± 0.041, p < 0.0001), three renal damaged markers, exhibited an opposite pattern compared to that of P-cadherin among the five groups.
IF staining for identification of inflammatory cell infiltration and the expressions of Wnt1 and Wnt4 in kidney parenchyma at 72 h after IR procedure (Figures 7 and 8)
Figure 7.
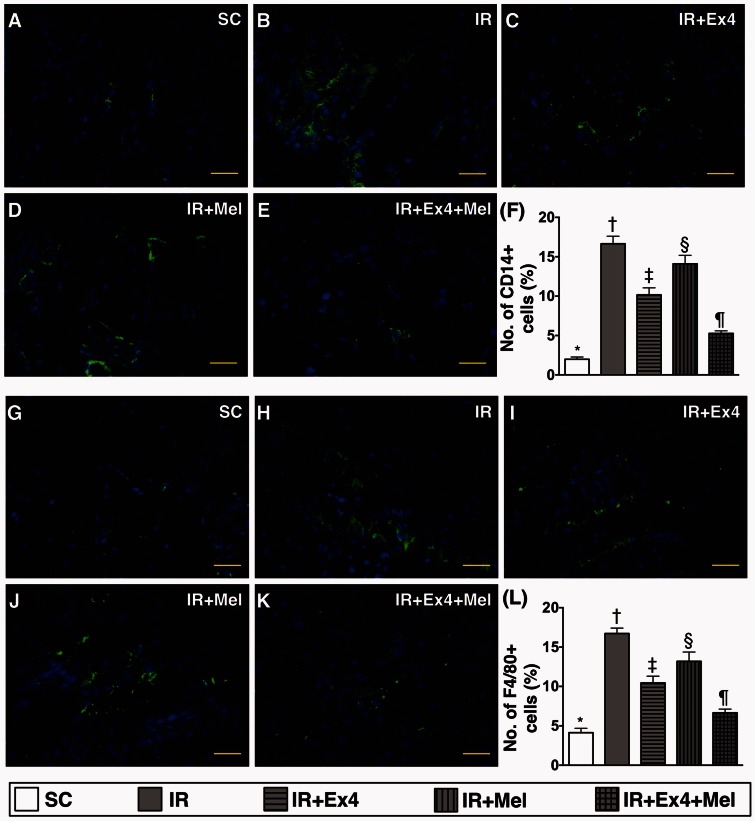
Immunofluorescent (IF) staining for identification of inflammatory cell infiltration in kidney parenchyma at 72 h after IR procedure. (a) to (e) Illustrating the microscopic finding (400×) of IF staining for identification of CD14-positively stained cells (green color) in kidney parenchyma. (f) Analytic results of CD14+ cell expression, SC vs. IR, p < 0.0001; * vs. other groups with different symbols (†, ‡, §, ¶), p < 0.0001. (g) to (k) Illustrating the microscopic finding (400×) of IF stain for identification of CD68-positively stained cells (green color) in kidney parenchyma. (l) Analytical results of F4/80+ cell expression, SC vs. IR, p < 0.0001; * vs. other groups with different symbols (†, ‡, §, ¶), p < 0.0001. Scale bars in right lower corner represent 20 µm. All statistical analyses were performed by one-way ANOVA, followed by Bonferroni multiple comparison post hoc test (n=8 for each group). Symbols (*, †, ‡, §, ¶) indicate significance (at 0.05 level). Ex4: exendin-4; IR: ischemia–reperfusion; Mel: melatonin; SC: sham control. (A color version of this figure is available in the online journal.)
Figure 8.
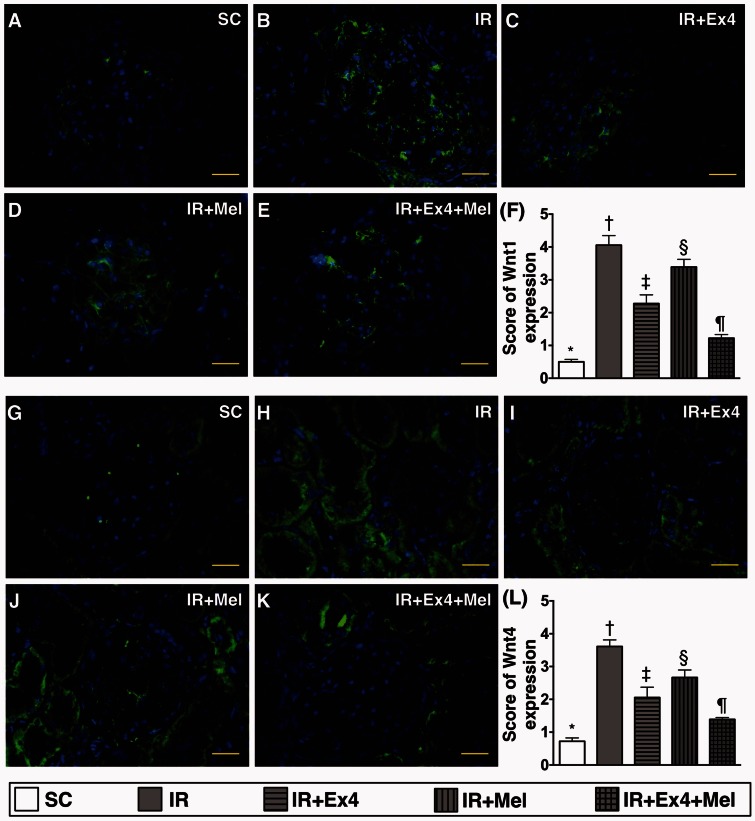
Immunofluorescent (IF) staining for identifying the expressions of Wnt1 and Wnt4 in kidney parenchyma at 72 h after IR procedure. (a) to (e) Illustrating the microscopic finding (400×) of IF staining for identification of Wnt1-positively stained cells (green color) mainly in glomeruli. (f) Analytic results of Wnt1+ cell expression, SC vs. IR, p < 0.0001; * vs. other groups with different symbols (†, ‡, §, ¶), p < 0.0001. (g) to (k) Illustrating the microscopic finding (400×) of IF stain for identification of Wnt4-positively stained cells (green color) mainly in renal tubules. (l) Analytical results of Wnt4+ cell expression, SC vs. IR, p < 0.0001; * vs. other groups with different symbols (†, ‡, §, ¶), p < 0.0001. Scale bars in right lower corner represent 20 µm. All statistical analyses were performed by one-way ANOVA, followed by Bonferroni multiple comparison post hoc test (n=8 for each group). Symbols (*, †, ‡, §, ¶) indicate significance (at 0.05 level). Ex4: exendin-4; IR: ischemia–reperfusion; Mel: melatonin; SC: sham control. (A color version of this figure is available in the online journal.)
IF staining demonstrated that the numbers of CD14+ (1.986 ± 0.290 vs. 16.648 ± 0.954 vs. 10.161 ± 0.892 vs. 14.101 ± 1.082 vs. 5.264 ± 0.329, p < 0.0001) and F4/80+ (4.139 ± 0.551 vs. 16.722 ± 0.692 vs. 10.443 ± 0.0862 vs. 13.186 ± 1.189 vs. 6.661 ± 0.0460, p < 0.0001) cells (number of CD14+/ high-power field), two indicators of inflammation, were highest in IR group and lowest in SC, significantly higher in IR–Ex4 and IR–Mel groups than those in IR–Ex4–Mel group, and significantly higher in IR–Mel group than those in IR–Ex4 groups (Figure 7).
On the other hand, the expression pattern of Wnt1 (0.667 ± 0.096 vs. 4.083 ± 0.210 vs. 2.333 ± 0.219 vs. 3.667 ± 0.192 vs. 1.333 ± 0.136, p < 0.0001) and Wnt4 (0.833 ± 0.096 vs. 3.750 ± 0.183 vs. 2.167 ± 0.210 vs. 2.833 ± 0.192 vs. 1.667 ± 0.083, p < 0.0001), two indicators of renal tubular injury, was identical to that of the expressions of CD14+ and F4/80+ cells around the renal tubules among the five groups (Figure 8).
Apoptotic nuclei and β-catenin expression in kidney parenchyma at 72 h after IR procedure (Figure 9)
Figure 9.
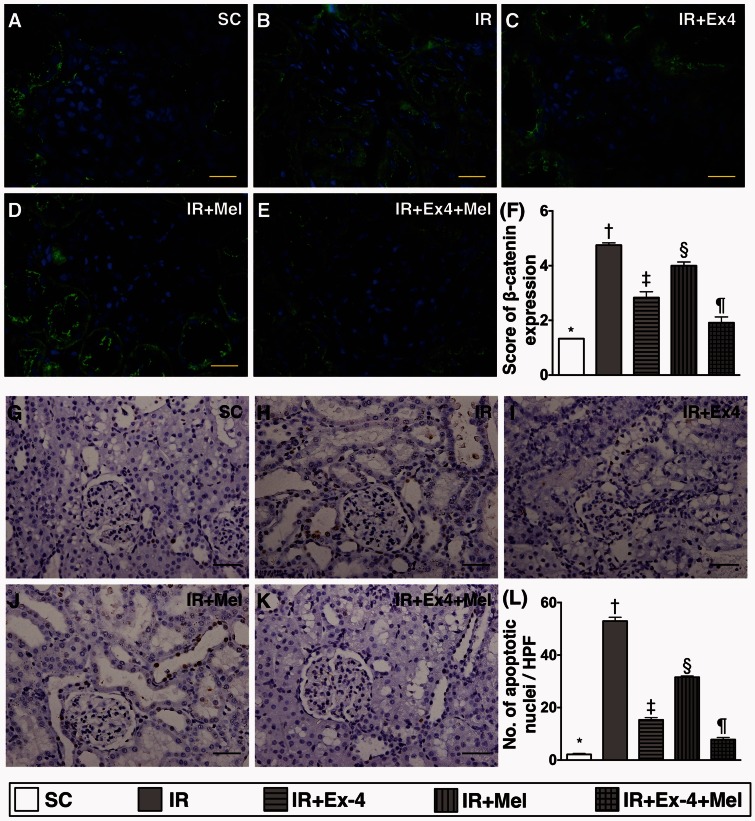
Expressions of β-catenin and apoptotic nuclei and in kidney parenchyma at 72 h after IR procedure. (a) to (e) illustration of microscopic finding (400×) of immunofluorescent stain for assessing the β-catenin-positively stained cells (green color) in renal tubules. (f) Analytic results of β-catenin+ cell expression, SC vs. IR, p < 0.0001; * vs. other groups with different symbols (†, ‡, §, ¶), p < 0.0001. (g) to (k) Microscopic finding (200×) of TUNEL assay for identification of apoptotic nuclei (gray color) in renal parenchyma. (l) Analytical results of apoptotic nucleus expression, SC vs. IR, p < 0.0001; * vs. other groups with different symbols (†, ‡, §, ¶), p < 0.0001. Scale bars in right lower corner represent 20 µm. All statistical analyses were performed by one-way ANOVA, followed by Bonferroni multiple comparison post hoc test (n=8 for each group). Symbols (*, †, ‡, §, ¶) indicate significance (at 0.05 level). Ex4: exendin-4; IR: ischemia–reperfusion; Mel: melatonin; SC: sham control. (A color version of this figure is available in the online journal.)
IF microscopy revealed that the expression of β-catenin (1.333 ± 0.0001 vs. 4.750 ± 0.083 vs. 2.833 ± 0.215 vs.4.000 ± 0.136 vs. 1.917 ± 0.210, p < 0.0001) in renal tubules was highest in IR only animals and lowest in SC, significantly higher in IR–Ex4 and IR–Mel groups than that in IR–Ex4–Mel group, and significantly in IR–Mel group than that in IR–Ex4 group. Additionally, TUNEL assay (2.2 ± 0.5 vs. 52.9 ± 1.8 vs. 15.3 ± 1.1 vs.31.6 ± 0.6 vs. 7.8 ± 1.0, p < 0.0001) identified an identical pattern between the number of apoptotic nuclei and β-catenin expression in kidney parenchyma among the five groups.
IF staining for identification of antioxidant and GLP-1 receptor expression in kidney parenchyma at 72 h after IR procedure (Figures 10 and 11)
Figure 10.
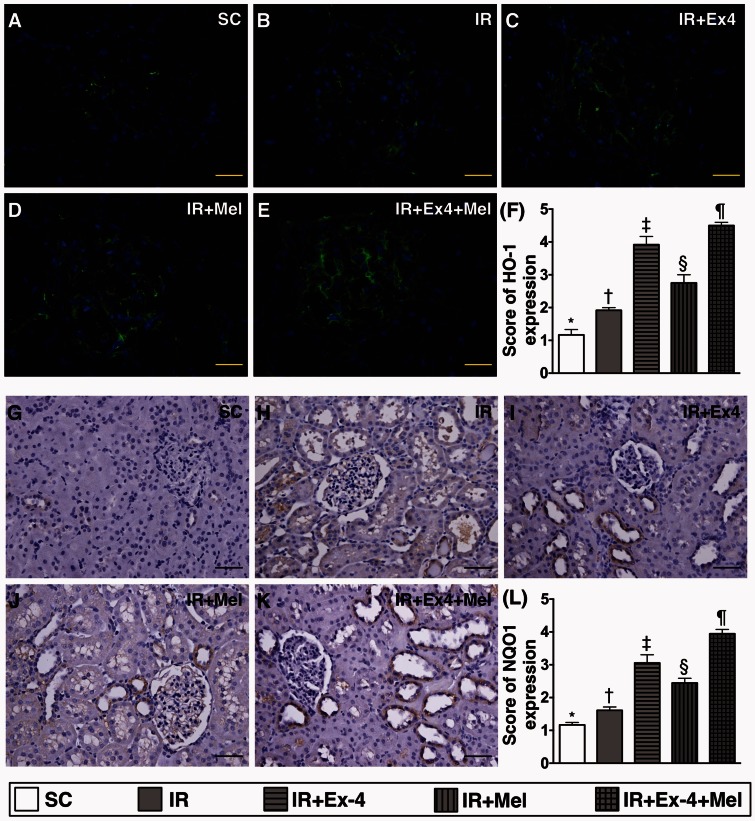
Immunohistochemical (IHC) and immunofluorescent (IF) staining for identification of antioxidants in kidney parenchyma at 72 h after IR procedure. (a) to (e) illustration of microscopic finding (400×) of IF stain for identifying the heme oxygenase (HO)-1-positively stained cells (green color) in renal tubules. Scale bars in right lower corner represent 20 µm. (f) Analytic results of HO-1+ cell expression, SC vs. IR, p < 0.0001; * vs. other groups with different symbols (†, ‡, §, ¶), p < 0.0001. (g) to (k) Illustration of microscopic finding (200×) of IHC stain for identification of NAD(P)H dehydrogenase (quinone) 1 (NQO 1) (gray color) in renal parenchyma. (l) Analytical results of NQO 1+ cell expression, SC vs. IR, p < 0.0001; * vs. other groups with different symbols (†, ‡, §, ¶), p < 0.0001. Scale bars in right lower corner represent 50 µm. All statistical analyses were performed by one-way ANOVA, followed by Bonferroni multiple comparison post hoc test (n=8 for each group). Symbols (*, †, ‡, §, ¶) indicate significance (at 0.05 level). Ex4: exendin-4; IR: ischemia–reperfusion; Mel: melatonin; SC: sham control. (A color version of this figure is available in the online journal.)
Figure 11.
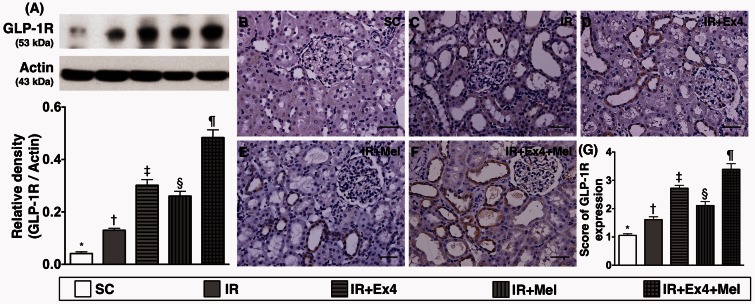
Protein and cellular expressions of glucagon-like peptide 1 receptor (GLP-1R) expression in kidney parenchyma at 72 h after IR procedure. (a) Protein expression of GLP-1R, SC vs. IR, p < 0.0001; * vs. other groups with different symbols (†, ‡, §, ¶), p < 0.0001. (b) to (f) Illustration of microscopic finding (200×) of IHC stain for identification of GLP-1R (gray color) in renal parenchyma. (g) Analytical results of GLP-1R+ cell expression, SC vs. IR, p < 0.0001; * vs. other groups with different symbols (†, ‡, §, ¶), p < 0.0001. Scale bars in right lower corner represent 50 µm. All statistical analyses were performed by one-way ANOVA, followed by Bonferroni multiple comparison post hoc test (n=8 for each group). Symbols (*, †, ‡, §, ¶) indicate significance (at 0.05 level). Ex4: exendin-4; IR: ischemia–reperfusion; Mel: melatonin; SC: sham control. (A color version of this figure is available in the online journal.)
IF microscopy showed that the numbers of positively stained HO-1+ (1.167 ± 0.167 vs. 1.917 ± 0.083 vs. 3.917 ± 0.250 vs.2.750 ± 0.250 vs. 4.500 ± 0.096, p < 0.0001) and NQO-1+ (1.167 ± 0.091 vs. 1.611 ± 0.125 vs. 3.056 ± 0.306 vs.2.444 ± 0.172 vs. 3.944 ± 0.164, p < 0.0001) cells in kidney parenchyma was significantly and progressively increased from SC to IR–Ex4–Mel group (Figure 10).
The protein expression of GLP-1R (0.041 ± 0.006 vs. 0.130 ± 0.007 vs. 0.302 ± 0.022 vs. 0.261 ± 0.018 vs. 0.484 ± 0.029, p < 0.0001) in kidney parenchyma was highest in IR–Ex4–Mel group and lowest in SC, significantly higher in IR–Ex4 and IR–Mel groups than in IR group, and significantly higher in IR–Ex4 group than in IR–Mel (Figure 11). Furthermore, IHC staining demonstrated that the expression of GLP-1R (1.056 ± 0.06 vs. 1.611 ± 0.125 vs. 2.722 ± 0.125 vs. 2.111 ± 0.172 vs. 3.389 ± 0.245, p < 0.0001) in kidney was similar to that of its protein expression among the five groups (Figure 11).
Discussion
This study, which investigated the impact of exendin-4-melatonin treatment on acute kidney IR injury, yielded several striking implications. First, both Wnt/β-catenin and PIK3/AKT/mTOR signaling pathways were turned on in the setting of acute kidney IR injury. Second, the inflammatory reaction was markedly augmented after acute kidney IR injury. Third, the markedly increased expressions of apoptotic biomarkers in kidney parenchyma after IR procedure could possibly explain substantially elevated kidney injury score and significantly deteriorated renal function in IR animals as compared with those in the SC group. Finally, these molecular perturbations were significantly reversed after exendin-4 or melatonin treatment and further significantly reversed following combined exendin-4–melatonin treatment.
One important finding in the present study is that the circulating levels of creatinine and BUN (i.e. the functional assay) were remarkably increased in IR animals compared to that of the SC group at 72 h after IR procedure. Additionally, the kidney injury score was notably increased in IR animals as compared with those in SC animals. These findings suggested that the AKI model was successfully created and ready for individual study. The most important finding is that the deteriorated renal function and kidney injury score were significantly reversed in IR animals by either melatonin or exendin-4 therapy and further significantly reversed after the combined exendin-4–melatonin treatment. Interestingly, the results of our present study were consistent with those of our previous investigation that demonstrated an additional benefit of combined therapy with exendin-4 and sitagliptin of protecting the kidney from IR injury,25 although the treatment strategies are different between the two studies.
IR injury has been previously shown to elicit vigorous inflammatory response.18,19,25–27,31,32 The essential finding in the present study is that the inflammatory reactions were substantially stronger in IR animals than those in SC animals not only at the protein level but also at the cellular level. Our findings corroborated those of the previous studies.18,19,25–27,31,33 Moreover, inflammatory reaction switched on by IR injury in organs with the generation of ROS and oxidative stress and immune response would, in turn, further contribute to organ dysfunction.27 Intriguingly, the present study further revealed an association between an increased level of inflammatory and ROS/oxidative stress parameters and enhancement of kidney injury score and the deterioration of renal function in IR animals. Therefore, the findings of the present study reinforced those of previous study.34 Of importance is that the expressions of inflammatory and ROS/oxidative stress parameters were remarkably reduced through melatonin administration, further remarkably reduced by exendin-4 treatment, and more further significantly reduced by the combined exendin-4–melatonin treatment. Our findings, again, support that combined Ex4–Mel treatment is superior to either alone for protecting the kidney from acute IR injury.
The Wnt/β-catenin signaling pathway has been identified in a wide variety of chronic kidney diseases (CKD).35,36 Besides, Wnt/β-catenin signaling has been reported to promote proteinuria, cell apoptosis, and renal interstitial fibrosis.37,38 A principal finding in the present study is that the protein and cellular expressions of Wnt1, Wnt4, and β-catenin were significantly increased in IR animals than those in SC animals. Accordingly, our findings, in addition to reinforcing those of previous studies,35–38 could at least in part explain the substantially increased apoptosis at cellular and protein levels in IR animals as compared with those in the SC group. Importantly, combined Ex4–Mel treatment was superior to either alone for suppressing the Wnt/β-catenin signaling pathway and reducing the expressions of apoptotic parameters at both protein and cellular levels.
It is well known that PI3K/AKT/mTOR is an intracellular signaling pathway which plays a central role in the regulation of cell cycle, cell proliferation, survival, and growth in response to extracellular signals.33,39 Another principal finding in the present study is that the PI3K/AKT/mTOR signaling pathway in both in vitro and in vivo studies was remarkably upregulated in TNF-α treatment and in IR animal and was significantly suppressed after exendin-4–melatonin treatment. We proposed that the upregulation of PI3K/AKT/mTOR signaling in the IR setting is a tissue/organ intrinsic response to IR stimulation (i.e. the more severe the IR damage, the more vigorous is the response). This may explain the highest expression of apoptotic parameters in IR animals without treatment compared with that in the other groups.
An interesting finding in the present study is the remarkably higher GLP-1R expression in IR–Ex4 and IR–Ex4–Mel groups than those in the other groups on Western blot and IHC staining. Our previous study also showed that, in the setting of acute kidney IR injury, this biomarker was notably upregulated after exendin-4 treatment.25 Accordingly, the finding of the present study strengthened that of our previous study.25 Another intriguing finding is that the expressions of HO-1 and NQO 1 antioxidants at cellular level were progressively increased from SC to IR–Ex4–Mel groups. This finding suggests that an increase in antioxidant expressions is an intrinsic capacity of cells/tissues in response to ischemic stress and could be augmented through combination of melatonin and exendin-4 treatment. The findings in the present study are consistent with those of our previous studies that demonstrated this phenomenon in other settings of organ IR injury.19,25,27,32
Study limitations
This study has limitations. First, although the short-term results of the present study were promising, the long-term outcome of combined exendin-4–melatonin on protecting kidney from acute IR injury remains uncertain. Second, although extensive work was done in this study, a novel mechanistic signaling pathway involved in kidney injury in the setting of IR has not been identified.
In conclusion, combined melatonin–exendin-4 therapy effectively attenuated the kidney from IR injury. Our findings highlight the potential clinical impact of this therapeutic regimen on patients with AKI, especially in the IR setting.
Acknowledgements
This work was supported by grants from the Chang Gung Memorial Hospital Research Project, Taiwan (CMRPG8C1041, CMRPG8D0611, CMRPG8D0791, CMRPG8E0331, CMRPG8E0281, CMRPG8E0231).
Authors' contributions
All authors discussed the results and implications and commented on the manuscript at all stages. Y-CC and S-YH made equal contribution. All authors contributed extensively to the work presented in this paper. Y-CC and S-YH designed, performed experiments, and prepared the manuscript, C-CY and P-HS participated in the design, interpretation of the studies, and analysis of the data. Y-LC, T-HH, G-SK, and S-YC conducted the experiments and analysis of the data. K-HC and H-JC developed analytical tools. H-KY and F-YL supervised results analysis, edited, and reviewed the manuscript.
Declaration of Conflicting Interests
The author(s) declared no potential conflicts of interest with respect to the research, authorship, and/or publication of this article.
References
- 1.Chertow GM, Burdick E, Honour M, Bonventre JV, Bates DW. Acute kidney injury, mortality, length of stay, and costs in hospitalized patients. J Am Soc Nephrol 2005; 16, 3365–70. [DOI] [PubMed] [Google Scholar]
- 2.Srisawat N, Kellum JA. Acute kidney injury: definition, epidemiology, and outcome. Curr Opin Crit Care 2011; 17, 548–55. [DOI] [PubMed] [Google Scholar]
- 3.Hsu CY, McCulloch CE, Fan D, Ordonez JD, Chertow GM, Go AS. Community-based incidence of acute renal failure. Kidney Int 2007; 72, 208–12. [DOI] [PMC free article] [PubMed] [Google Scholar]
- 4.Waikar SS, Curhan GC, Wald R, McCarthy EP, Chertow GM. Declining mortality in patients with acute renal failure, 1988 to 2002. J Am Soc Nephrol 2006; 17, 1143–50. [DOI] [PubMed] [Google Scholar]
- 5.Friedericksen DV, Van der Merwe L, Hattingh TL, Nel DG, Moosa MR. Acute renal failure in the medical ICU still predictive of high mortality. S Afr Med J 2009; 99, 873–5. [PubMed] [Google Scholar]
- 6.Wehbe E, Brock R, Budev M, Xu M, Demirjian S, Schreiber MJ, Jr, Stephany B. Short-term and long-term outcomes of acute kidney injury after lung transplantation. J Heart Lung Transplant 2012; 31, 244–51. [DOI] [PubMed] [Google Scholar]
- 7.Pickering JW, James MT, Palmer SC. Acute kidney injury and prognosis after cardiopulmonary bypass: a meta-analysis of cohort studies. Am J Kidney Dis 2015; 65, 283–93. [DOI] [PubMed] [Google Scholar]
- 8.Coca SG, Yusuf B, Shlipak MG, Garg AX, Parikh CR. Long-term risk of mortality and other adverse outcomes after acute kidney injury: a systematic review and meta-analysis. Am J Kidney Dis 2009; 53, 961–73. [DOI] [PMC free article] [PubMed] [Google Scholar]
- 9.Sadat U, Usman A, Boyle JR, Hayes PD, Solomon RJ. Contrast medium-induced acute kidney injury. Cardiorenal Med 2015; 5, 219–28. [DOI] [PMC free article] [PubMed] [Google Scholar]
- 10.Thongprayoon C, Cheungpasitporn W, Srivali N, Ungprasert P, Kittanamongkolchai W, Greason KL, Kashani KB. Acute kidney injury after transcatheter aortic valve replacement: a systematic review and meta-analysis. Am J Nephrol 2015; 41, 372–82. [DOI] [PubMed] [Google Scholar]
- 11.de Mendonca A, Vincent JL, Suter PM, Moreno R, Dearden NM, Antonelli M, Takala J, Sprung C, Cantraine F. Acute renal failure in the ICU: risk factors and outcome evaluated by the SOFA score. Intensive Care Med 2000; 26, 915–21. [DOI] [PubMed] [Google Scholar]
- 12.Groeneveld AB, Tran DD, van der Meulen J, Nauta JJ, Thijs LG. Acute renal failure in the medical intensive care unit: predisposing, complicating factors and outcome. Nephron 1991; 59, 602–10. [DOI] [PubMed] [Google Scholar]
- 13.Liotta M, Olsson D, Sartipy U, Holzmann MJ. Minimal changes in postoperative creatinine values and early and late mortality and cardiovascular events after coronary artery bypass grafting. Am J Cardiol 2014; 113, 70–5. [DOI] [PubMed] [Google Scholar]
- 14.Hobson CE, Yavas S, Segal MS, Schold JD, Tribble CG, Layon AJ, Bihorac A. Acute kidney injury is associated with increased long-term mortality after cardiothoracic surgery. Circulation 2009; 119, 2444–53. [DOI] [PubMed] [Google Scholar]
- 15.Bihorac A, Yavas S, Subbiah S, Hobson CE, Schold JD, Gabrielli A, Layon AJ, Segal MS. Long-term risk of mortality and acute kidney injury during hospitalization after major surgery. Ann Surg 2009; 249, 851–8. [DOI] [PubMed] [Google Scholar]
- 16.Lafrance JP, Miller DR. Acute kidney injury associates with increased long-term mortality. J Am Soc Nephrol 2010; 21, 345–52. [DOI] [PMC free article] [PubMed] [Google Scholar]
- 17.Li B, Cohen A, Hudson TE, Motlagh D, Amrani DL, Duffield JS. Mobilized human hematopoietic stem/progenitor cells promote kidney repair after ischemia/reperfusion injury. Circulation 2010; 121, 2211–20. [DOI] [PMC free article] [PubMed] [Google Scholar]
- 18.Chen YT, Sun CK, Lin YC, Chang LT, Chen YL, Tsai TH, Chung SY, Chua S, Kao YH, Yen CH, Shao PL, Chang KC, Leu S, Yip HK. Adipose-derived mesenchymal stem cell protects kidneys against ischemia-reperfusion injury through suppressing oxidative stress and inflammatory reaction. J Transl Med 2011; 9, 51–51. [DOI] [PMC free article] [PubMed] [Google Scholar]
- 19.Chen HH, Lin KC, Wallace CG, Chen YT, Yang CC, Leu S, Chen YC, Sun CK, Tsai TH, Chen YL, Chung SY, Chang CL, Yip HK. Additional benefit of combined therapy with melatonin and apoptotic adipose-derived mesenchymal stem cell against sepsis-induced kidney injury. J Pineal Res 2014; 57, 16–32. [DOI] [PubMed] [Google Scholar]
- 20.Munshi R, Hsu C, Himmelfarb J. Advances in understanding ischemic acute kidney injury. BMC Med 2011; 9, 11–11. [DOI] [PMC free article] [PubMed] [Google Scholar]
- 21.Chen Q, Camara AK, Stowe DF, Hoppel CL, Lesnefsky EJ. Modulation of electron transport protects cardiac mitochondria and decreases myocardial injury during ischemia and reperfusion. Am J Physiol Cell Physiol 2007; 292, C137–47. [DOI] [PubMed] [Google Scholar]
- 22.Hirayama A, Nagase S, Ueda A, Oteki T, Takada K, Obara M, Inoue M, Yoh K, Hirayama K, Koyama A. In vivo imaging of oxidative stress in ischemia-reperfusion renal injury using electron paramagnetic resonance. Am J Physiol Renal Physiol 2005; 288, F597–603. [DOI] [PubMed] [Google Scholar]
- 23.Bonventre JV, Yang L. Cellular pathophysiology of ischemic acute kidney injury. J Clin Invest 2011; 121, 4210–21. [DOI] [PMC free article] [PubMed] [Google Scholar]
- 24.Bagshaw SM, Bennett M, Haase M, Haase-Fielitz A, Egi M, Morimatsu H, D'Amico G, Goldsmith D, Devarajan P, Bellomo R. Plasma and urine neutrophil gelatinase-associated lipocalin in septic versus non-septic acute kidney injury in critical illness. Intensive Care Med 2010; 36, 452–61. [DOI] [PubMed] [Google Scholar]
- 25.Chen YT, Tsai TH, Yang CC, Sun CK, Chang LT, Chen HH, Chang CL, Sung PH, Zhen YY, Leu S, Chang HW, Chen YL, Yip HK. Exendin-4 and sitagliptin protect kidney from ischemia-reperfusion injury through suppressing oxidative stress and inflammatory reaction. J Transl Med 2013; 11, 270–270. [DOI] [PMC free article] [PubMed] [Google Scholar]
- 26.Chen YT, Yang CC, Zhen YY, Wallace CG, Yang JL, Sun CK, Tsai TH, Sheu JJ, Chua S, Chang CL, Cho CL, Leu S, Yip HK. Cyclosporine-assisted adipose-derived mesenchymal stem cell therapy to mitigate acute kidney ischemia-reperfusion injury. Stem Cell Res Ther 2013; 4, 62–62. [DOI] [PMC free article] [PubMed] [Google Scholar]
- 27.Sheu JJ, Chang MW, Wallace CG, Chiang HJ, Sung PH, Tsai TH, Chung SY, Chen YL, Chua S, Chang HW, Sun CK, Lee FY, Yip HK. Exendin-4 protected against critical limb ischemia in obese mice. Am J Transl Res 2015; 7, 445–59. [PMC free article] [PubMed] [Google Scholar]
- 28.Oeseburg H, de Boer RA, Buikema H, van der Harst P, van Gilst WH, Sillje HH. Glucagon-like peptide 1 prevents reactive oxygen species-induced endothelial cell senescence through the activation of protein kinase A. Arterioscler Thromb Vasc Biol 2010; 30, 1407–14. [DOI] [PubMed] [Google Scholar]
- 29.Kim S, Moon M, Park S. Exendin-4 protects dopaminergic neurons by inhibition of microglial activation and matrix metalloproteinase-3 expression in an animal model of Parkinson's disease. J Endocrinol 2009; 202, 431–9. [DOI] [PubMed] [Google Scholar]
- 30.Sun CK, Lee FY, Kao YH, Chiang HJ, Sung PH, Tsai TH, Lin YC, Leu S, Wu YC, Lu HI, Chen YL, Chung SY, Su HL, Yip HK. Systemic combined melatonin-mitochondria treatment improves acute respiratory distress syndrome in the rat. J Pineal Res 2015; 58, 137–50. [DOI] [PubMed] [Google Scholar]
- 31.Chen YL, Sun CK, Tsai TH, Chang LT, Leu S, Zhen YY, Sheu JJ, Chua S, Yeh KH, Lu HI, Chang HW, Lee FY, Yip HK. Adipose-derived mesenchymal stem cells embedded in platelet-rich fibrin scaffolds promote angiogenesis, preserve heart function, and reduce left ventricular remodeling in rat acute myocardial infarction. Am J Transl Res 2015; 7, 781–803. [PMC free article] [PubMed] [Google Scholar]
- 32.Chang CL, Sung PH, Sun CK, Chen CH, Chiang HJ, Huang TH, Chen YL, Zhen YY, Chai HT, Chung SY, Tong MS, Chang HW, Chen HH, Yip HK. Protective effect of melatonin-supported adipose-derived mesenchymal stem cells against small bowel ischemia-reperfusion injury in rat. J Pineal Res 2015; 59, 206–20. [DOI] [PubMed] [Google Scholar]
- 33.Hassan B, Akcakanat A, Holder AM, Meric-Bernstam F. Targeting the PI3-kinase/Akt/mTOR signaling pathway. Surg Oncol Clin N Am 2013; 22, 641–64. [DOI] [PMC free article] [PubMed] [Google Scholar]
- 34.Sheu JJ, Chua S, Sun CK, Chang LT, Yen CH, Wu CJ, Fu M, Yip HK. Intra-coronary administration of cyclosporine limits infarct size, attenuates remodeling and preserves left ventricular function in porcine acute anterior infarction. Int J Cardiol 2011; 147, 79–87. [DOI] [PubMed] [Google Scholar]
- 35.DiRocco DP, Kobayashi A, Taketo MM, McMahon AP, Humphreys BD. Wnt4/beta-catenin signaling in medullary kidney myofibroblasts. J Am Soc Nephrol 2013; 24, 1399–412. [DOI] [PMC free article] [PubMed] [Google Scholar]
- 36.He W, Tan RJ, Li Y, Wang D, Nie J, Hou FF, Liu Y. Matrix metalloproteinase-7 as a surrogate marker predicts renal Wnt/beta-catenin activity in CKD. J Am Soc Nephrol 2012; 23, 294–304. [DOI] [PMC free article] [PubMed] [Google Scholar]
- 37.He W, Dai C, Li Y, Zeng G, Monga SP, Liu Y. Wnt/beta-catenin signaling promotes renal interstitial fibrosis. J Am Soc Nephrol 2009; 20, 765–76. [DOI] [PMC free article] [PubMed] [Google Scholar]
- 38.He W, Kang YS, Dai C, Liu Y. Blockade of Wnt/beta-catenin signaling by paricalcitol ameliorates proteinuria and kidney injury. J Am Soc Nephrol 2011; 22, 90–103. [DOI] [PMC free article] [PubMed] [Google Scholar]
- 39.Katso R, Okkenhaug K, Ahmadi K, White S, Timms J, Waterfield MD. Cellular function of phosphoinositide 3-kinases: implications for development, homeostasis, and cancer. Annu Rev Cell Dev Biol 2001; 17, 615–75. [DOI] [PubMed] [Google Scholar]


