Abstract
Intrauterine growth retardation (IUGR) is a disorder that can result in permanent changes in the physiology and metabolism of the newborn, which increased the risk of disease in adulthood. Evidence supports IUGR as a risk factor for the development of diabetes mellitus, which could reflect changes in pancreas developmental pathways. We sought to characterize the IUGR-induced alterations of the complex pathways of pancreas development in a rat model of IUGR. We analyzed the pancreases of Sprague Dawley rats after inducing IUGR by feeding a maternal low calorie diet from gestational day 1 until term. IUGR altered the pancreatic structure, islet areas, and islet quantities and resulted in abnormal morphological changes during pancreatic development, as determined by HE staining and light microscopy. We identified multiple differentially expressed genes in the pancreas by RT-PCR. The genes of the insulin/FoxO1/Pdx1/MafA signaling pathway were first expressed at embryonic day 14 (E14). The expressions of insulin and MafA increased as the fetus grew while the expressions of FoxO1 and Pdx1 decreased. Compared with the control rats, the expressions of FoxO1, Pdx1, and MafA were lower in the IUGR rats, whereas insulin levels showed no change. Microarray profiling, in combination with quantitative real-time PCR, uncovered a subset of microRNAs that changed in their degree of expression throughout pancreatic development. In conclusion, our data support the hypothesis that IUGR influences the development of the rat pancreas. We also identified new pathways that appear to be programmed by IUGR.
Keywords: Intrauterine growth retardation, pancreas development, insulin/Fox-O1/Pdx1/MafA, microRNA, let-7d*, miR-21*, miR-23a*
Introduction
Intrauterine growth retardation (IUGR), commonly characterized as the failure of a fetus to reach its growth potential,1 refers to a fetus in the 10th percentile or two standard deviations lower in fetal weight clinically than the average of its peer group. IUGR is associated with an increased incidence of perinatal mortality,2 as well as an elevated risk of developing metabolic syndrome (MS) later in life, exemplified by coronary heart disease, hypertension, hyperlipidemia, and type 2 diabetes.3 Several studies have demonstrated that MS occurred in adulthood had close relationship with early growth.4
Recent, epidemiological data strongly indicate that infants experiencing IUGR due to poor maternal nutrition during pregnancy have a propensity for obesity and MS during adulthood.5 In addition, IUGR animal models show a decreased beta cell mass and lower pancreatic insulin content,6 which inevitably leads to glucose intolerance and insulin resistance. Therefore, a lack of adequate nutrition in pregnancy leads to IUGR in the fetus, adversely influencing the early stages of pancreatic formation and causing extensive damage to the structure and function of pancreatic beta cells.7
Some research has implicated the operation of the Insulin/FoxO1/Pdx1/MafA signaling pathway in pancreas development, beta-cell differentiation, and the maintenance of mature beta-cell function.8,9 The Pdx-1 gene is thought to be the master control gene during pancreatic development, whereas MafA is a recently isolated beta-cell-specific transcription factor that functions as a potent activator of insulin gene transcription. The FoxO1 (forkhead protein) factors are the mammalian homologous of the DAF-16 gene (a transcription regulatory gene), and several studies indicate that FoxO1 is an important target of Akt in the insulin/IGF signaling pathway.10 Nakae et al. suggested that FoxO1 can negatively regulate islet beta-cell sensitivity to insulin, i.e. inhibition of FoxO1 enhances the sensitivity of islet beta cells to insulin.11
MicroRNAs (miRNAs) are an endogenous conserved class of small non-coding RNAs (18–25 nucleotides long) that are generally believed to either block the translation or induce the degradation of target mRNAs by binding to the 3′-untranslated region (UTR) of the target genes.12 Many miRNA species have been identified, and some of them show tissue-specific expression in different combinations across diverse organs. Recent reports have demonstrated an abundant expression of many miRNAs in the pancreas and that miRNA expression has a tremendous effect on pancreatic functions (e.g. insulin production and secretion, pancreatic islet development, β-cell differentiation, and insulin resistance) and are also involved in diverse aspects of glucose homeostasis and lipid metabolism.13,14 Rosero et al.15 uncovered an alteration in specific groups of miRNAs during human fetal pancreatic development, including expression of miR-124a, a key regulator of Foxa2 expression and intracellular signaling in beta cells.16 Another study indicated that miR-7, miR-9, miR-375, and miR-376 were specific islet miRNAs that were expressed at high levels during human pancreatic development.17 MiR-375, an islet miRNA, is essential for endocrine pancreas function, since inactivation leads to an impairment of glucose homeostasis involving increased alpha cell mass and decreased beta cell mass. The expression of miR-375 is controlled by transcriptional mechanisms operating through promoter containing a TATA box.18 Knocking out of miR-375 in mice results in hyperglycemic, and these mice also show an increase in total pancreatic alpha-cell numbers and a decrease in pancreatic beta-cell mass.19 Abnormalities in expression of downstream genes of signaling pathways and in regulatory mechanisms occur following up- or down-regulation of miRNA expression, resulting in disruption of protein metabolic equilibrium and cell homeostasis, and eventually leading to a disease state.
In this study, we intended to explore whether IUGR influences the development of the rat pancreas and to identify some possible new pathways that appear to be programmed by IUGR.
Materials and methods
Construction of IUGR models
Sprague-Dawley (SD) rats (15 males and 45 females) weighing 250–300 g were supplied from the Experimental Animal Center of Nanjing Medical University. The animal experiments were approved by the University Committee of Laboratory Animal Care and Use and strictly followed the guidelines of the National Animal Research Center. The rats were allowed to copulate at a ratio of one male: three females after three days of adaptive feeding. The beginning of pregnancy was determined by presence of spermatozoa in vaginal smears. Pregnant rats were housed in individual steel cages and randomly divided into two groups: a control group and an IUGR group; the two groups were fed with different diets from the day of conception until delivery. Diets were isocaloric. A 22% protein diet was used for the control group, and a 9% protein diet was used for the IUGR group, as described elsewhere.20 Contents of minerals, especially sodium (0.2%), vitamins, fat (control group, 4%; IUGR group, 6%), disaccharides (10%), starch (control group, 45%; IUGR group, 47%), methionine (control group, 0.53%; 0.48%), folate (8 mg/kg), and the ratio of other amino acids were similar. After delivery, the neonatal rats in the control group were weighted, and the mean and standard deviation were calculated. IUGR rats were identified as those animals that were less than two standard deviations when compared with the mean of the control group.
Specimen collections
The adult female rats were sacrificed under isofluran (Abbott 100% (V/V)) anesthesia on embryonic day 14 and 19. The pancreases isolated from their embryos (E14 and E19) or from newborn rats (E21) were examined under a microscope. Some pancreases were postfixed in 10% paraformaldehyde fixative overnight at 4℃ and routinely embedded in paraffin, while others were kept at −80℃ for total RNA extraction.
Detection of pancreatic histopathological changes
Each paraffin embedded sample was sliced into 4-µm-thick sections, and three sections of each pancreatic sample were stained using a HE staining kit (Genmed Scientifics Inc., USA). The samples were observed with a light microscope to analyze the changes in islet β cells and to evaluate the islet lesion. Three to five high power fields of every section were selected randomly. We counted the islet numbers and area in the fields of the E14, E19, and E21 rat pancreas sections and averaged the values to determine the development of pancreatic acini and islets.
Isolation of total RNA from pancreatic tissues
TRIzol reagent (Invitrogen Technologies Co, USA) was used to isolate the total RNA. All procedures were performed using the protocol described by the manufacturer. The RNA quantity was determined spectrophotometrically on an A260 and A260/A280 ratio using the One Drop OD-1000+, and RNA quality was checked by electrophoresis on a 1% agarose/formaldehyde gel. Isolated RNA was stored at −70℃ prior to gene array analysis.
Detection of the expression levels of insulin/FoxO1/Pdx1/MafA mRNA through quantitative real-time PCR (qRT-PCR)
A 1 µg of total RNA was reverse transcribed using a High-Capacity cDNA Reverse Transcription Kits (Applied Biosystems, CA) with random primers. The polymerase chain reaction was carried out for all samples according to the protocol of the SYBR Select Master Mix kit (Applied Biosystems). All PCR amplification reactions were carried out in triplicate and the detection was performed on an Applied ABI Prism 7500 PCR system (Applied Biosystems). The primers are listed in Table 1. The sample expression levels were normalized to the housekeeping gene, β-actin and evaluated using the 2−ΔΔCt (Ct is the thresholdcycle) method.
Table 1.
Primers used for PCR
| mRNAs | Sequences |
|---|---|
| Insulin | F: 5′-CACGATGGAGGGGCCGGACTCATC-3′ |
| R: 5′-TAAAGACCTCTATGCCAACACAGT-3′ | |
| FoxO1 | F: 5′-ATGGCTATGGTAGGATGGGT-3′ |
| R: 5′-CTAAAAGGAGGGGTGAAGGG-3′ | |
| Pdx1 | F: 5′-GGTGCCAGAGTTCAGTGCTAATC-3′ |
| R: 5′-CTTCCCTGTTCCAGCGTTCC-3′ | |
| MafA | F: 5′-AGGAGGAGGTCATCCGACTG-3′ |
| R: 5′-CTTCTCGCTCTCCAGAATGTG-3′ | |
| β-Actin | F: 5′-CACGATGGAGGGGCCGGACTCATC-3′ |
| R: 5′-TAAAGACCTCTATGCCAACACAGT-3′ |
Detection of the expression levels of insulin/FoxO1/Pdx1/MafA by Western blot
Total protein was extracted according to the protocol of the manufacturer using the Whole Cell Lysis Assay Kit (Beyone BioTECH, China). Western blot analysis was carried out as described previously.21 Labeled bands were detected by Immun-Star horseradish peroxidase Chemiluminescent kit. Images were captured, and the intensity of the bands was quantitated using the Bio-Rad VersaDoc image system (Bio-Rad, USA).
Microarray analysis
The RNA samples were labeled using the miRCURY™ Hy3™/Hy5™ Power labeling kit (Exiqon) and hybridized on the miRCURY™ LNA Array (v.11.0) by the Shanghai Kangchen Biological Technology Company. The arrays were scanned using an Axon GenePix 4000B microarray scanner and the scanned images were then imported into GenePix Pro V6.0 software for grid alignment and data analysis. The average value was compared to the standard value of same samples through fold-change filtering. The experimental group value was considered significantly different from the control if it was 1.5 times higher or 0.67 times lower than standard value of the normal group.
Assessment of miRNA expression by the qRT-PCR
The expression levels of rno-let-7d*, miR-21*, and miR-23a* were quantified by TaqMan RT-PCR assays (Applied Biosystems) and carried out following the manufacturer’s recommendations. In brief, 250 ng of total RNA was reverse transcribed using the TaqMan MicroRNA Reverse Transcription Kit (Applied Biosystems) with let-7d*, miR-21* and miR-23a* specific RT primers (Applied Biosystems). The qPCR was performed in triplicate in a 20 µL volume in 96-well plates on an ABI Prism 7500 Sequence Detection System (ABI Prism, Applied Biosystems) with a standard absolute quantification thermal cycling program and using the 7500 v2.0.1 software to determine the Ct value. The primers are listed in Table 2. Cycling conditions were as follows: incubation at 50℃ for 2 min, denaturation at 95℃ for 10 min, followed by 40 cycles of denaturation for 15 s at 95℃, and annealing and extension for 1 min at 60℃. After the reactions, the Ct data were determined using default threshold settings and the mean Ct was determined from the triplicate PCRs. The U6 snRNA (Applied Biosystems) served as an endogenous control. The amount of let-7d*, miR-21*, and miR-23a* were normalized relative to the amount of U6 (ΔΔCt = ΔCt miRNA − ΔCtU6).
Table 2.
Primers used for reverse transcription and quantitative real-time PCR in the pancreas
| mRNAs | Sequences |
|---|---|
| rno-miR-124 | F: 5′-GGTAAGGCACGCGGT-3′ |
| R: 5′-CAGTGCGTGTCGTGGAGT-3′ | |
| rno-let-7d* | F: 5′-GGCTATACGACCTGCTGC-3′ |
| R: 5′-CAGTGCGTGTCGTGGAGT-3′ | |
| rno-miR-21 | F: 5′-GGCGTAGCTTATCAGACTGAAT-3′ |
| R: 5′-CGAGGAAGAAGACGGAAGAAT-3′ | |
| Rno-miR-23 | F: 5′-ATCACATTGCCAGGG-3′ |
| R: 5′-GTGCAGGGTCCGAGGT-3′ | |
| U6 | F: 5′-GCTTCGGCAGCACATATACTAAAAT-3′ |
| R: 5′-CGCTTCACGAATTTGCGTGTCAT-3′ |
Statistical analysis
Quantitative data were presented as the mean ± standard error of the mean (SEM). The effects were analyzed using Student’s t-test or ANOVA followed by the Newman–Keuls test for multiple comparisons using SPSS 20.0 Software. Differences were considered statistically significant when P < 0.05.
Results
Body-weight measurement of embryonic and newborn rats
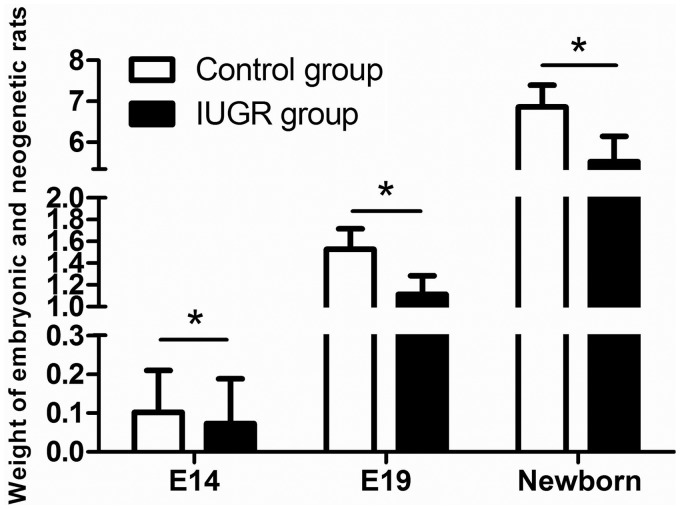
The method of maternal food intake limitation was used to construct the rat IUGR model. Offspring from the food restriction group with body weights below the mean values of the body weights of the control group by more than 2SD were defined as IUGR rats. The body weights were significantly lower for the embryonic and newborn rats with IUGR than for the normal control group (P < 0.05, Figure 1). The incidence of IUGR with food restriction was 43.31%, while the control group incidence was only 2.04%.
Figure 1.
Weights of embryonic and newborn rats from the control (white bars) and IUGR (black bars) groups, at embryonic day 14 (E14), embryonic day 19 (E19), and embryonic day 21 (newborn). At E14, the weight data were recorded from n = 86 control and n = 73 IUGR rats, at E19 from n = 53 control and n = 46 IUGR rats, and for the newborns from n = 44 control and n = 56 IUGR rats. *P < 0.05
The detection of histopathological changes in the pancreatic tissues of embryonic and newborn rats
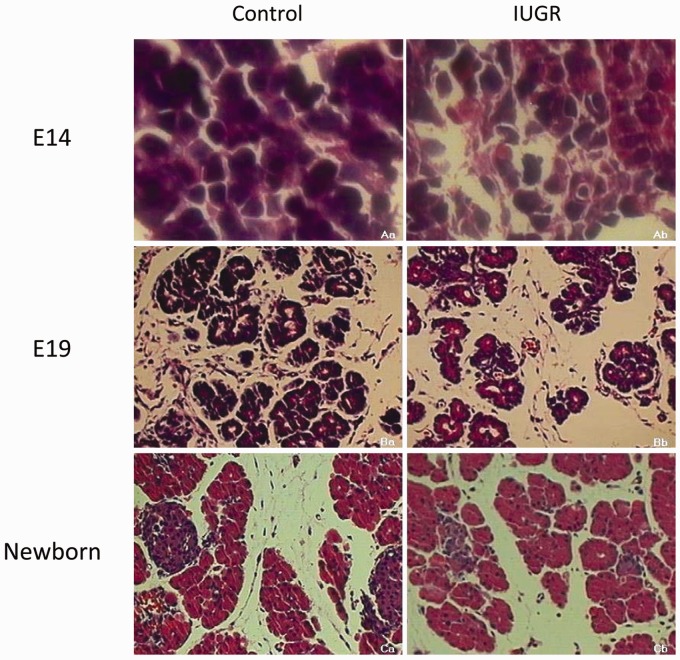
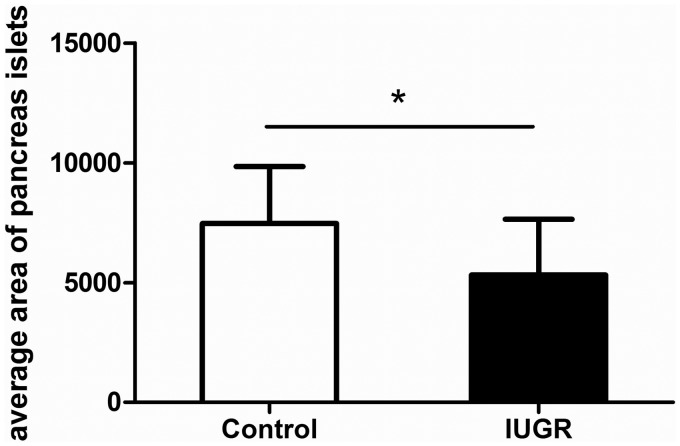
As shown in Figure 2, light microscope examination of HE stained sections revealed the appearance of pancreatic acinar structures in the normal rats at E14. The acini were well arranged and organized in an orderly fashion. By E19, the acinar structures had assumed a clear cauliflower-like shape. The beta cells began to gather together and the islets were taking their initial shape. In the newborn rats, the typical structures of the endocrine and exocrine compartments of the pancreas had formed, more. Pancreatic islets were present, the size was larger, the shape was fuller, and the outline was clear. When compared with the normal rats, the IUGR group at E14 showed disordered acini and the pancreatic construction was not clear. The pancreatic tissue at E19 was arranged loosely. The quantities and areas of pancreatic islets were lower in the newborn IUGR rats than in the equivalently aged controls (*P < 0.05, Figures 2 and 3).
Figure 2.
Light microscope examination of pancreas tissues stained with HE for control (a) and IUGR (b) rats. The “a” represents the rats at embryonic day 14 (E14); “b” represents the rats at embryonic day 19 (E19); “c” represents the rats at embryonic day 21 (newborn). Image a: 1000× magnification; images b and c: 200× magnification. (A color version of this figure is available in the online journal.)
Figure 3.
Comparison of the average area (µm2) of the pancreatic islets in newborn control and IUGR rats. Control group: n = 39; IUGR group: n = 36. *P < 0.05
The expression levels of insulin/FoxO1/Pdx1/MafA mRNA related to islet formation and maturation at different stages of rat pancreas development
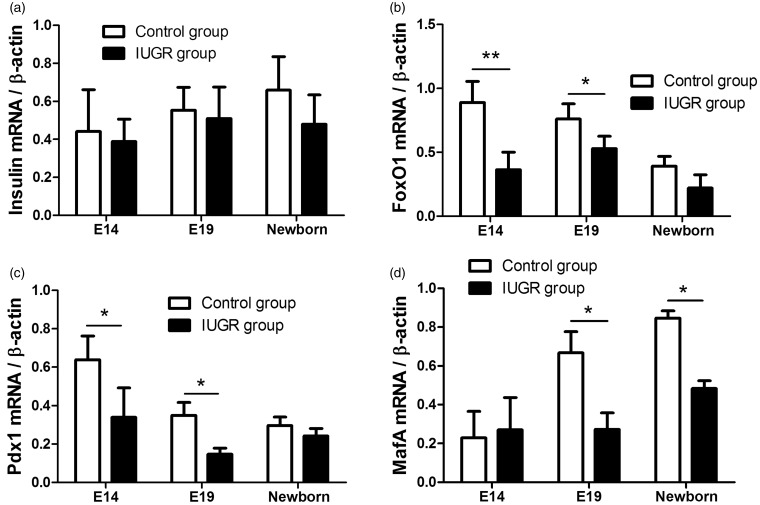
The qRT-PCR results confirmed that mRNA expression of the genes involved in the insulin/FoxO1/Pdx1/MafA signaling pathway began by E14. The mRNA expressions of insulin and MafA increased as the fetus grew, while those of FoxO1 and Pdx1 decreased. The mRNA expressions of FoxO1, Pdx1, and MafA were lower in the IUGR rats than in the normal control rats (*P < 0.05, Figure 4b–d), while the mRNA expression of insulin gene showed no significant change (P > 0.05, Figure 4a).
Figure 4.
The relative expression levels of insulin/FoxO1/Pdx1/MafA mRNA. (a) The relative expression level of insulin mRNA increased as the fetus grew. And the insulin mRNA expression was similar in both the IUGR and the control groups (P > 0.05). (b) The FoxO1 mRNA expression initiated at E14 and decreased as the fetus grew. The expression of FoxO1 mRNA was decreased in the IUGR rats compared to the control rats, and the difference was statistically significant (*P < 0.05, **P < 0.01). (c) The Pdx1 mRNA expression initiated at E14 and decreased as the fetus grew. The expression of Pdx1 mRNA was lower in the IUGR rats than in the control rats, and the difference was statistically significant (*P < 0.05). D: The relative expression level of MafA mRNA increased as the fetus grew. The expression of MafA mRNA decreased in the IUGR rats compared to the control rats, and the difference was statistically significant (*P < 0.05). β-Actin served as an endogenous control
The expression levels of insulin/FoxO1/Pdx1/MafA protein
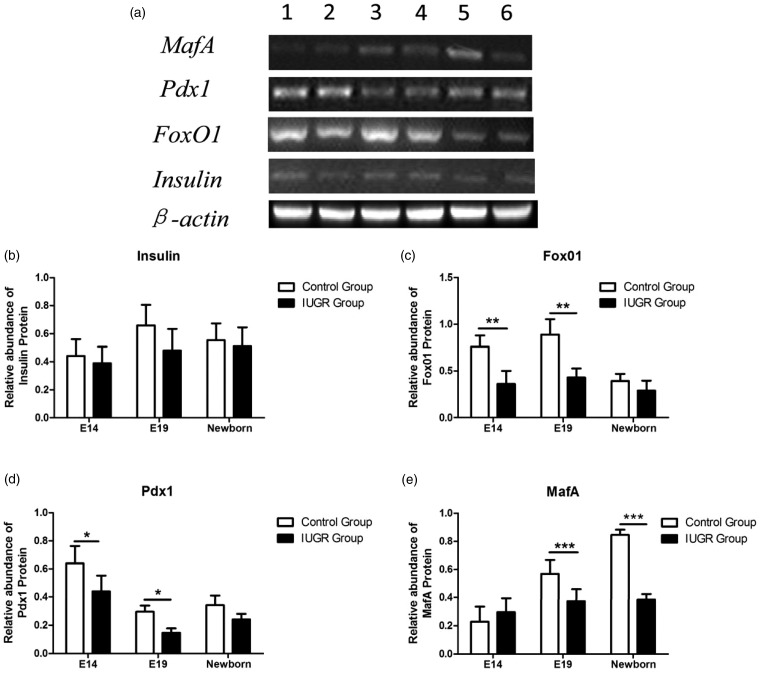
We examined insulin/FoxO1/Pdx1/MafA protein expression levels of pancreatic tissues at different stages of rat pancreas development via Western blot analysis (Figure 5a). The protein expressions of the genes involved in the insulin/FoxO1/Pdx1/MafA signaling pathway began by E14. The protein expressions of insulin and MafA increased as the fetus grew, while those of FoxO1 and Pdx1 decreased. The protein expressions of FoxO1, Pdx1, and MafA were significantly lower in the IUGR group than in the control group (*P < 0.05, Figure 5 c–e), while no significant difference between the insulin protein expressions of two groups was detected (P > 0.05, Figure 5b).
Figure 5.
Analysis of insulin/FoxO1/Pdx1/MafA protein expression levels via Western blot. (a) Tissue lysates from pancreas tissues of control (lanes: 1, 3, 5) and IUGR (lanes: 2, 4, 6) rats at embryonic day 14 (lanes: 1, 2), embryonic day 19 (lanes: 3, 4), and embryonic day 21 (newborn, lanes: 5, 6) were probed with different specific antibodies that recognize the insulin, FoxO1, Pdx1, or MafA protein, respectively. β-Actin served as control. (b–e) Densitometric analysis of bands showed the ratio of insulin, FoxO1, Pdx1, or MafA expression to β-actin expression. White bars: control group; black bars: IUGR group. *P < 0.05., **P < 0.01, ***P < 0.001
miRNA expression profiles during pancreas development
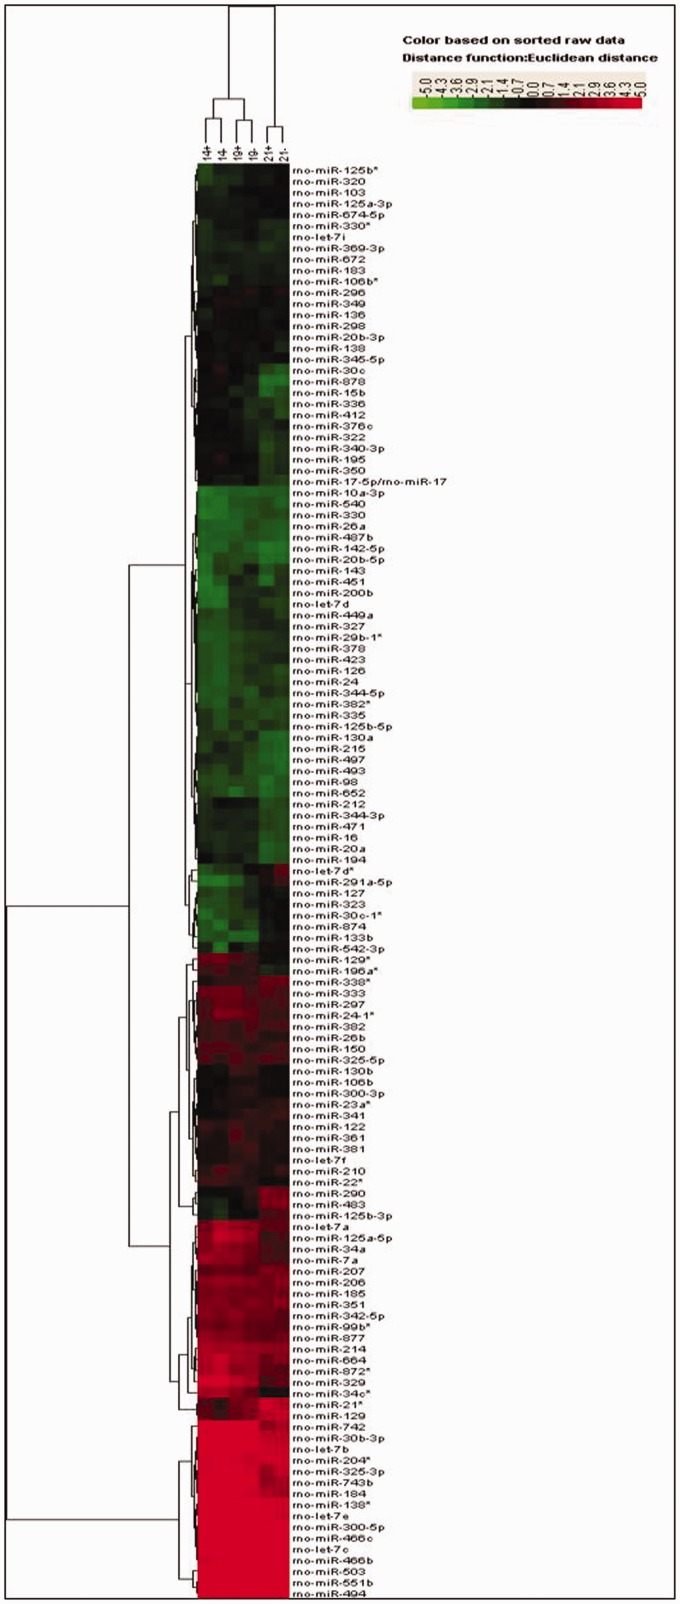
The heat-map figures obtained from the data using Cluster and Treeview software are presented in Figure 6. The control group showed increased expression of 44 miRNAs (fold change ≥ 1.5) and decreased expression of 28 miRNAs (fold change ≤ 0.67) when comparing E19 to E14 (Table 3). Comparison of E21 to E14 revealed up-regulation of 64 miRNAs and down-regulation of 55 miRNAs (Table 3). Comparison of E21 to E19 revealed 40 over-expressed miRNAs and 52 low-expressed miRNAs (Table 3). When compared with the normal control groups at E14, E19, and E21, the IUGR groups revealed over-expression of 10, 22, and 9 miRNAs, respectively, and reduced expression of 26, 15, and 13 miRNAs, respectively (Table 4). These results demonstrated that the differences in miRNA expression were correlated with pancreatic development.
Figure 6.
Total microRNA expression profiles during pancreatic development. Expression profiles of microRNAs from the control group and the IUGR group at embryonic days 14, 19, and 21 (E14, E19, and newborn), respectively. The colors of the heat map indicate microRNA up-regulation (red) and down-regulation (green). (A color version of this figure is available in the online journal.)
Table 3.
MiRNAs with significantly altered expression levels during pancreas development in control group
| miRNA: up-regulated | miRNA: down-regulated | |
|---|---|---|
| (Fold change ≥ 1.5) | (Fold change ≤ 0.67) | |
| E19 | miR-141, miR-21*, miR-200b, | miR-34c*, miR-878, miR-129, miR-434, |
| VS | miR-23b, miR-30a, miR-134, | miR-880, miR-34a, miR-10a-5p, |
| E14 | miR-208, miR-140*, miR-222, | miR-30c, let-7a, miR-336, miR-883, |
| miR-320, miR-378, miR-103, miR-483, | miR-872, miR-333, miR-215, miR-329, | |
| miR-200c, miR-485, miR-129, miR-331, | miR-195, miR-342-3p, miR-376c, | |
| miR-125b-3p, miR-449a, miR-341, | miR-664, miR-210, miR-349, miR-412, | |
| miR-290, let-7f, miR-423, miR-361, | miR-7a, miR-15b, miR-150, | |
| miR-381, miR-540, miR-330, miR-383, | miR-125a-5p, miR-497, miR-24-1* | |
| let-7d*, miR-193, miR-126, miR-130b, | ||
| miR-542-3p, miR-291a-5p, miR-24, | ||
| miR-500, miR-106b, miR-300-3p, | ||
| miR-26a, miR-127, miR-874, | ||
| miR-327, miR-29b-1*, miR-143 | ||
| E21 | miR-291a-5p, let-7d*, miR-129, | miR-30c, miR-742, miR-16, miR-144, |
| VS | miR-542-5p, miR-874, miR-290, | miR-878, let-7f, miR-22*, miR-23b, |
| E19 | miR-363*, miR-344-5p, miR-331, | miR-497,let-7d, miR-329, miR-215, |
| miR-216a, miR-150, miR-147, | miR-381, miR-449a, miR-26a, | |
| miR-365, miR-207, miR-125b-3p, | miR-24-1*, miR-7a, miR-126, miR-28, | |
| miR-483, miR-21*, miR-30c-1*, | miR-129*, let-7a, let-7i, miR-140*, | |
| miR-296*, miR-1, miR-27a*, | miR-15b, miR-350, miR-184, miR-34c*, | |
| miR-376b-3p, miR-22, miR-299, | miR-130b, miR-34a, miR-130a, | |
| miR-23a*, miR-376a, miR-708, | miR-212, miR-872*, miR-471, | |
| miR-542-3p, miR-133b, miR-124, | miR-125a-5p, miR-138, miR-883, | |
| miR-30c-2*, miR-485, miR-375, | miR-20a, miR-196a*, miR-300-3p, | |
| miR-146a, miR-760-3p, miR-450a, | miR-743b, miR-20b-5p, miR-138*, | |
| miR-208, miR-99b, miR-338*, | miR-26b, miR-344-3p, miR-30b-3p, | |
| miR-323, | miR-340-3p, miR-194, miR-93, | |
| miR-195, miR-143, miR-17-5p/17, | ||
| miR-330* | ||
| E21 | miR-483, miR-291a-5p, miR-200c, | miR-129*, miR-196a*, miR-34a, |
| VS | miR-129, miR-22, miR-323, | miR-742, miR-412, miR-195, miR-743b, |
| E14 | miR-103, miR-375, miR-290, | miR-26b, miR-212, miR-199a-3p, |
| miR-365, miR-193, miR-23a*, | miR-20a, miR-194, let-7e, miR-377, | |
| miR-423, miR-24, miR-27a*, | miR-297, miR-336, miR-333, miR-330*, | |
| miR-494, miR-147, miR-500, | miR-93, miR-872*, miR-15b, miR-880, | |
| miR-330, miR-383, miR-148b-3p, | miR-878, miR-218, miR-329, miR-497, | |
| miR-327, miR-141, miR-542-5p, | miR-322, miR-883, miR-10a-5p, | |
| miR-21*, miR-124, miR-208, | miR-34c*, miR-350, miR-434, miR-184, | |
| miR-874, miR-99b, miR-485, | miR-125a-5p, miR-471, miR-130a, | |
| miR-216a, miR-146a, miR-320, | miR-138*, miR-30c, miR-342-3p, | |
| miR-708, miR-217, miR-127, | miR-325-3p, miR-664, miR-215, | |
| miR-222, miR-338*, miR-326, | miR-349, miR-24-1*,let-7a, miR-22*, | |
| miR-299, miR-200b, miR-450a, | miR-30b-3p, miR-138, miR-493, | |
| miR-29b-1*, miR-296*, miR-125b-3p, | miR-342-5p, miR-344-3p, | |
| miR-363*, let-7d*, miR-376a, | miR-17-5p/17, miR-7a, miR-340-3p, | |
| miR-542-3p, let-7d, miR-331, miR-1, | miR-20b-5p | |
| miR-341, miR-133b, miR-344-5p, | ||
| miR-30c-2*, miR-30c-1*, miR-106b*, | ||
| miR-760-3p, miR-134, miR-30a, | ||
| miR-378, miR-451, miR-376b-3p |
Table 4.
MiRNAs with significantly altered expression levels in IUGR group (VS control group)
| IUGR group/ | miRNA: up-regulated | miRNA: down-regulated |
|---|---|---|
| control group | (Fold change ≥ 1.5) | (Fold change ≤ 0.67) |
| On E14 | miR-542-3p, miR-345-5p, | miR-883, miR-20b-5p, miR-210, let-7a, |
| miR-125b-5p, miR-335, miR-23b, | miR-125a-5p, miR-215, miR-136, | |
| miR-194, miR-21*, miR-129, | miR-30c-1*, miR-451, miR-125b*, | |
| miR-125b-3p,miR-494 | miR-24-1*, miR-151*, miR-338*, | |
| miR-298, miR-296, miR-212, miR-708, miR-488, miR-328, miR-326, | ||
| miR-143, miR-30c, miR-330*, | ||
| miR-297,miR-349, miR-195 | ||
| On E19 | miR-880, miR-361, miR-194, | miR-483, miR-320, miR-296,miR-323, |
| miR-412,miR-150, miR-497, | miR-652, let-7d*, miR-143, miR-130a, | |
| miR-434, miR-883, miR-138, | miR-222, miR-382, miR-291a-5p, | |
| miR-493, miR-342-3p, | miR-30a, miR-26a, miR-140, miR-290 | |
| miR-342-5p, miR-542-3p, | ||
| miR-333, miR-349, | ||
| miR-7a, miR-218*, miR-34c*, | ||
| miR-336 | ||
| On E21 | miR-29a, miR-376a, | miR-451, rno-let-7d*, miR-291a-5p, |
| miR-20b-3p, miR-412, | miR-296, miR-99b, miR-210, | |
| miR-141, miR-449a, miR-138, | miR-15b, miR-329, miR-92b, | |
| miR-340-5p, miR-540 | miR-325-3p, miR-485, | |
| miR-299, miR-208 |
QRT-PCR analysis of miRNA expression
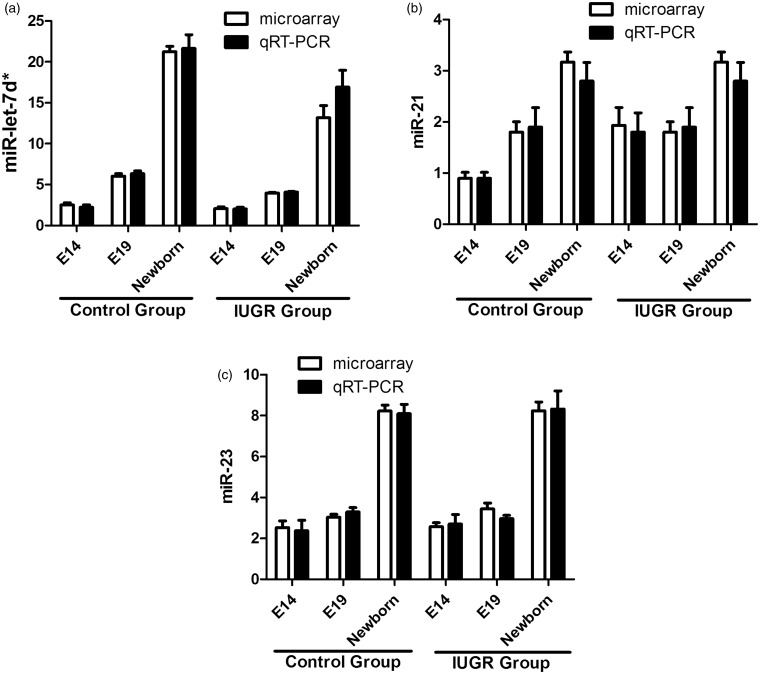
The miRNA profiling results were confirmed by qRT-PCR assays on such miRNAs: let-7d*, miR-21*, and miR-23a*. Figure 7 shows that the levels of let-7d* were gradually increased in parallel with the pancreatic development at E14, e19, and E21 in both the control and IUGR groups. And the let-7d* expression levels were decreased in IUGR group compared with the controls. The expression of miR-21* was gradually increased in parallel with the pancreatic development at E14, e19, and E21 (newborn) in the control group. The expressions of miR-21* in the IUGR group showed no significant change at E14 and E19, and up-regulated at E21. The expression level of miR-23a* was increased only in the newborn rats in both the control and IUGR groups. The results of the qRT-PCR assays closely matched the microarray data.
Figure 7.
Validation of the microarray data by qRT-PCR. The qRT-PCR results for miR-let-7d* (a), miR-21* (b), and miR-23a* (c) from both the control group and IUGR group closely matched the corresponding microarray data. White bars: the microarray data; black bars: the qRT-PCR data
Discussion
In the present study, we detected abnormal morphological changes occurring during pancreatic development, including alterations in pancreatic structure, islet area, and islet quantities, in an IUGR rat group, as determined by using HE staining and light microscopy. We used the miRCURY™ Hy3™/Hy5™ Power labeling kit (Exiqon) and hybridization on the miRCURY™ LNA Array (v.11.0) to examine the influence of maternal dietary calorie restriction on fetal islet gene expression and the global expression profile of miRNAs in pancreatic islets of IUGR fetal rats.22 We also performed RT-PCR to quantify the levels of three selected miRNAs (rno-let-7d*, rno-miR-21*, and rno-miR-23a*) to validate the results from the miRNA arrays. Our data provide an insight into the mechanisms responsible for IUGR and the specific gene expression signatures that could be used as diagnostic or prognostic clinical tools.
IUGR is a major complication of perinatal malnutrition. It not only affects the growth of the fetus or the morbidity rates and death rates of perinatal infants, but it also affects intellectual and physical development in childhood and youth, and increases the susceptibility to MS in adulthood.23–25 The results of our experiments show that the incidence of IUGR with food restriction was 43.31%, while the incidence in the control group was only 2.04%, confirming that maternal food intake limitation is useful for constructing IUGR models.
The pancreatic islet cells divide faster and increase rapidly in number during the fetal and neonatal periods and this proliferation is regulated by nutrients. Studies show that IUGR can lead to a decrease in the number of islet β cells and to lower insulin secretion in the fetus. In this study, the morphological observation of the development of the pancreas showed that the development of pancreas islets of the IUGR group lagged behind the control group at each developmental stage. This was manifested as loosely arranged pancreatic tissue, unclear pancreatic structure, and reduced quantities and areas of the pancreatic islets in the newborn rats, consistent with previous research. Malnutrition of pregnant rats can therefore affect offspring development and may lead to pancreatic defects and subsequent dysfunction.
The insulin/FoxO1/Pdx1/MafA signaling pathway plays a crucial role in regulating pancreatic development, beta-cell differentiation, and mature beta-cell function. This present study found that the expression of insulin gene was initiated by E14, which suggests that the pancreas is capable of producing insulin early in embryonic development. And the expression of the insulin gene increased in parallel with gestational age. It was reported that the fasting blood-glucose and insulin levels of newborn IUGR rats were both significantly lower than those of the control as determined by glucose tolerance test, so the ability of IUGR rats to regulate blood glucose was worse than that of normal newborn rats.26 However, in our study, the expression of insulin gene showed no significant difference in the IUGR and control groups (P > 0.05), which indicates that the capacity for insulin synthesis was unaffected in the IUGR rats.
Pdx1 is recognized as a homologous protein expressed in the early development of the pancreas.27 It plays crucial roles in the proliferation and differentiation process in the endocrine and exocrine compartments of pancreas. The homozygous phenotype of missing Pdx1 gene manifests as hypoplasia of the pancreas.28 The transcription factor FoxO1 is co-expressed with Pdx1. Previous studies have hypothesized that the damage to the insulin and IGF-1 signaling pathway may cause the activation of the FoxO1 protein, thereby reducing insulin sensitivity and leading to insulin resistance. In the present study, the FoxO1 and Pdx1 genes were both highly expressed in the early development of the pancreas and their expressions decreased with the subsequent embryonic development. And their relative expressions in the IUGR and control groups showed differences at E14 and E19, which are the crucial periods for completion of pancreatic differentiation (P < 0.05), which suggests that intrauterine malnourishment influences pancreas differentiation and maybe one of the mechanisms of insulin resistance in adulthood. In addition, Pdx1 is also an important transcription factor that participates in the transcription of many pancreatic β cell specific genes, including the insulin gene. The present study showed that the expression level of Pdx1 was decreased in the IUGR group compared to the control group, which suggests that IUGR has effects on the expression of Pdx1, which would further influence the transcription of the insulin gene. However, our finding of no alteration in the expression of the insulin gene in the two groups hints that the expression of the insulin gene is not regulated solely by only one factor, but is most likely regulated by many transcription factors, including Pdx1.
Research has shown that the MafA gene, which is closely associated with insulin transcription in vivo, is an important regulator of insulin secretion and pancreatic islet structure. Our finding of an increased expression of MafA during normal fetal growth and a significantly decreased in IUGR rats suggests that IUGR can affect the expression of MafA and in turn may alter the islet structure and the transcription of this insulin gene. Based on the result above, the recent breakthrough discovery of miRNAs has shed light on their roles in pancreatic islet development29 and beta-cell differentiation.30 FoxA2 (HNF3 beta) and its target genes Pdx-1, which are crucial for early pancreas development, recently been shown to be regulated by miR-124a.30 We suggest that the genes associated with the pancreas development may also be regulated by miRNAs.
This study performed miRNA expression profiling at three key stages of rat embryonic pancreas development: E14, E19, and newborn. A series of miRNAs in the IUGR group showed significant differences when compared with the normal group and these miRNAs changed during the progression of pancreatic development in response to the IUGR conditions, indicating that these miRNAs may have a close relationship with pancreatic formation and function. For example, miR-542-3p, an inhibitor of cell proliferation that target predicted binding sites in the 3’-UTR of the survivin,31 was significantly up-regulated in the IUGR rats at E14 (3.28-fold change) and E19 (1.68-fold change), when comparing with the control rats. Another suppressor, miR-138, was also enriched in the IUGR group at eE19 (1.60-fold change) and E21 (1.85-fold change), which has been shown to reduce cell viability and colony formation by the induction of cell arrest in HCC cell lines.32 We postulate that miR-542-3p and miR-138 might coordinately cause cell growth arrest by down-regulating multiple cell cycle-related genes, which may result in the observed reduction in beta cell mass and ultimately the occurrence of diabetes. The Let-7 family of miRNAs has been demonstrated to regulate multiple aspects of glucose metabolism and was also over-expressed in the IUGR rats in the present study. In addition, miR-296, miR-141, miR-200c, and miR-21*, which are related to cancer were also expressed at high levels (>5 fold change) during pancreatic development. Apart from the miRNAs already mentioned, a few other miRNAs were expressed at low levels, especially in the early stage of pancreatic development (e.g. miR-210, miR-212, miR-143, miR-136, miR-488, and miR-125a-5p). However, the function and target genes of these miRNAs need more in-depth study.
In conclusion, intrauterine malnutrition of IUGR rats caused damage to the pancreas structure during development and reduced the quantities and size of the pancreatic islets. Studies have confirmed that IUGR rats are more prone to insulin resistance and impaired glucose tolerance as adults.33 Our study shows that this propensity toward MS may be associated with congenital developmental disorders of the pancreas. Changes in the expression levels of FoxO1, Pdx1, and MafA in IUGR rats may adversely affect the process of pancreas differentiation and functional maturation. The lack of an effect of IUGR on the insulin gene suggests that the regulation of insulin expression probably occurs via several factors. The changes in miRNA expression profiles in the pancreatic tissues of IUGR rats and the way that miRNAs function suggest that pancreatic genes are regulated by multiple miRNAs. The miRNA profile therefore provides broad and useful information for exploration of potential two-way levels of regulation and control of gene expression whereby miRNAs target multiple mRNAs, and where the target mRNAs are regulated in parallel by multiple miRNAs. This remains to be further confirmed. The understanding of the underlying mechanisms may provide a blueprint for future therapeutic interventions to reduce IUGR and its long-term complications.
Author contributions
ZL and CW conceived of the study, carried out the molecular genetic studies and drafted the manuscript. DY and ZZ participated in the design of the study and performed the statistical analysis. LQ participated in its design and coordination and helped to draft the manuscript. All authors read and approved the final manuscript.
Acknowledgements
This work was funded by the project of Talented Youth Fund in Nanjing (QRX11051), and the general project of Nanjing Health Bureau (YKK12106).
Declaration of conflicting interests
The author(s) declared no potential conflicts of interest with respect to the research, authorship, and/or publication of this article.
References
- 1.Dessi A, Ottonello G, Fanos V. Physiopathology of intrauterine growth retardation: from classic data to metabolomics. J Matern Fetal Neonatal Med 2012; 25: 13–8. [DOI] [PubMed] [Google Scholar]
- 2.Bernstein IM, Horbar JD, Badger GJ, Ohlsson A, Golan A. Morbidity and mortality among very-low-birth-weight neonates with intrauterine growth restriction. The Vermont Oxford Network. Am J Obstet Gynecol 2000; 182: 198–206. [DOI] [PubMed] [Google Scholar]
- 3.Neitzke U, Harder T, Plagemann A. Intrauterine growth restriction and developmental programming of the metabolic syndrome: a critical appraisal. Microcirculation 2011; 18: 304–11. [DOI] [PubMed] [Google Scholar]
- 4.Morrison JL, Duffield JA, Muhlhausler BS, Gentili S, McMillen IC. Fetal growth restriction, catch-up growth and the early origins of insulin resistance and visceral obesity. Pediatr Nephrol 2010; 25: 669–77. [DOI] [PubMed] [Google Scholar]
- 5.Raghow R. Gestational nutrition and the development of obesity during adulthood. World J Diabetes 2012; 3: 178–81. [DOI] [PMC free article] [PubMed] [Google Scholar]
- 6.Schwitzgebel VM, Somm E, Klee P. Modeling intrauterine growth retardation in rodents: impact on pancreas development and glucose homeostasis. Mol Cell Endocrinol 2009; 304: 78–83. [DOI] [PubMed] [Google Scholar]
- 7.Delghingaro-Augusto V, Ferreira F, Bordin S, Do AM, Toyama MH, Boschero AC, Carneiro EM. A low protein diet alters gene expression in rat pancreatic islets. J Nutr 2004; 134: 321–7. [DOI] [PubMed] [Google Scholar]
- 8.Kaneto H, Miyatsuka T, Shiraiwa T, Yamamoto K, Kato K, Fujitani Y, Matsuoka TA. Crucial role of PDX-1 in pancreas development, beta-cell differentiation, and induction of surrogate beta-cells. Curr Med Chem 2007; 14: 1745–52. [DOI] [PubMed] [Google Scholar]
- 9.Wang H, Brun T, Kataoka K, Sharma AJ, Wollheim CB. MAFA controls genes implicated in insulin biosynthesis and secretion. Diabetologia 2007; 50: 348–58. [DOI] [PMC free article] [PubMed] [Google Scholar]
- 10.Glauser DA, Schlegel W. The emerging role of FOXO transcription factors in pancreatic beta cells. J Endocrinol 2007; 193: 195–207. [DOI] [PubMed] [Google Scholar]
- 11.Nakae J, Kitamura T, Kitamura Y, Biggs WR, Arden KC, Accili D. The forkhead transcription factor Foxo1 regulates adipocyte differentiation. Dev Cell 2003; 4: 119–29. [DOI] [PubMed] [Google Scholar]
- 12.Shukla GC, Singh J, Barik S. MicroRNAs: processing, maturation, target recognition and regulatory functions. Mol Cell Pharmacol 2011; 3: 83–92. [PMC free article] [PubMed] [Google Scholar]
- 13.Seyhan AA. MicroRNAs with different functions and roles in disease development and as potential biomarkers of diabetes: progress and challenges. Mol Biosyst 2015; 11: 1217–34. [DOI] [PubMed] [Google Scholar]
- 14.Locke JM, Harries LW. MicroRNA expression profiling of human islets from individuals with and without type 2 diabetes: promises and pitfalls. Biochem Soc Trans 2012; 40: 800–3. [DOI] [PubMed] [Google Scholar]
- 15.Rosero S, Bravo-Egana V, Jiang Z, Khuri S, Tsinoremas N, Klein D, Sabates E, Correa-Medina M, Ricordi C, Domínguez-Bendala J, Diez J, Pastori RL. MicroRNA signature of the human developing pancreas. BMC Genomics 2010; 11: 509–509. [DOI] [PMC free article] [PubMed] [Google Scholar]
- 16.Baroukh N, Ravier MA, Loder MK, Hill EV, Bounacer A, Scharfmann R, Rutter GA, Van Obberghen E. MicroRNA-124a regulates Foxa2 expression and intracellular signaling in pancreatic beta-cell lines. J Biol Chem 2007; 282: 19575–88. [DOI] [PubMed] [Google Scholar]
- 17.Joglekar MV, Joglekar VM, Hardikar AA. Expression of islet-specific microRNAs during human pancreatic development. Gene Expr Patterns 2009; 9: 109–13. [DOI] [PubMed] [Google Scholar]
- 18.Avnit-Sagi T, Vana T, Walker MD. Transcriptional mechanisms controlling miR-375 gene expression in the pancreas. Exp Diabetes Res 2012; 2012: 891216–891216. [DOI] [PMC free article] [PubMed] [Google Scholar]
- 19.Poy MN, Hausser J, Trajkovski M, Braun M, Collins S, Rorsman P, Zavolan M, Stoffel M. miR-375 maintains normal pancreatic alpha- and beta-cell mass. Proc Natl Acad Sci U S A 2009; 106: 5813–8. [DOI] [PMC free article] [PubMed] [Google Scholar]
- 20.Buffat C, Boubred F, Mondon F, Chelbi ST, Feuerstein JM, Lelievre-Pegorier M, Vaiman D, Simeoni U. Kidney gene expression analysis in a rat model of intrauterine growth restriction reveals massive alterations of coagulation genes. Endocrinology 2007; 148: 5549–57. [DOI] [PubMed] [Google Scholar]
- 21.Beinder L, Faehrmann N, Wachtveitl R, Winterfeld I, Hartner A, Menendez-Castro C, M1 Rauh, M2 Ruebner, H2 Huebner, SC1 Noegel, HG1 Doerr, W1 Rascher, FB1 Fahlbusch. Detection of expressional changes induced by intrauterine growth restriction in the developing rat mammary gland via exploratory pathways analysis. PloS One 2014; 9: e100504–e100504. [DOI] [PMC free article] [PubMed] [Google Scholar]
- 22.Dumortier O, Blondeau B, Duvillie B, Reusens B, Breant B, Remacle C. Different mechanisms operating during different critical time-windows reduce rat fetal beta cell mass due to a maternal low-protein or low-energy diet. Diabetologia 2007; 50: 2495–503. [DOI] [PubMed] [Google Scholar]
- 23.Arends N, Boonstra V, Hokken-Koelega A. Head circumference and body proportions before and during growth hormone treatment in short children who were born small for gestational age. Pediatrics 2004; 114: 683–90. [DOI] [PubMed] [Google Scholar]
- 24.Fernandez-Twinn D, Ozanne S. Mechanisms by which poor early growth programs type-2 diabetes, obesity and the metabolic syndrome. Physiol Behav 2006; 88: 234–43. [DOI] [PubMed] [Google Scholar]
- 25.Gluckman P, Hanson M. The consequences of being born small—an adaptive perspective. Horm Res 2006; 65: 5–14. [DOI] [PubMed] [Google Scholar]
- 26.Eberle C. [Fetal programming of type 2 diabetes–intrauterine growth retardation (IUGR) as risk factor?]. MMW Fortschr Med 2010; 152: 76–82. [PubMed] [Google Scholar]
- 27.Stoffers DA, Zinkin NT, Stanojevic V, Clarke WL, Habener JF. Pancreatic agenesis attributable to a single nucleotide deletion in the human IPF1 gene coding sequence. Nat Genet 1997; 15: 106–10. [DOI] [PubMed] [Google Scholar]
- 28.Ashizawa S, Brunicardi FC, Wang XP. PDX-1 and the pancreas. Pancreas 2004; 28: 109–20. [DOI] [PubMed] [Google Scholar]
- 29.Kloosterman WP, Lagendijk AK, Ketting RF, Moulton JD, Plasterk RH. Targeted inhibition of miRNA maturation with morpholinos reveals a role for miR-375 in pancreatic islet development. PloS Biol 2007; 5: e203–e203. [DOI] [PMC free article] [PubMed] [Google Scholar]
- 30.Baroukh N, Ravier MA, Loder MK, Hill EV, Bounacer A, Scharfmann R, Scharfmann R, Rutter GA, Van Obberghen E. MicroRNA-124a regulates Foxa2 expression and intracellular signaling in pancreatic beta-cell lines. J Biol Chem 2007; 282: 19575–88. [DOI] [PubMed] [Google Scholar]
- 31.Yoon S, Choi YC, Lee S, Jeong Y, Yoon J, Baek K. Induction of growth arrest by miR-542-3p that targets survivin. FEBS Lett 2010; 584: 4048–52. [DOI] [PubMed] [Google Scholar]
- 32.Wang W, Zhao LJ, Tan YX, Ren H, Qi ZT. MiR-138 induces cell cycle arrest by targeting cyclin D3 in hepatocellular carcinoma. Carcinogenesis 2012; 33: 1113–20. [DOI] [PMC free article] [PubMed] [Google Scholar]
- 33.Vuguin P, Raab E, Liu B, Barzilai N, Simmons R. Hepatic insulin resistance precedes the development of diabetes in a model of intrauterine growth retardation. Diabetes 2004; 53: 2617–22. [DOI] [PubMed] [Google Scholar]


