Abstract.
A microfluidic chip with microchannels ranging from 8 to was used to mimic blood vessels down to the capillary level. Blood flow within the microfluidic channels was analyzed with split-spectrum amplitude-decorrelation angiography (SSADA)-based optical coherence tomography (OCT) angiography. It was found that the SSADA decorrelation value was related to both blood flow speed and channel width. SSADA could differentiate nonflowing blood inside the microfluidic channels from static paper. The SSADA decorrelation value was approximately linear with blood flow velocity up to a threshold of ( over the range of channel widths). Beyond this threshold, it approached a saturation value . was higher for wider channels, and approached a maximum value as the channel width became much larger than the beam focal spot diameter. These results indicate that decorrelation values (flow signal) in capillary networks would be proportional to both flow velocity and vessel caliber but would be capped at a saturation value in larger blood vessels. These findings are useful for interpretation and quantification of clinical OCT angiography results.
Keywords: optical coherence tomography, microfluidic device, ophthalmic optics and devices, medical and biological imaging
1. Introduction
Angiography techniques provide information on blood flow, vessel diameter, and vessel density, which assist with the diagnosis of vascular diseases.1,2 Conventional angiography techniques, such as fluorescence angiography, require the injection of exogenous dye contrast agents. However, the injection of exogenous agents can introduce side effects, such as vomiting, general discomfort, and, in rare occurrences, anaphylaxis.3 There is a need to develop label-free technology for angiography.
Optical coherence tomography (OCT) is capable of noninvasive three-dimensional (3-D) structural imaging with micrometer resolution and has proven vital in clinical ophthalmology.4 Advances in research have led to OCT angiography techniques capable of mapping retinal vasculature with the intrinsic contrast of moving blood cells.5–9 This is of particular interest for clinical use because it only requires a software modification of existing OCT systems, and the 3-D nature of OCT angiography allows the segmentation of clinically relevant tissue slabs.10
Several OCT angiography methods have been reported previously, including amplitude based, phased based, and complex value based.5–7,10,11–13 One such method, called split-spectrum amplitude-decorrelation angiography (SSADA), detects blood flow by measuring change in amplitude as the decorrelation between consecutive B-scans taken at the same location.6,14 Decorrelation is a function of the displacement of scatters (red blood cells) overtime, representing blood flow signals for OCT angiography. Multiple studies have used SSADA to quantify blood flow reduction in neurological disorders15–17 and abnormal circulation in retinal diseases.10,18 In addition, changes in blood flow due to external stimuli in terms of vessel density and flow index have been reported.19,20
Previously, SSADA was used to quantitatively measure the blood flow speed in a phantom study.14 However, this was based on a large size tube and therefore may not be suitable for describing capillary flow. It would be useful to understand how SSADA decorrelation values are associated with capillary flow. In this study, SSADA-based OCT angiography was performed on a microfluidic chip with channels ranging in width from 8 to , to approximate the size of capillary vessels in the retina. The relationship between SSADA decorrelation values and blood flow speed for channels of different widths was investigated.
2. Materials and Methods
2.1. Design and Fabrication of Microfluidic Chip
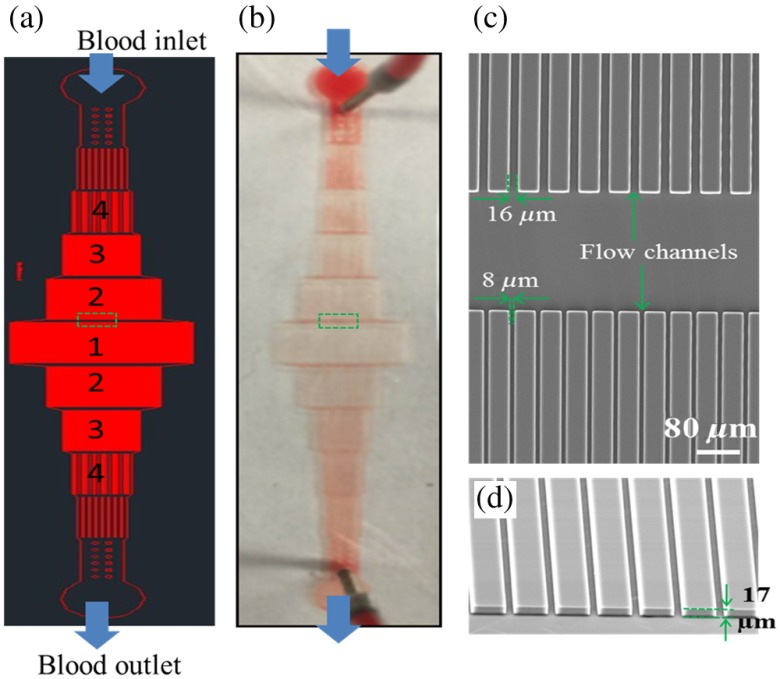
The pattern of microfluidic chip channels was designed using AutoCAD and laid out on glass photomasks [Fig. 1(a)]. The chips were then created according to standard photolithography and soft lithography techniques.21 Briefly, the photoresist (SU-8 3025, MicroChem Corp, Newton, Massachusetts) was used to generate microstructures on a silicon wafer. Polydimethylsiloxane (PDMS) prepolymer (10A:1B, Sylgard 184 silicone elastomer kit; Dow corning, Midland, Michigan) was poured onto the photoresist mold and heated at 80°C for 45 min. After curing, PDMS was peeled from the photoresist mold. Inlet and outlet holes were then punched. The PDMS layer (0.4-mm thickness) was oxygen plasma bonded onto the glass slide (Corning, Sigma-Aldrich CLS294775X25).
Fig. 1.
Schematic and photographs of the microfluidic chip. (a) Photomask for the fabrication of the microfluidic chip. The widths of the channels in the regions 1, 2, 3, and 4 are 8, 16, 32, and , respectively. (b) Photography of an actual microfluidic chip. (c) Scanning electron microscope (SEM) image of the chip corresponding to the region in the green dash box in a. (d) The tilted SEM image of the flow channels. The height of the channels is .
Microchannels with different widths were distributed on the chip in a serial fashion [Figs. 1(a) and 1(b)]. To maintain a consistent blood flow speed throughout the microchannel, the total cross-sectional area of the flow region was fixed. The multiplication of channel number and width was set as a constant value. Two different types of chips were used in this study. In both types of chips, the height of all microchannels was . The channel layout and dimensions were verified by scanning electron microscopy [Figs. 1(c) and 1(d)].
2.2. Blood Sample Preparation
Packed human red blood cells (PRBC) with sodium heparin anticoagulant (SER-PRBC, Zen-Bio, Inc) were diluted 1:1 with phosphate-buffered saline (PBS) to obtained 40% hematocrit. This was used in the microfluidic channels to simulate blood flow in vessels.
2.3. Experimental Setup
A commercial 70-kHz OCT system (Avanti RTVue XR, Optovue Inc., Fremont, California) was used in this study. A 60-diopter (D) lens was used to focus the beam from the OCT system on to the microfluidic chip. The axial resolution was calculated as in tissue. The lateral resolution was measured to be (see Appendix). A mechanical syringe pump (Harvard Apparatus, 70-2208) was used to pump blood through the chip. To condition (hydrate) the microfluidic chip, deionized water and then PBS were separately pumped at a high flow rate of for 5 min each. Blood samples of 40% hematocrit were pumped at rates of 50, 40, 20, 10, 8, 6, 4, 2, 1, and . The volume capacity of the syringe was 1 mL. OCT scans were taken 5 min after each change in pump rate to ensure that blood flow was at a steady state. The whole experiment was completed within 60 min to prevent coagulation of the blood and subsequent blocking of the channels.
2.4. Scan Protocol and Analysis Method
The SSADA algorithm was used for the processing of an OCT angiogram.6 Briefly, two sequential B-scans, consisting of 304 A-scans each, were taken at the same location to calculate the decorrelation value. The separation time between B-scans was about 5 milliseconds (ms). There were 304 B-scan locations in one 3-D volume. Raster scan sizes of , , and were used. Actual scan areas were measured to be , , and according to the known size of microfluidic chip features in the OCT images. The scan density, step size () between axial scans, was 11.51, 17.43, and 23.03 for these three scans. The small discrepancy could be due to the 60-D lens being slightly lower powered than the average eye and possible fan distortion of the scan field. “En-face” maximum decorrelation projection was obtained for the channels by a semiautomated segmentation program and was used for the later analysis in this study.
For a quantitative analysis of the SSADA decorrelation value, the center location for each channel was chosen. The half maximum of the decorrelation value was set as the threshold. The decorrelation values above the threshold were averaged and used for the analysis.
2.5. Characterization of Blood Flow Speeds in Microfluidic Chips
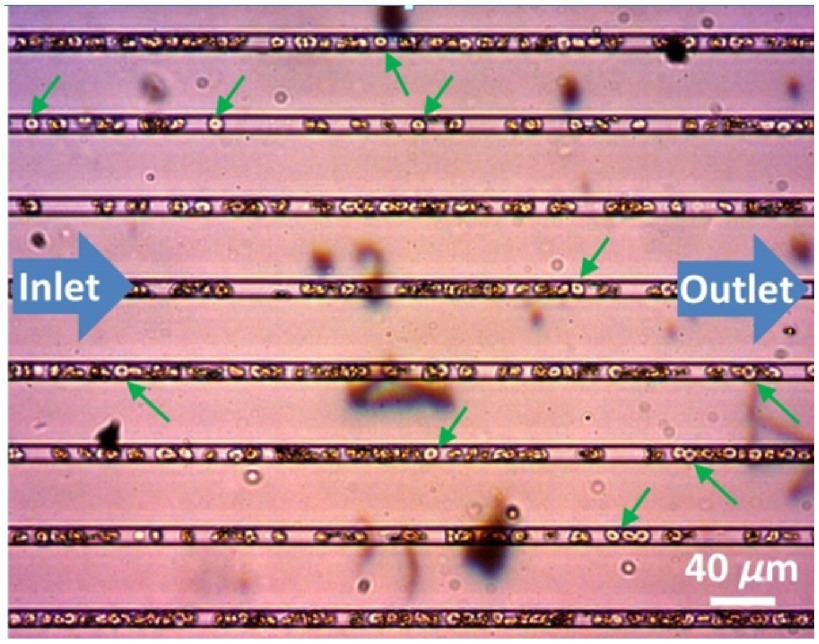
To verify the blood flow speed inside the channels, time lapse videos of red blood cells flowing in the microchannel were recorded by a charge-coupled device camera (DCC1645c-HQ, Thorlabs Inc., Newton, New Jersey) attached to an upright optical microscope (Nikon, Eclipse, E400). The red blood cells in the microchannels were manually tracked in the recorded videos processed by ImageJ software.22 The speed of the red blood cells in the microchannel was calculated by dividing the distance traveled by the time lapsed. Red blood cells flowed in a single file in the wide microchannel (Fig. 2) (Video 1).
Fig. 2.
Microfluidic capillaries with a width of forced red blood cells (green arrows) to flow in single files. (see Video 1, mp4, 778 KB) [URL: http://dx.doi.org/10.1117/1.JBO.21.8.086015.1].
Once videos were recorded, OCT angiography scans of the microfluidic chips were performed in the same experimental session (Fig. 3). Figures 3(a) and 3(b) show the cross-sectional reflectance and angiogram images of the microfluidic channels. The SSADA decorrelation values in the microchannels were measured from OCT angiograms [Fig. 3(c)]. The blood flow speed at the same location was then measured again using time lapse video acquired with the upright microscope [Fig. 3(d), Video 2]. The OCT angiograms matched well with the results from recorded video [Fig. 3(d)]. For example, in the region shown in Fig. 3(c), flow was detected in channels 1 to 3 and no flow was detected in channel 4 of both images. A linear relationship between the blood flow speed inside the channels and the syringe pump rate was found [Fig. 3(e)]. The flow speeds in the following experiments are obtained with this method.
Fig. 3.
Correlation of the OCT angiogram with white-light video images. (a) and (b) are the cross-sectional reflectance and angiogram images of microfluidic channels. White arrows indicate the locations of the microchannels. (c) En-face OCT angiogram of the microfluidic channels. (d) Blood flow speed was measured from video camera frames for correlation with OCT angiograms. The photograph of microfluidic channels from the upright microscope was colocalized with the en-face angiogram: the enlarged part of the angiogram at the top right corner (green square). The photo shown here was one image from a series of time-lapse images (see Video 2, mp4, 1,948 KB) [URL: http://dx.doi.org/10.1117/1.JBO.21.8.086015.2].The en-face angiogram was consistent with video images. Both results showed flow in channels 1 to 3 and no flow was detected in channel 4. (e) Relationship between syringe pump rate and blood flow speed inside the channels. Scale bars in (a and b): (vertical) and (horizontal). Time lapse video of microfluidic channels acquired with the upright microscope.
3. Results
3.1. Relationship Between the Split-Spectrum Amplitude-Decorrelation Angiography Decorrelation Value and the Blood Flow Speed in Channels of Different Size
It has been reported that SSADA decorrelation values are related to the blood flow speed, and the sensitivity of SSADA is related to the time interval between the repeated B-scans.9 The current time interval between adjacent B-scans is around 5 ms. By increasing the pump rates, decorrelation values become higher on SSADA OCT angiograms (Fig. 4). The relationship between centerline decorrelation values and the speeds of blood flow was investigated for five different channels with widths ranging from 8 to (Fig. 5). In the Brownian motion situation, where the syringe pump was turned off, the SSADA decorrelation values of all the channels used were measured in a range of 0.0332 to 0.0435 with values of . The decorrelation value of static blood was higher than the value of static paper () on the same static phantom, suggesting SSADA acquired by the current setup is sensitive enough to differentiate static flow phantom from static paper. With the increase of blood flow speed, the decorrelation values increase when the flow speeds were relatively low and finally approached a saturation value in each channel. These trends are consistent with the findings from previous studies.5,14 However, the results here further show that the decorrelation values are also dependent on channel width. A smaller channel shows lower decorrelation values. The data sets were fitted with an exponential recovery model as described below:
| (1) |
where is the SSADA decorrelation value measured at the centerline of microfluidic channels, is the saturated decorrelation value, and is defined as the saturation velocity, where reaches 95% of . is the background decorrelation value caused by the Brownian motion. was set as a constant value based on the measurement and the values for and were found by the fitting.
Fig. 4.
En-face SSADA angiograms at various pump rates for the microfluidic channels. The pump rates ranged from 1 to . The decorrelation values of the blood flow inside the channels were higher when the pump rate increased. The scale bars are .
Fig. 5.
Relationship between decorrelation value and the blood flow speed at various channel widths. (a) The relationship across all blood flow speed and (b) is at the low blood flow speed.
The results of fitted parameter and are listed in Table 1. A linear relationship between decorrelation values and the speeds of blood flow was found when the speeds were less than . The decorrelation values approached the saturation values when the speeds were larger than (Fig. 5). for five different channel widths was measured to be with no apparent correlation with channel width (Table 1). In contrast, values were higher for wider channels (Table 1).
Table 1.
Parameters of an exponential model for OCT angiography decorrelation values.
| Channel width () | () | |
|---|---|---|
| 8 | 0.278 | 7.92 |
| 12 | 0.303 | 5.85 |
| 24 | 0.338 | 4.23 |
| 32 | 0.342 | 5.46 |
| 64 | 0.362 | 5.67 |
3.2. Relationship Between Saturated Decorrelation Values and Channel Sizes Relative to Beam Sizes
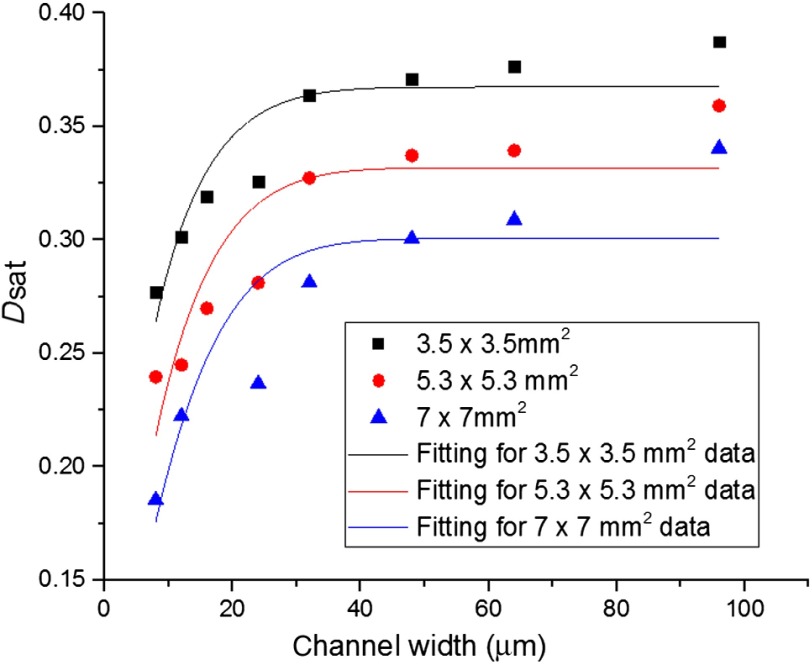
In Sec. 3.1, SSADA decorrelation values were found to be dependent on both the blood flow speed and channel width. We further studied the relationship between saturated decorrelation and the channel size relative to beam size. These experiments were performed at a blood flow speed of , which is higher than the saturation velocity for all channels.
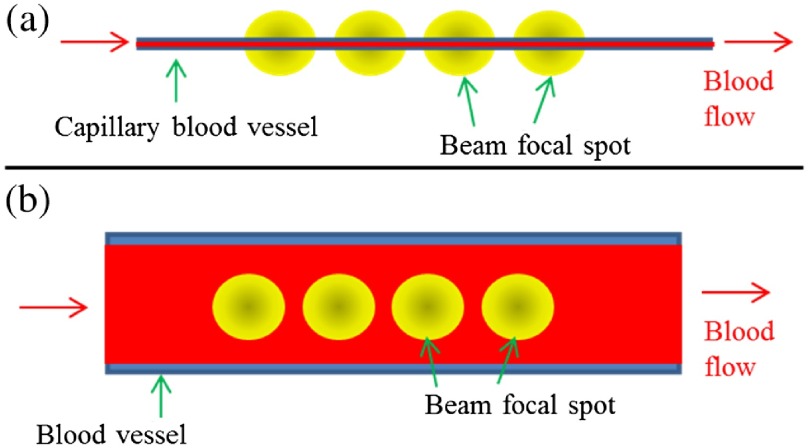
SSADA OCT angiography contrast originates from the interaction between the focused laser beam and blood flow. The SSADA signal (decorrelation value) is affected by the area where the laser beam and the vessel interact. Here, we developed a simple theoretical model that relates the SSADA signal and the overlapped area between the laser beam and blood vessel. Figure 6 shows the two situations where the focused laser beam shines on a small vessel and large vessel. Here, the one-dimensional Gaussian function was used to describe the beam profile and the step function was used to describe the flow channel
| (2) |
| (3) |
where is a constant related to beam size and is the channel width. The overlapped area between the laser beam and flow channel can be obtained by the flowing integration:
| (4) |
where erf represents the error function. Since, we are considering the situation where the blood flow speed is fast enough so that the decorrelation value is saturated, the decorrelation will be proportional to . Because the background reflectance for blood and tissue is different, the relationship between and channel width can be described as
| (5) |
where is a constant related to background reflection and is the maximum saturated decorrelation value. is the saturated decorrelation value when the beam spot size is much less than the channel size. This model predicts that the saturation decorrelation value should be approximately linear with the channel width when the channel width is smaller than the OCT beam spot diameter, and approaches a maximum value when the channel width becomes much larger than the beam spot. In this case, where tissue and blood have the same static background reflection, the parameter will be 1 and Eq. (5) will be simplified as an error function. However, in practice, the static background reflection in tissue and blood will be different and the value of will be less than 1.
Fig. 6.
Overlap fraction between the OCT beam and blood flow within the channel. (a) Illustration of the situation where the beam focal spot is larger than the channel width. (b) Illustration of the situation where beam focal spot is smaller than the channel width.
The model was used to fit the experimental results for all three scan sizes (Fig. 7). The model fit well for most of the smaller channels. However, there is a small deviation of above the fit for large channel widths (64 and ) for all three scan sizes. This deviation may be attributed to the fact that in larger vessels, the centerline red blood cell concentration is higher than the average hematocrit.23 For the data for the channel, the fitting also deviated from the actual value. This may be due to unknown deviation in the experimental condition. It was found that values decreased with the increase of OCT angiography scan size and that values increased with the increase of OCT angiography scan size (Table 2). This may be due to the effect of sparse sampling for the larger scan sizes, where the centerline of the flow channels cannot be accurately located. This result also shows that for OCT angiography, a smaller scan step size is always preferred to increase the sensitivity and contrast of the image.
Fig. 7.
Relationship between the saturated decorrelation value and channel width at a blood flow speed of . Black squares, red circles, and blue triangles are data points of three different scan sizes, , , and , respectively. Black, red, and blue lines show the results of fitting with Eq. (5) for the three different scan size. is a model parameter that describes the maximum value of .
Table 2.
Maximum saturation decorrelation value and background reflection related constant for three different OCT angiography scan sizes.
| Scan size | |||
|---|---|---|---|
| 0.37 | 0.33 | 0.31 | |
| 0.32 | 0.47 | 0.63 |
4. Discussion
The SSADA decorrelation value is dependent on both blood flow speed and channel (vessel) size. This has made the quantitative analysis of SSADA angiography more complex and challenging for clinical situations, where vessels of different size exist. However, quantitative analysis of SSADA angiograms is still possible under certain situations, and our results here provide useful information or guidance for quantitative analysis of SSADA angiograms. For example, for retinal vasculature, noncapillary larger vessels usually have higher blood flow speed, and the blood flow in these vessels will show saturated SSADA values. The different SSADA values shown in these large vessels are mainly due to the vessel size difference instead of flow speed difference. When comparing SSADA angiograms obtained from the same area at different time periods, the difference in the angiograms may not be due to the blood flow speed change but also due to vessel diameter change.
The lateral resolution of the OCT system plays an important role for the quantitative analysis of the SSADA angiogram. The high sensitivity SSADA can detect capillaries, which are smaller than the lateral resolution of the system. However, these capillaries will show up larger in the angiograms, and this may lead to a higher value when using a metric such as vessel density, the percentage area occupied by flow pixels on the OCT angiogram.15
It was found that the SSADA decorrelation values for a flow channel will be affected by system sampling density (scan step size). Because of the speed limitation of the OCT system, the same number of A-scans in the whole 3-D scan area was used for different scan sizes. This would result in different sampling density for different scan sizes. The setup has a lateral resolution of (see Appendix), the ideal sampling step size will be around 7 to according to Shannon sampling theorem.24 The current scan patterns will have an undersampling issue, especially for the scanning size of and . For the analysis of decorrelation value, we use the maximum decorrelation value in a channel. The maximum decorrelation value is at the center of the channel. For an undersampling situation, the center of the channel may not be sampled and the decorrelation value detected will be smaller. These results will show a trend of smaller decorrelation values for larger scan size as shown in Fig. 7. Because of this, the values for (also B) are different for different scan sizes in Table 2. Thus, comparison of SSADA values should only be done for the angiograms obtained with the same scan size. As shown in Fig. 6 and Eq. (5), the value of is related to the ratio between channel width () and the beam sized related constant (). If other parameters are the same, will not change as long as the ratio between and is not changed. So, changing beam spot will give the similar results as changing channel size.
5. Conclusion
Microfluidic chips with channel sizes ranging from 8 to were used to quantitatively investigate the SSADA decorrelation. It was found that the flow signal (decorrelation values) measured with SSADA OCT angiography was related to both blood flow velocity and channel width. An exponential decay function was used to describe the relationship between the SSADA decorrelation value and blood flow speed when the channel width was fixed. When the blood flow speed was fixed at a high value above the saturation speed, the SSADA decorrelation value was dependent on channel width. An error function was used to describe the relationship between saturated SSADA decorrelation value and channel width. Our findings are useful for the interpretation of clinical OCT angiography.
Supplementary Material
Acknowledgments
This research was funded by the Oregon Health and Science Foundation (OHSU), National Institutes of Health under Grants Nos. DP3 DK104397, R01 EY024544, R01 EY023285, R01 EY018184, and P30 EY010572 and by unrestricted departmental funding from Research to Prevent Blindness (New York). Dr. Yali Jia and Dr. David Huang have a significant financial interest in Optovue, Inc., a company that may have a commercial interest in the results of this research and technology. David Huang also has a financial interest in Carl Zeiss Meditec, Inc. These potential conflicts of interest have been reviewed and managed by OHSU. Other authors do not have financial interest in the subject of this article.
Biography
Biographies for the authors are not available.
Appendix: Determination of the Beam Focal Spot Diameter
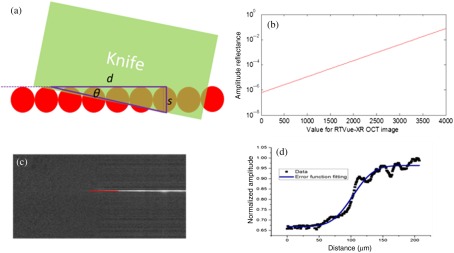
The lateral resolution of the OCT system is related to the focal spot size of the laser beam. To determine the beam focal spot diameter (lateral resolution) of our system, a knife edge method was used.25 Different from previous knife edge methods, where the knife edge was moved across the beam, the focused OCT beam was scanned across the knife edge in the current setup [Fig. 8(a)]. The OCT beam scanning direction and knife edge have a small angle such that the reflectance signal transition region is [Fig. 8(a)]. A smaller angle will allow a longer reflectance signal transition region and provide a more accurate measurement. The OCT signal amplitude profile along the scanning direction can be modeled by an error function. By fitting the measured reflectance signal profile with the error function, the beam size can be calculated. Here, the data were obtained from the image file saved by the commercial OCT system, where a rescaled logarithmic amplitude was used. Therefore, calibration was performed to find the relationship between the values from the OCT image and the true amplitude reflectance. The raw spectrum exported from the system was processed in MATLAB™ with custom software. The processing steps include conversion from linear wavelength to linear wavenumber, numerical dispersion, and fast Fourier transform (FFT). The amplitudes of the FFT results were then converted to a logarithmic scale. The relationship between the OCT log amplitude and the readings from OCT images was fitted with a linear function. The fit parameters were used later on to determine the true amplitude reflectance. In the calibration experiment, a similar setup as in Fig. 1(d) was used. The OCT light beam was focused on to a mirror with a 60-D lens after passing through a neutral density filter with optical density (OD) of 3. The mirror was mounted on a 5-D stage and the signal reflected from the mirror was maximized by tuning the 5-D stage. The reading from the OCT image was 2530 and the amplitude reflectance was (in this case, the total OD is 6, corresponding to an amplitude attenuation of 1000 times). Based on the obtained relationship between the OCT logarithm amplitude and the readings from OCT images, the relationship between the amplitude reflectance and the OCT image reading was calculated by
| (6) |
where is the amplitude reflectance. Figure 2(b) shows the relationship between real amplitude reflectance and the readings from the OCT image.
Fig. 8.
Determination of beam focal spot diameter by the measurement of OCT amplitude from a knife edge. (a) Schematic of the setup for the measurement of the focal spot size. (b) The relationship between real amplitude reflectance and the readings from OCT image. (c) The B-scan OCT image from the knife edge measurement. The red lines indicate the location to draw the profile for (d). (d) The normalized amplitude profile of OCT amplitude signal (black dots) along with the curve fitting results (blue line). The fitting function is an error function: , where err represent the error function, is the OCT amplitude, is the position of beam focal spot, and to are the fitting parameters. Based on the fitting results, the focal beam diameter () was found to be and the corresponding FWHM beam diameter was .
In this current setup, a B-scan image with 1020 A-lines covering a region of 2 mm was performed on a knife edge and the angle was set at 8 deg [Fig. 8(c)]. The OCT amplitude profile along the red line in Fig. 8(c) is shown as black dots in Fig. 8(d) and the error function fit is shown in blue [Fig. 8(d)]. The focal beam diameter () was found to be and the corresponding full-width at half-maximum (FWHM) beam diameter was .
References
- 1.Spaide R. F., et al. , “Retinal vascular layers imaged by fluorescein angiography and optical coherence tomography angiography,” JAMA Ophthalmol. 133, 45–50 (2015). 10.1001/jamaophthalmol.2014.3616 [DOI] [PubMed] [Google Scholar]
- 2.Stanga P. E., Lim J. I., Hamilton P., “Indocyanine green angiography in chorioretinal diseases: indications and interpretation: an evidence-based update,” Ophthalmology 110, 15–21 (2003). 10.1016/S0161-6420(02)01563-4 [DOI] [PubMed] [Google Scholar]
- 3.Stein M. R., Parker C. W., “Reactions following intravenous fluorescein,” Am. J. Ophthalmol. 72, 861–868 (1971). 10.1016/0002-9394(71)91681-3 [DOI] [PubMed] [Google Scholar]
- 4.Huang D., et al. , “Optical coherence tomography,” Science 254, 1178–1181 (1991). 10.1126/science.1957169 [DOI] [PMC free article] [PubMed] [Google Scholar]
- 5.Liu G., et al. , “A comparison of Doppler optical coherence tomography methods,” Biomed. Opt. Express 3, 2670–2680 (2012). 10.1364/BOE.3.002669 [DOI] [PMC free article] [PubMed] [Google Scholar]
- 6.Jia Y., et al. , “Split-spectrum amplitude-decorrelation angiography with optical coherence tomography,” Opt. Express 20, 4710–4725 (2012). 10.1364/OE.20.004710 [DOI] [PMC free article] [PubMed] [Google Scholar]
- 7.Yasuno Y., et al. , “In vivo high-contrast imaging of deep posterior eye by 1-μm swept source optical coherence tomography and scattering optical coherence angiography,” Opt. Express 15, 6121 (2007). 10.1364/OE.15.006121 [DOI] [PubMed] [Google Scholar]
- 8.Makita S., Fabritius T., Yasuno Y., “Quantitative retinal-blood flow measurement with three-dimensional vessel geometry determination using ultrahigh-resolution Doppler optical coherence angiography,” Opt. Lett. 33, 836–838 (2008). 10.1364/OL.33.000836 [DOI] [PubMed] [Google Scholar]
- 9.Wang R. K., et al. , “Depth-resolved imaging of capillary networks in retina and choroid using ultrahigh sensitive optical microangiography,” Opt. Lett. 35, 1467–1469 (2010). 10.1364/OL.35.001467 [DOI] [PMC free article] [PubMed] [Google Scholar]
- 10.Jia Y., et al. , “Quantitative optical coherence tomography angiography of vascular abnormalities in the living human eye,” Proc. Natl. Acad. Sci. U.S.A. 112, E2395–E2402 (2015). 10.1073/pnas.1500185112 [DOI] [PMC free article] [PubMed] [Google Scholar]
- 11.Wang R. K., et al. , “Three dimensional optical angiography,” Opt. Express 15, 4083 (2007). 10.1364/OE.15.004083 [DOI] [PubMed] [Google Scholar]
- 12.Zhang A., et al. , “Methods and algorithms for optical coherence tomography-based angiography: a review and comparison,” J. Biomed. Opt. 20, 100901 (2015). 10.1117/1.JBO.20.10.100901 [DOI] [PMC free article] [PubMed] [Google Scholar]
- 13.Zhang A., Wang R. K., “Feature space optical coherence tomography based micro-angiography,” Biomed. Opt. Express 6, 1919–1928 (2015). 10.1364/BOE.6.001919 [DOI] [PMC free article] [PubMed] [Google Scholar]
- 14.Tokayer J., et al. , “Blood flow velocity quantification using split-spectrum amplitude-decorrelation angiography with optical coherence tomography,” Biomed. Opt. Express 4, 1909–1924 (2013). 10.1364/BOE.4.001909 [DOI] [PMC free article] [PubMed] [Google Scholar]
- 15.Jia Y., et al. , “Quantitative OCT angiography of optic nerve head blood flow,” Biomed. Opt. Express 3, 3127 (2012). 10.1364/BOE.3.003127 [DOI] [PMC free article] [PubMed] [Google Scholar]
- 16.Jia Y., et al. , “Optical coherence tomography angiography of optic disc perfusion in glaucoma,” Ophthalmology 121, 1322–1332 (2014). 10.1016/j.ophtha.2014.01.021 [DOI] [PMC free article] [PubMed] [Google Scholar]
- 17.Wang X., et al. , “Optical coherence tomography angiography of optic nerve head and parafovea in multiple sclerosis,” Br. J. Ophthalmol. 98, 1368–1373 (2014). 10.1136/bjophthalmol-2013-304547 [DOI] [PMC free article] [PubMed] [Google Scholar]
- 18.Jia Y., et al. , “Quantitative optical coherence tomography angiography of choroidal neovascularization in age-related macular degeneration,” Ophthalmology 121, 1435–1444 (2014). 10.1016/j.ophtha.2014.01.034 [DOI] [PMC free article] [PubMed] [Google Scholar]
- 19.Pechauer A. D., et al. , “Optical coherence tomography angiography of peripapillary retinal blood flow response to hyperoxia,” Invest. Ophthalmol. Visual Sci. 56, 3287–3291 (2015). 10.1167/iovs.15-16655 [DOI] [PMC free article] [PubMed] [Google Scholar]
- 20.Wei E., et al. , “Parafoveal retinal vascular response to pattern visual stimulation assessed with OCT angiography,” PLoS One 8, e81343 (2013). 10.1371/journal.pone.0081343 [DOI] [PMC free article] [PubMed] [Google Scholar]
- 21.Qin D., Xia Y., Whiteside G. M., “Soft lithography for micro- and nanoscale patterning,” Nat. Protoc. 5, 491–502 (2010). 10.1038/nprot.2009.234 [DOI] [PubMed] [Google Scholar]
- 22.Rasband W., “ImageJ 1.50e,” http://imagej.nih.gov/ij/ (20 April 2016).
- 23.Suzaki Y., Tachibana A., “Measurement of the μm sized radius of Gaussian laser beam using the scanning knife-edge,” Appl. Opt. 14, 2809–2810 (1975). 10.1364/AO.14.002809 [DOI] [PubMed] [Google Scholar]
- 24.Heintzmann R., “Band-limit and appropriate sampling in microscopy,” in Cell Biology: A Laboratory Handbook, Celis J. E., Ed., Elsevier Academic Press, Burlington, Massachusetts: (2006). [Google Scholar]
- 25.Aarts P. A., et al. , “Blood platelets are concentrated near the wall and red blood cells, in the center in flowing blood,” Arterioscler. Thromb. Vasc. Biol. 8, 819–824 (1988). 10.1161/01.ATV.8.6.819 [DOI] [PubMed] [Google Scholar]
Associated Data
This section collects any data citations, data availability statements, or supplementary materials included in this article.


