

Abstract
Small nucleolar RNAs (snoRNAs) have been used for normalization in glomerular microRNA (miRNA) quantification without confirmation of validity. Our aim was to identify glomerular reference miRNAs in IgA nephropathy. We compared miRNAs in human paraffin-embedded renal biopsies from patients with cellular-crescentic IgA-GN (n = 5; crescentic IgA-GN) and non-crescentic IgA-GN (n = 5; IgA-GN) to mild interstitial nephritis without glomerular abnormalities (controls, n = 5). Laser-microdissected glomeruli were used for expression profiling of 762 miRNAs by low-density TaqMan arrays (cards A and B). The comparison of different normalization methods (GeNormPlus, NormFinder, global mean and snoRNAs) in crescentic IgA-GN, IgA-GN and controls yielded similar results. However, levels of significance and the range of relative expression differed. In median, two normalization methods demonstrated similar results. GeNormPlus and NormFinder gave different top ranked reference miRNAs. Stability ranking for snoRNAs varied between cards A and B. In conclusion, we suggest the geometric mean of the most stable reference miRNAs found in GeNormPlus (miR-26b-5p), NormFinder (miR-28-5p) and snoRNAs (RNU44) as reference. It should be considered that significant differences could be missed using one particular normalization method. As a starting point for glomerular miRNA studies in IgA nephropathy we provide a library of miRNAs.
IgA nephropathy is the most common glomerulonephritis worldwide1. Currently histopathological analysis of renal biopsies is considered the gold standard for diagnosis and contributes to prognostication and therapeutic decision making2. miRNAs have been suggested as new biomarkers for renal disease activity to improve tissue diagnostics3. miRNAs act as post-transcriptional regulators of gene expression and recent studies have shown that it is feasible to measure gene expression of miRNAs in FFPE tissue4,5. They have been investigated extensively in renal diseases in general (reviewed in ref. 6) and in IgA nephropathy (reviewed in ref. 7) in particular. Whole tissue gene expression analysis demonstrated a higher intrarenal expression of miR-146a and miR-155-5p in patients with IgA nephropathy compared to healthy controls8,9. miR-21-5p was found to be up-regulated in laser-microdissected glomeruli of patients with IgA nephropathy and its inhibition prevented fibrogenic activation in podocytes10. The same group demonstrated a down-regulation of miR-223 in glomeruli with endocapillary proliferation11, however endocapillary proliferation was not clearly defined in this study.
Despite the recent surge of studies on miRNAs in kidney diseases, a profound assessment of reference miRNAs for proper quantification of miRNA expression by RT-qPCR has not been provided yet. To the best of our knowledge, no comprehensive study has identified suitable miRNA reference genes in whole tissue or in laser-microdissected glomeruli from paraffin tissue. It has even been shown that expression levels of small-nucleolar RNAs (snoRNAs) such as RNU48 and RNU44, which are suggested as references by manufacturers, are regulated in neoplastic diseases like breast cancer and head and neck squamous cell carcinoma12 making their use as reference miRNAs highly questionable. We are not aware of any studies about the stability of snoRNAs in non-neoplastic renal diseases.
The aim of the study was (i) to provide a comprehensive data set of glomerular miRNAs expression in native renal biopsies of IgA-GN on a cohort reflecting the full spectrum of glomerular tuft pathology (ii) to identify the most stably expressed miRNAs as a reference by proper normalization strategies (iii) to compare different normalization strategies for the identification of differentially expressed miRNAs in “active, cellular” crescentic IgA-GN vs. IgA-GN vs. controls. This provides basic information for further studies about the pathogenesis of IgA nephropathy especially to identify novel molecular markers for disease activity in urinary, serum and tissue diagnostics.
Materials and Methods
Patients and biopsies
Biopsies from 15 different patients were selected from the archive of the Institute of Pathology, Hannover Medical School: Five with IgA-GN without crescents, five with crescentic IgA-GN (only with active, cellular crescents, >20% of glomeruli involved) and five mild intersititial nephritis without glomerular abnormalities as controls. The former two cohorts reflected the full spectrum of glomerular tuft findings in IgA-GN not only according to the Oxford classification but also including crescentic forms and regarding IgG and IgM deposits (see Table 1). Importantly, none of the patients received any medication at the time of biopsy. All biopsies were examined with our standard diagnostic protocol and scored according to the MEST criteria of the Oxford classification2. Detailed information for every biopsy is given in Table 1. Other forms of renal and systemic diseases were excluded.
Table 1. All biopsies were examined with our standard diagnostic protocol for Immunohistological features and scored according to the MEST criteria of the Oxford classification.
| Group | IgA-staining | IgG-staining | IgM-staining | M | E | S | T | C |
|---|---|---|---|---|---|---|---|---|
| IgA | +++ | negative | + | 1 | 0 | 0 | 0 | 0 |
| IgA | ++ | negative | ++ | 1 | 0 | 0 | 0 | 0 |
| IgA | +++ | + | negative | 1 | 0 | 0 | 0 | 0 |
| IgA | ++ | ++ | + | 1 | 1 | 0 | 0 | 0 |
| IgA | +++ | + | trace | 1 | 0 | 0 | 0 | 0 |
| Crescentic IgA | ++ | + | + | 1 | 1 | 1 | 0 | 1 |
| Crescentic IgA | +++ | trace | trace | 1 | 1 | 1 | 0 | 1 |
| Crescentic IgA | +++ | trace | trace | 1 | 1 | 1 | 0 | 1 |
| Crescentic IgA | ++ | trace | trace | 1 | 1 | 1 | 0 | 1 |
| Crescentic IgA | ++ | ++ | ++ | 1 | 1 | 1 | 0 | 1 |
| Control | negative | negative | trace | 0 | 0 | 0 | 0 | 0 |
| Control | negative | negative | trace | 0 | 0 | 0 | 0 | 0 |
| Control | negative | negative | trace | 1 | 0 | 0 | 0 | 0 |
| Control | negative | negative | negative | 0 | 0 | 0 | 0 | 0 |
| Control | negative | negative | negative | 0 | 0 | 0 | 0 | 0 |
The entire spectrum of IgA-GN regarding concurrent IgM and IgG deposits with the IgA codominance defining IgA-GN was covered. Furthermore, the full spectrums of glomerular tuft findings according to the criteria of the Oxford classification are presented in our cohort. M mesangial hypercellularity, E endocapillary hypercellularity, S segmental glomerulosclerosis, T tubular atrophy/interstitial fibrosis, C only active, cellular crescent.
Clinical data and serology
Clinical data included blood pressure, proteinuria (none, non-nephrotic, nephrotic), hematuria, hemoglobin, leukocyte count, thrombocyte count, serum-creatinine and eGFR (MDRD formula; Schwartz formula, if age <18 years; see Table 2). We could not find any significant differences in serum creatinine and eGFR between the cohorts in pairwise comparisons using Steel-Dwass tests. Thus, we should have reasonably controlled any secondary effects of uremia on glomerular tuft miRNA expression.
Table 2. Clinical data of patients with IgA nephropathy (non-crescentic IgA-GN (IgA-GN) and cellular-crescentic IgA-GN (crescentic IgA-GN)) and controls. If no unit is given data are presented as total count, otherwise as median (25th/75th percentile).
| IgA-GN; n = 5 | Crescentic-IgA-GN; n = 5 | Controls; n = 5 | |
|---|---|---|---|
| Female | 2 | 3 | 4 |
| Age at biopsy | 47.0 (37.0/51.0) | 46.0 (17.0/65.0) | 37.0 (24.0/55.0) |
| Crescents per total glomeruli count (%) | 0 (0/0) | 44.4 (36.6/46.2) | 0 (0/0) |
| Global glomerulosclerosis per total glomeruli count (%) | 5.9 (5.9/6.3) | 9.8 (0/10) | 0 (0/0) |
| Arterial hypertension WHO-Grade | |||
| 0 | 3 | 2 | 3 |
| 1 | 1 | 2 | 1 |
| 2 | 1 | 0 | 0 |
| 3 | 0 | 1 | 0 |
| n.d. | 0 | 0 | 1 |
| Proteinuria | |||
| normal | 0 | 0 | 2 |
| <3.5 g/day | 5 | 3 | 3 |
| >3.5 g/day | 0 | 2 | 0 |
| n.d. | 0 | 0 | 0 |
| Microhematuria | 5 | 4 | 2 |
| Macrohematuria | 1 | 1 | 0 |
| Haemoglobin (g/dl) | 13.1 (11.1/15.4) | 10.9 (10.8/12.7) | 12.5 (9.1/14.1) |
| Leukocytes (103/μl) | 6.8 (5.6/7.4) | 8.1 (7.7/8.8) | 8.8 (5.7/11.3) |
| Thrombocytes (103/μl) | 237 (192/257) | 360 (292/401) | 245 (166/484) |
| Serum-Creatinine (μmol/l) | 84 (68/232) | 107 (79/450) | 273 (129/465) |
| eGFR MDRD (ml/min) (Schwartz if age <18 years) | 88.8 (42.2/96.0) | 54.7 (22.1/95.5) | 18.0 (15.8/40.8) |
Although serum creatinine of controls was higher than those in patients with IgA nephropathy, there were no significant differences. Furthermore, there were no significant differences for eGFR (Steel-Dwass test).
Glomerular microdissection and miRNA high throughput analysis
Between 150 to 500 glomerular cross sections from paraffin-embedded biopsies (cut at a thickness of 3 μm) were deparaffinized for 30 sec. in xylole, stained for 2 sec. in haemalaun (Mayers Haemalaun, Merck, Germany) and washed in sterile aqua ad injectabilia (Ampuwa, Plastipur, Fresenius, Germany). From dried sections only open capillary loops were microdissected, carefully excluding the crescents, global and segmental sclerosed glomeruli (mmi® CellCut Plus® Laser Microdissection System, Eching, Germany).
RNA was quantified as described previously13,14. Briefly, isolated RNA was dissolved in 10 μl DEPC water. Thereof 3.0 μl were reverse transcribed using the Multi-Scribe-based High Capacity Kit and Megaplex RT stem-loop primer pool A and B, Version 2.0 (Applied Biosystems, Foster City, CA, USA), enabling RNA-specific cDNA synthesis for 762 different small RNA species including snoRNAs (snRNU6 (U6, RNU6A), RNU48 and RNU44) and several tRNA derived fragments15. For the sake of convenience all measured tRNA species are termed as miRNAs according to the old nomenclature. Preamplification and quantification by TaqMan low density arrays (TLDA) were performed as described16. Sequences and accession numbers of defined endogenous reference genes as well as miRNAs with significantly different expression are given in Supplementary Table 1.
Evaluation of miRNA expression data
Amplification curves and Cq values (quantitation cycle) were generated with the software RQ manager 1.2 (Applied Biosystems). Threshold values for all TLDA cards were set at 0.25. Amplification curves for every reaction were inspected visually and underwent a stringent quality control. Cq values of amplification curves that could not be trusted were set as Cq = 45. Baseline values were adjusted if necessary17. Based on a preamplification procedure following megaplex reverse transcription and TLDA we defined Cq values of >32.0 as off-scale Cq values (reactions that are too high to be trusted)18. Out of 381 we excluded 201/321 miRNAs in Pool A/B for further analysis, when a Cq value of >32.0 in more than 5 out of 15 examined samples was obtained. For the remaining 240 miRNAs we used the recommended pragmatic approach to replace all missing Cq values (reactions that did not yield any Cq-value) and off-scale Cq values by Cq = 3317.
Defining candidate reference genes
A typical normalization study using geNormPlus or NormFinder uses only data for highly expressed candidate reference genes. Therefore we only used those miRNAs with not more than one off-scale Cq-value or missing Cq-value. Furthermore, following the algorithm of Wotschofsky et al.19 we included only miRNAs that met the criteria of non-regulated miRNAs. First all Cq values had to be converted into relative quantities (RQ). We used the highest Cq value as calibrator (highest Cq value in one patient sample – each Cq value of a specific miRNA in this patient sample). Then all values had to be standardised by calculating the ratio of RQ divided by the arithmetic mean of RQ from all miRNAs in the same patient sample. In a second step these transformed RQ values were used for another global normalization by calculating the ratio of transformed RQ divided by the arithmetic mean of RQ from all patient samples of one miRNA. Next, we analyzed the standard deviation of RQ for each miRNA in all patient samples, the expression differences as well as the mean fold change differences between subgroups. Finally, those nonregulated miRNAs were selected as candidate reference genes for geNormPlus/NormFinder, which passed 2 out of the following 3 criteria: (i) standard deviation <0.0003 (Pool A) as well as <0.00003 (Pool B), (ii) p-value for expression differences >0,7 in non-parametric Steel-Dwass tests and (iii) mean fold change between −0.00003 and 0.00003 (Pool A) as well as between −0.000015 and 0.000015 (Pool B). Standard deviation and mean fold changes were calculated with Microsoft Excel (Version 12.2.8).
Defining normalization factors
Four different normalization factors were defined by calculating the geometric mean of Cq values20 from each of the recommended reference miRNAs: Recommendation of (i) geNormPlus, (ii) NormFinder, (iii) global mean normalization method, (iv) two most stable snoRNAs or (v) all three snoRNAs provided by the manufacturer.
The commercially available geNormPlus algorithm in qBaseplus, version 3.0 (http://www.biogazelle.com/qbaseplus Biogazelle, Zwijnaarde, Belgium) is based on calculating the average pairwise variations of each candidate reference genes compared to all candidate reference genes21. Step by step the gene with the highest variation (highest M-Value) was excluded from the list of candidate genes and the variation analysis is repeated with the remaining candidates. In the end, the remaining candidate gene with the lowest M-value is identified as the best reference gene20. For the identification of the optimal number of reference genes geNormPlus provides the following algorithm: Differences in the ratio of the average pairwise variation of normalization factors (geometric mean Cq value)20 of consecutive candidate reference genes starting with the two most stable genes (n) and the addition of the next most stable gene (n + 1) until all genes have been added suggest the number of optimal reference genes. As a general guideline, the benefit of using an extra reference gene is limited as soon as the difference in the ratio (Vn/n + 1) drops below the 0.15 threshold22.
The second normalization method we used was the NormFinder algorithm, which identifies reference genes via a simple interface (an Excel add-in available as a free download under http://moma.dk/normfinder-software)23,24, which analyses different subgroups (IgA-GN, crescentic IgA-GN and controls) independently. Hereby intragroup and intergroup variations are considered independently. The stability value for each gene is a measurement of the estimated systematic error when using this gene for normalization. The best 3 reference genes were chosen for calculating the normalization factor. For both algorithms the amplification efficiency was assumed as 100%. Imported Cq values were automatically transformed into relative expression data by the software25. Furthermore, we skipped those miRNAs belonging to the same miRNA-family (see miRNAVISA web interface26) and used only the best miRNA per family.
We also used the global mean normalization method. It calculates normalization factors based on the geometric mean of Cq values of all analyzed genes of one patient sample18,27. This method is recommended for experiments with more than 50 randomly distributed genes over all biological pathways.
Moreover, snoRNAs (RNU44, RNU48 and U6 snRNA) were used as a reference as recommended by the manufacturer. Relative expression was determined using the 2−ΔCq method. ΔCq was calculated as Cq(target) – normalization factor.
Statistical Analysis
For pairwise comparisons of continuous parameters between the cohorts we used the Steel-Dwass on JMP 9.0.2 (SAS Institute, Cary, NC, USA). Nonparametric tests are recommended in case of replaced missing or off-scale Cq values. P-values <0.05 were considered statistically significant in two-tailed tests. Median values, 25/75 percentiles (boxes) as well as 10/90 percentiles (whiskers) are shown in Figures with box plots. Median values as well as the quartiles are shown in Table 2. GraphPad Prism Version 5.0 (GraphPad Software Inc., La Jolla, CA, USA) was used for plotting of values.
The Spearman’s rank correlation coefficients were applied to calculate the association of values yielded from geNormPlus and NormFinder.
Ethical Approval
All studies were carried out according to the latest revision of the Declaration of Helsinki (http://www.wma.net/en/30publications/10policies/b3/index.html) and were approved by the Ethics Committee of Hannover Medical School (number 2241-2014), hereby it is documented that informed consent was obtained prospectively from all subjects.
Results
Reference miRNAs in studies related to non-neoplastic kidney diseases
First we performed a literature search in PubMed for articles published between January 2008 and December 2014, with the search terms “microRNA(s), micro-RNA(s) or miRNA(s)” and “kidney, renal, (IgA-) glomerulonephritis or (IgA-)nephropathy”. We focused on manuscripts about human, rat or mouse non-neoplastic renal tissues. Papers about urinary and serum analysis using spiked references as well as in vitro studies were excluded.
70 publications reported miRNA expression by RT-qPCR in renal tissue (18 times human, 39 times mouse, 13 times rat) and used small nuclear, nucleolar or ribosomal RNAs as well as mRNAs for normalization, namely snRNU6 (32 times), RNU48 (6 times), RNU87 (5 times), snoRNA202 (5 times), 5srRNA (5 times), 18srRNA (4 time), RNU6B (3 times) as well as others (GAPDH, RNU19, RNU44, RNU19, snoRNA 135, snoRNA 234) without confirming their validity for normalization (see Supplementary Table 2, including literature). miR-193a and miR-16 were the only two reference miRNAs, which were properly identified as stably expressed in polycystic kidney disease and diabetic nephropathy, respectively28,29. Five publications used laser-microdissection for glomerulus-specific analysis10,11,30,31,32.
Inclusion of 240 microRNAs for further analysis
Two-hundred and fourty (180 from Pool A and 60 from Pool B) out of 762 measured miRNAs (32%) were included for further analysis according to our algorithm described in the methods section. Cq values of these 240 miRNAs are provided in a supplementary excel file (Supplementary Table 3). According to Stahlberg et al. a defined amount of off-scale Cq or missing Cq values within these 240 miRNAs was accepted17. We decided to use this threshold for exclusion of miRNAs in order not to miss any relevant data. As shown in Fig. 1 we found 53 (Pool A)/35 (Pool B) miRNAs with off-scale Cq or missing Cq values in our final analysis. Among the 2685/900 further analyzed Cq values there were 39 (1.5%)/17 (1.9%) missing Cq values and 112 (4.2%)/78 (8.7%) off-scale Cq values in Pool A/B. miR-708-5p demonstrated two off-scale Cq values in controls, consistent with a significantly lower glomerular expression of this miRNA in controls. Beside this miRNA neither other significantly expressed target genes nor snoRNAs had any off-scale or missing Cq value.
Figure 1. miRNAs with off-scale (grey) and missing (dark grey) Cq values are shown for quality control.

Percentages for 15 patient samples are shown for each miRNA. Grey boxes are for off-scale and dark grey boxes for missing Cq values. Out of these miRNAs seven were also defined as candidate reference miRNAs (miR-20b, miR-342-3p, miR-1275, miR-145-3p, miR-151-5P, miR-27b-5p, miR-601). However, none of these were ranked within the top 15 reference genes by geNormPlus or NormFinder.
Stability analysis of candidate reference genes
For the computational approach of geNormPlus and NormFinder we used 35 miRNAs (Pool A) and 26 miRNAs (Pool B) as candidate reference genes (Fig. 2) defined by the algorithm described in the method section. Out of these, miR-20b, miR-342-3p (Pool A) and miR-1275, miR-145-3p, miR-151-5p, miR-27b-5p, miR-601 (Pool B) had a maximum of one off-scale/missing Cq value (Fig. 1). GeNormPlus and NormFinder analysis recommended different reference genes. GeNormPlus recommended miR-26b-5p and miR-195-5p (Pool A) as well as miR-720, miR-1274a, miR-1260a and miR-30a-5p (Pool B) as the best combinations (Fig. 2). miR-26a and miR-1274b were excluded, because they belong to the same miRNA-family/tRNA derived fragment and had a higher stability-value in the NormFinder analysis. The pairwise variation V2/3 calculated to indicate the optimal number of reference genes required for normalization yielded a value of 0.148 in Pool A, which was already below 0.15 (Fig. 3). Thus, based on geNormPlus, a combination of the best two reference genes is stable enough for Pool A and the addition of another miRNA would not improve normalization accuracy. In Pool B V4/5 yielded a value of 0.146 (Fig. 3). Therefore the best four reference genes are suggested as normalization factor.
Figure 2. Results of geNormPlus and NormFinder.
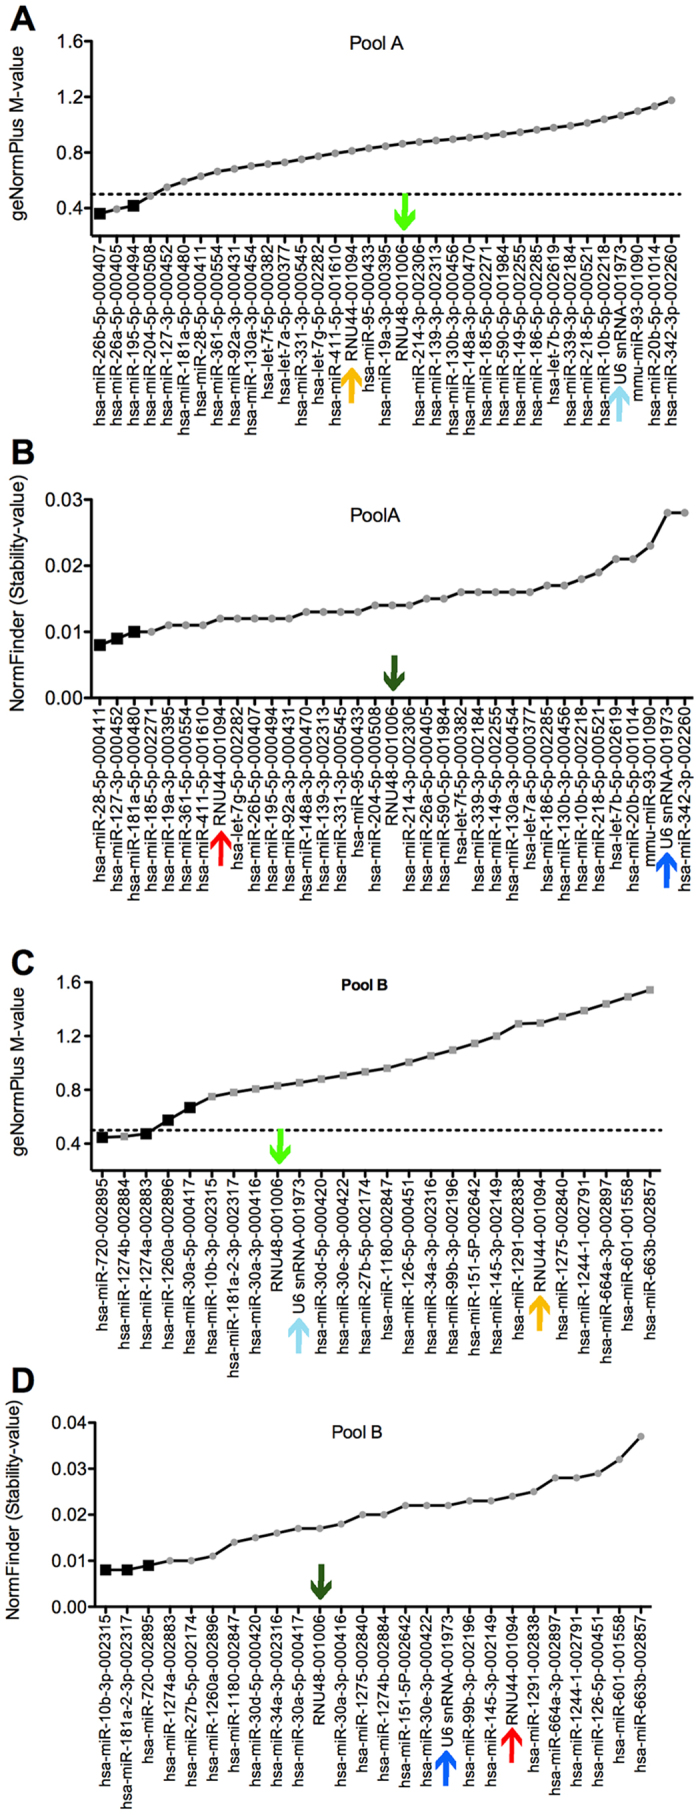
geNormPlus analysis shows the calculation of the average expression stability M-value of all candidate reference genes determined by RT-qPCR (A,C). Genes with the highest M-value have the least stable expression, while the genes with the lowest M-value have the most stable expression. The x-axis presents the ranking of reference genes in order of decreasing stability from left to the right. High stability is defined by an M-value of <0.5 as indicated by the dotted line. Chosen reference miRNAs are highlighted by black squares. By analogy NormFinder Stability-values are listed in an ascending order (B,D). Small-nucleolar RNAs (snoRNAs such as RNU48, RNU44 and U6snRNA) are indicated by coloured arrows. snoRNAs are indicated by coloured arrows.
Figure 3. Calculation of the optimal number of reference genes for normalization by geNormPlus.
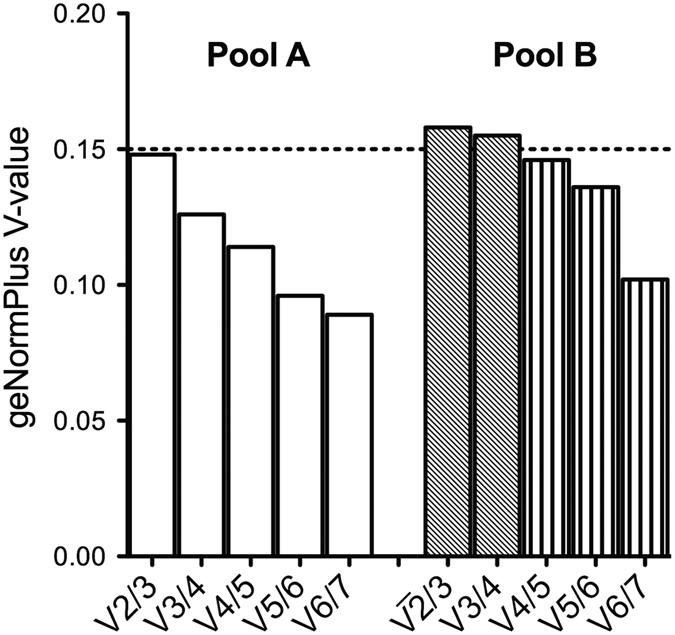
geNormPlus calculates the optimal number of reference genes taking into account the variable V as the average pairwise variation between two sequential candidate reference miRNAs. The dotted line illustrates the cut-off value 0.15. In our cohort the optimal number of reference genes was two (V2/3) for Pool A (white boxes) and four (V4/5) for Pool B (grey boxes indicate a V-value above the cut-off).
In contrast, NormFinder identified miR-28-5p, miR-127-3p and miR-181a-5p for Pool A as well as miR-10b-3p, miR-181a-2-3p and miR-720 for Pool B as the most stable miRNAs (Fig. 2). There was a significant correlation of stability-values comparing geNormPlus and NormFinder (Fig. 4).
Figure 4. Direct correlation of geNormPlus and NormFinder.
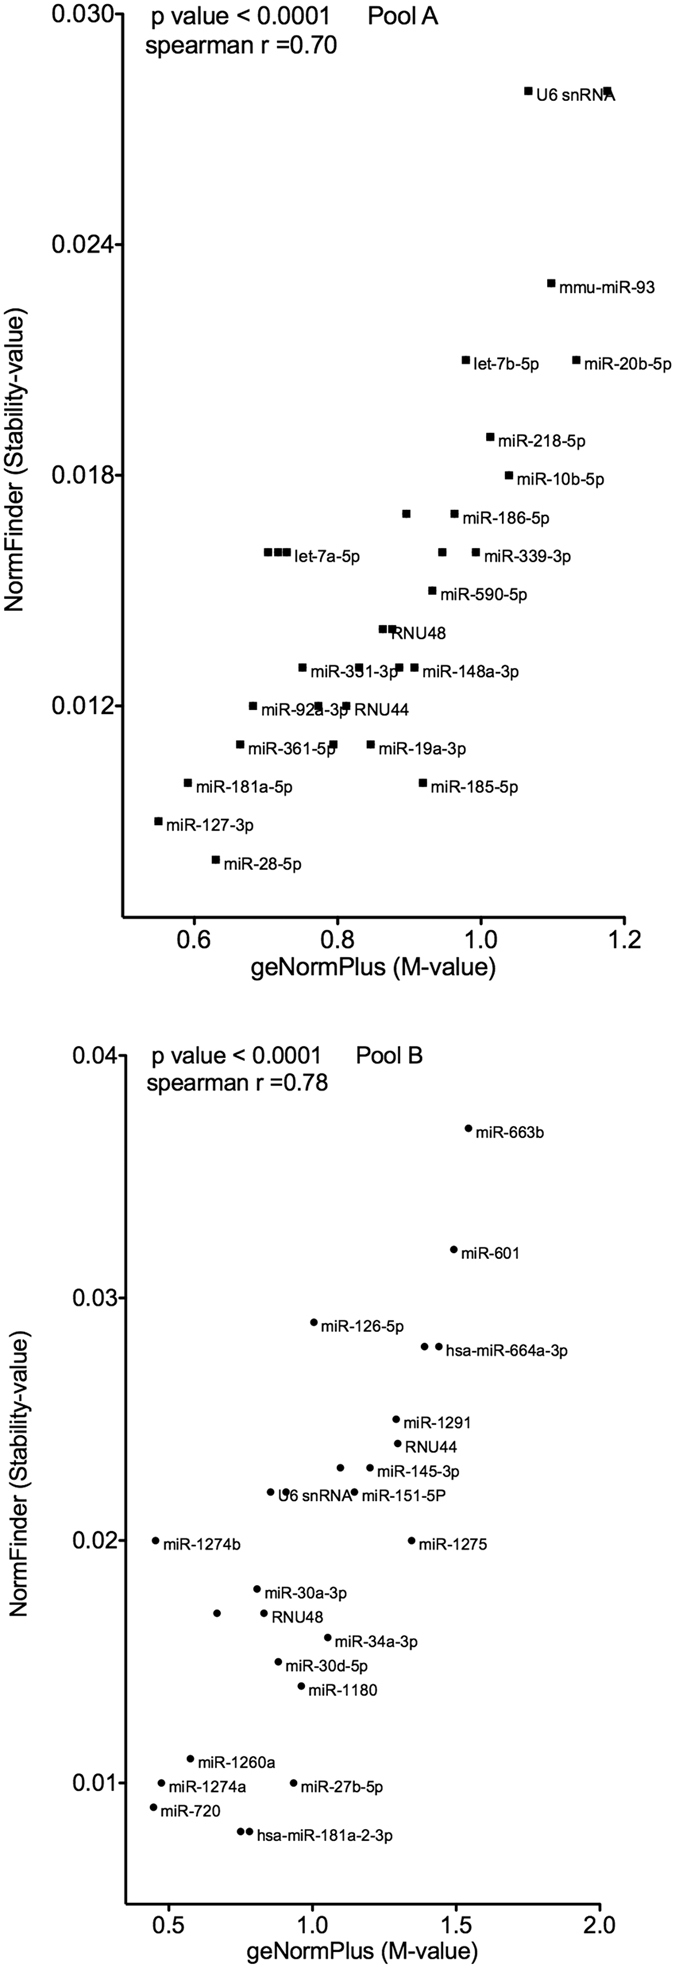
Spearman’s rank correlation coefficients indicate a high consistency between those two algorithms. For the sake of legibilty not all data points are labeled.
snoRNAs as endogenous reference transcripts
Interestingly the order of stability-values for snoRNAs differed between TLDA cards A and B (indicated by coloured arrows in Fig. 2). RNU44 was ranked 16th (Pool A)/21st (Pool B) by geNormPlus, 8th (Pool A)/20th (Pool B) by NormFinder. RNU48 was ranked 19th (Pool A)/9th (Pool B) by geNormPlus, 18th (Pool A)/11th (Pool B) by NormFinder. snRNU6 was ranked 32nd (Pool A)/10th (Pool B) by geNormPlus, 34th (Pool A)/17th (Pool B) by NormFinder. The comparison of Cq values for snoRNAs revealed a higher interquartile range of all analyzed snoRNAs on card B (Fig. 5). Due to this discrepancy we decided to analyze our data with the best two snoRNAs as well as by all three snoRNAs as references.
Figure 5. Variation in expression of snoRNAs on card A and B.
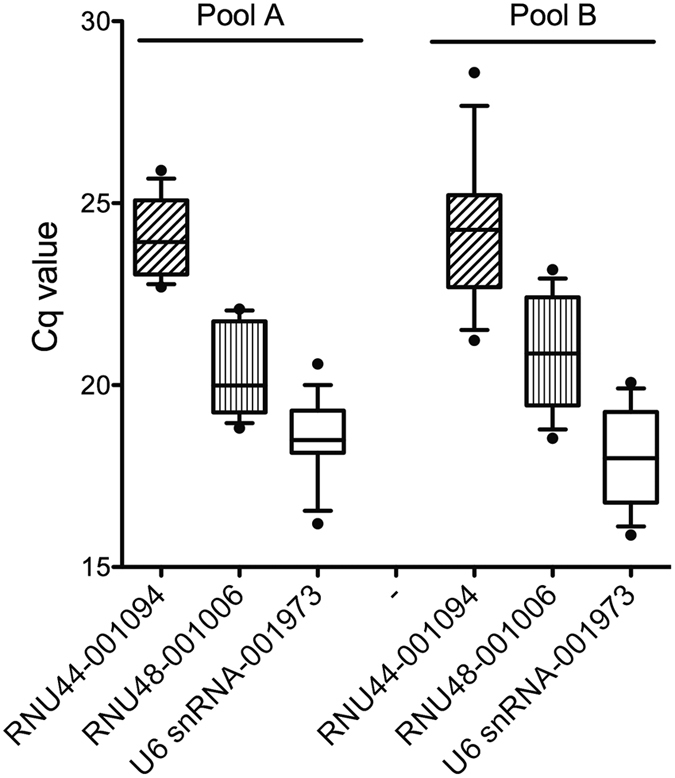
Quantification cycle (Cq) values were plotted for each sample. There was a higher variation for all snoRNAs on card B.
miRNAs with significantly different expression
In order to demonstrate the value of our reference miRNAs, we examined our small cohort for differences between tufts from crescentic and non-crescentic IgA-GN. Active crescents have long been considered an important indicator of inflammatory activity and have been suggested for inclusion in the Oxford classification33. For the detection of differentially expressed microRNAs we analyzed 240 target miRNAs with four different normalization methods: Recommendation of (i) geNormPlus (geometric mean of miR-26b-5p and miR-195-5p (Pool A) as well as of miR-720, miR-1274a, miR-1260a and miR-30a-5p (Pool B)), (ii) NormFinder (geometric mean of miR-28-5p, miR-127-3p and miR-181a-5p (Pool A) as well as miR-10b-3p, miR-181a-2-3p and miR-720 (Pool B)), (iii) global mean normalization method, (iv) two most stable snoRNAs (geometric mean of RNU44 and RNU48 (Pool A) as well as RNU48 and snRNU6 (Pool B)) or (v) geometric mean of all three snoRNAs provided by the manufacturer. We compared three subgroups: IgA-GN, crescentic IgA-GN and controls. A total of 12 miRNAs (Pool A 10 miRNAs, Pool B 2 miRNAs) showed differential expression. Of these miRNAs six are shown in Fig. 6 and another six in the Supplementary Fig. All normalization methods yielded similar results for these 12 miRNAs, however with different levels of significance. In particular miR-132-3p, miR-30b-5p and miR-30c-5p were strongly expressed compared to reference miRNAs. The global mean method and the NormFinder method demonstrated the highest rates of concordance. Four miRNAs (miR-132-3p, miR-146-5p, miR-184, miR-708-5p) demonstrated high persistence throughout different normalization methods (at least 3 out of 5 normalization methods with similar significant results). Comparing all 12 significantly expressed miRNAs in median two normalization methods demonstrated similar significant results. The global mean method demonstrated the highest number of significant results when comparing crescentic IgA-GN vs. IgA-GN. Specifically, miR-132-3p, miR-146-5p and miR-27a-5p were elevated in crescentic IgA-GN vs. controls as well as miR-155-5p, miR-184 and miR-708-5p in IgA-GN vs. controls. In addition, miR-132-3p, miR-125b-5p and miR-21-5p were significantly elevated in crescentic IgA-GN vs. IgA-GN, whereas miR-132-3p and miR-184 demonstrated highest persistency throughout different normalization methods. On the other hand, miR-708-5p and let7c were significantly elevated in IgA-GN vs. crescentic IgA-GN as well as miR-30c-5p, miR-30b-5p, hsa-miR-505-5p in controls vs. crescentic IgA-GN.
Figure 6. Effects of different normalization approaches on the expression of miRNAs in IgA-GN.

Quantitative differences of six significantly different expressed miRNAs are shown in dependence from different normalization factors. Relative expression levels were calculated using the following normalization methods: geNormPlus (miR-26b, miR-195-5p) NormFinder (miR-28-5p, miR-127-3p, miR-181a-5p), global Mean, best two snRNAs (RNU44, RNU48) and all 3 snRNAs (RNU44, RNU48, snRNU6). Four miRNAs (miR-132-3p, miR-146-5p, miR-184, miR-708-5p) demonstrated high consistency throughout different normalization methods. Significant differences are illustrated by horizontal lines as P values < 0.05 of the nonparametric pairwise ranking test (Steel-Dwass test for multiple comparison analysis). Median values, 25/75 percentiles (grey dotted boxes, IgA-GN; white, crescentic IgA-GN; striped, controls) as well as 10/90 percentiles (whiskers) are shown.
Discussion
In this study we provide the first RT-qPCR-array-based identification of appropriate reference genes for miRNA expression studies in laser-microdissected glomeruli of patients from a wide spectrum of IgA-GN. It is widely accepted that there is no “one fits all” reference gene. Instead one has to determine which genes exhibit the greatest stability for the experimental conditions under examination. Results from mRNA expression studies based on non-validated reference genes can be misleading34,35. As an overview on reference miRNAs used in non-neoplastic renal tissue expression studies we compiled data from different studies. This Pubmed search showed that snoRNAs such as snRNU6, RNU48, RNU87, snoRNA202 and ribosomal RNA such as 5srRNA and 18srRNA are most frequently used as reference transcripts, however without any validation. A similar overview for reference miRNAs in serum, plasma, blood monocytes and blood of cardiovascular, non-neoplastic hepatic or pulmonary diseases failed to show consensus reference snoRNAs36. Except for snRNU6 and RNU48, none of these snoRNAs are provided on the TLDA card we used. Most importantly in our study snRNU6 and RNU48 were not among the most stably expressed by geNormPlus and NormFinder algorithms. M-values were higher than expected (0.8–1.2) and they were even ranked differently on card A and card B. This might be due to intercard variability of snoRNAs as described by others37. In mRNA studies M-values should be less than 0.520. Thus, other transcripts than these snoRNAs seem to be better suited as references for glomerular miRNA studies in IgA nephropathy.
For identification of reference miRNAs in laser-microdissected glomeruli of patients with IgA nephropathy we measured 762 miRNAs, analyzed 240 miRNAs and included 61 miRNAs as candidate reference genes. Compared to all 2,500 (including all −5p and −3p sequences) human “high confidence” miRNAs reported in the miRBase release from June 2014 (release 21)38 these were 30%, 9.6% and 2.4%, respectively. We compared the stability of miRNAs between crescentic IgA-GN, IgA-GN in order to identify the best references for broad spectrum of IgA nephropathy.
In order to provide a set of reference miRNAs one could suggest the intersection of the best 15 reference genes from both algorithms geNormPlus and NormFinder (miR-10b-3p, miR-1260a, miR-127-3p, miR-1274a, miR-181a-5p, miR-181a-2-3p, miR-195-5p, miR-26b-5p, miR-28-5p, miR-30a-3p, miR-30a-5p, miR-30d-5p, miR-361-5p, miR-720, miR-92a-3p). The ranking of the M-value (geNormPlus) compared to the stability-value (NormFinder) of those 15 miRNAs was not identical. However, considering (i) the high correlation between both algorithms, (ii) that each algorithm employs a different mathematical approach and (iii) that the confidence of the respective results will vary depending on the innate variability of the dataset, we suggest a set of strong reference miRNAs. Furthermore, these 15 reference miRNAs are associated with independent cellular processes, increasing the confidence that any observed differences are accurate. Lastly, they were highly expressed and did not have any off-scale or missing Cq values.
Several miRNAs like miR-181a-5p, miRNA-195-5p, miR-720, and miR-26b-5p have been described in other studies. In situ hybridisation stained miR-181a-5p in tubular epithelial cells, especially close to the juxtaglomerular apparatus. Whole tissue analysis of human nephrectomy specimens has shown that the tubular expression of miR-181a-5p is associated with renin mRNA expression39,40. This is in accordance with the finding of an aberrant renal miR-181a-5p expression in mouse41 and human40 hypertensive kidneys. In our small cohort without any differences in arterial blood pressure miR-181a-5p was stably expressed in lasermicrodissected glomeruli with IgA nephropathy, indicating that miR-181a-5p is not primarily affected by IgA-GN or neighboring crescents. Due to its stable glomerular expression, differences in whole tissue analysis of miR-181a-5p seem to be due to an altererd tubulointerstitial or vascular expression.
miRNA-195-5p and miR-720 seem to be relevant in diabetic glomerulopathy. Under in vitro high-glucose conditions inhibition of miRNA-195-5p protected mesangial cells from apoptosis and induces mesangial cellular proliferation42, in contrast, miR-195-5p mediated podocyte apoptosis43. Furthermore, miR-195-5p was identified as an inhibitor of sirtuin 1 (Sirt1) in diabetic nephropathy44. Histone deacetylase Sirt1 ameliorated diabetic nephropathy via multiple mechanisms45,46,47,48. miR-720 was associated with microalbuminuria in human diabetic nephropathy49. Moreover, miR-720 was up-regulated and miR-26b-5p down-regulated in isolated glomeruli of murine diabetic nephropathy42. Therefore miRNA-195-5p, miR-26b-5p and miR-720 should be used with caution or completely avoided as reference transcripts in diabetic subjects. In our cohorts, diabetes was excluded on clinical and histological grounds.
Another two miRNAs were analyzed in whole tissue analysis. miR-30a-3p was decreased in acute cellular rejection50. miR-30d-5p was down-regulated in progressive kidney disease from diabetic and/or hypertensive nephropathy51. TGF-ß treatment of podocytes in vitro resulted in a diminished expression of all miR-30 family members52. Therefore one could speculate that miR-30 family members play a role in the complex network of podocytopathia-associated up-regulation of TGF-ß53. For the other stably expressed miRNAs no studies in non-neoplastic kidney tissue are available. In summary, we are not aware of any study arguing against the use of those 15 glomerular reference miRNAs in IgA nephropathy.
Using several different normalization strategies, we aimed to minimize the limitations of any specific method while capitalising on the unique strengths of each approach. As a key result from our study all methods provided similar results. On average about 2 out of 5 different normalization methods provided even similar levels of significance, despite the small cohort sizes. Compared to the global mean method, which is often referred to as the gold standard, the NormFinder method as well as the snoRNA method (two most stable snoRNAs) provided very similar results. However, there are still two questions remaining: How many differences between cohorts would remain undetected with an inappropriate normalization strategy? And how should we identify the most appropriate normalization strategy? In order to answer these questions, we compared our favorite normalization approaches: (A) best two of geNormPlus (miR-195-5p, miR-26b-5p) and NormFinder (miR-127-3p, miR-28-5p), (B) best one of geNormPlus (miR-26b-5p), NormFinder (miR-28-5p) and snoRNA (RNU44) and (C) best one of geNormPlus (miR-26b-5p), best two of NormFinder (miR-127-3p, miR-28-5p) and best one of snoRNA (RNU44). As shown in the Table 3 (A, B, C) there were minor differences between those three normalization approaches, however we suggest the normalization approach (B) due to persistent detection of significance levels for miRNAs, when compared to different normalization methods.
Table 3. Summary of different normalization methods (i–v) compared to three different suggested normalization approaches: (A) best two of geNormPlus (miR-195-5p, miR-26b-5p) and NormFinder (miR-127-3p, miR-28-5p), (B) best one of geNormPlus (miR-26b-5p), NormFinder (miR-28-5p) and snoRNA (RNU44) and (C) best one of geNormPlus (miR-26b-5p), best two of NormFinder (miR-127-3p, miR-28-5p) and best one of snoRNA (RNU44).
| miRNA | Suggested normalization approaches | Different normalization methods | ||||||
|---|---|---|---|---|---|---|---|---|
| (A) Best two of geNormPlus (miR-195-5p, miR-26b-5p) and NormFinder (miR-127-3p, miR-28-5p) | (B) Best one of geNormPlus (miR-26b-5p), NormFinder (miR-28-5p) and snoRNA (RNU44) | (C) Best one of geNormPlus (miR-26b-5p), best two of NormFinder (miR-127-3p, miR-28-5p) and best one of snoRNA (RNU44) | (i) geNorm Plus | (ii) Norm Finder | (iii) global mean | (iv) best 2 snoRNAs | (v) best 3 snoRNAs | |
| miR-132-3p | p < 0.05 | p < 0.05 | p < 0.05 | n.s. | p < 0.05 | p < 0.05 | p < 0.05 | n.s. |
| miR-146b-5p | n.s. | p < 0.05 | p < 0.05 | n.s. | p < 0.05 | p < 0.05 | p < 0.05 | p < 0.05 |
| miR-155-5p | n.s. | p < 0.05 | p < 0.05 | n.s. | n.s. | p < 0.05 | p < 0.05 | n.s. |
| miR-184 | p < 0.05 | p < 0.05 | p < 0.05 | p < 0.05 | p < 0.05 | p < 0.05 | p < 0.05 | p < 0.05 |
| miR-21 | p < 0.05 | n.s. | n.s. | p < 0.05 | p < 0.05 | n.s. | n.s. | n.s. |
| miR-708-5p | n.s. | p < 0.05 | p < 0.05 | n.s. | p < 0.05 | p < 0.05 | p < 0.05 | p < 0.05 |
| Let-7c | n.s. | n.s. | p < 0.05 | n.s. | p < 0.05 | p < 0.05 | n.s. | n.s. |
p values are given for each normalization strategy. miRNAs with persistent detection of significance levels throughout different normalization methods (recommendation of (i) geNormPlus, (ii) NormFinder, (iii) global mean normalization method, (iv) two most stable snoRNAs or (v) all three snoRNAs) are bolt printed. The suggested approach B (italic letters) provides the best compromise for detection and non detection of significant differences compared to the results of five different normalization methods. n.s. non significant.
Some differentially expressed miRNAs in histological variants of IgA nephropathy have been shown to regulate distinct pathways in renal diseases. miR-21-5p was up-regulated in crescentic IgA-GN using the normalization method of geNormPlus and NormFinder, however, in contrast to the study of Bao et al.10 we did not detect any difference in glomeruli of IgA-GN vs. controls. Unfortunately Bao et al. did not comment on the presence of crescents. They identified up-regulated glomerular miR-21-5p in 20 patients with IgA nephropathy using snRNU610. Based on our findings, it appears questionable to use only the non-validated snRNU6 as a reference. The differences between the study of Bao et al. and this study could be due to the different normalization strategies used, missing information about active crescents in their cohort and due to the small size of our cohort. Moreover, Bao et al. did not comment on segmental or global glomerulosclerosis in their study cohort. This would have been important, because in mice a loss of miR-21-5p is associated with accelerated glomerulosclerosis54. In our cohort of crescentic IgA-GN all cases demonstrated segmental glomerulosclerosis.
miR-132-3p was up-regulated 3-fold in crescentic IgA-GN compared to both controls and IgA-GN. This is in line with miR-132-3p upregulation during transition between acute and fibrotic injury in a mouse model of folic acid-induced kidney injury and fibrosis55. Furthermore, miR-132-3p was highly increased in rat kidneys with hypertension and cardiac hypertrophy and seems to play a role in the Renin-Angiotensin-II-system56. In our study cohort we excluded patients on any medication including angiotensin-receptor blockers. One interesting target of miR-132-3p is Sirt1, which protected endothelial cells and enhances mesangial cell survival57. Sirt1 also regulated PGC-1a activity, which plays an essential role for maintenance of podocyte mitochondrial function58. Counterregulatory efforts upon injury in IgA nephropathy of one or even all-glomerular cell types (endothelium, mesangial cells and podocytes) could explain the dramatic up-regulation of miR-132-3p.
Two miRNAs, miR-148b and let-7b, which seem to mediate the aberrant O-glycosylation process of IgA and that can differentiate IgA nephropathy patients in serum tests59,60, were not significantly expressed in our cohort. In other diseases like in acute leukemia or gastric cancer it has been shown that serum levels of miRNA expression were not the same as in tissue samples61,62. This underscores the need to show the presence of a miRNA in the affected tissue in order to establish this miRNA as a biomarker. To this end, our study provides broad spectrum of miRNAs expressed in glomeruli of IgA nephropathy and controls. For future cost- and time-efficient analyses, we suggest to focus on those 240 miRNAs with high glomerular expression given in Supplementary Table 3. They could facilitate future large-scale studies looking into ancillary miRNA biomarkers in IgA nephropathy. We are not aware of any biomarker studies combining glomerular, serum and urine miRNA quantification in correlation with clinical and histological parameters. With the small number of patients in our study, which was aimed at providing an indispensable methodological base for future studies, we cannot provide such details yet. Moreover, due to the exclusion of miRNAs with Cq values >32 in more than 5 out of 15 samples we might not have been able to detect significant neo-expression or loss of miRNA expression in individual cohorts. It was necessary to follow our stringent algorithm for excluding miRNAs with off-scale/missing Cq values in order to focus on highly expressed miRNAs. For further analysis of quite small, but perhaps biologically relevant differences of less expressed miRNAs and for the quality control of biomarker studies, we provide all Cq values from glomerular miRNAs in the Supplementary Table 3.
In summary we provide an in-depth ranking of reference miRNAs indispensable for accurate normalization and quantification of glomerular miRNA expression studies in IgA-GN. Based on our analysis we suggest miR-26b-5p (best according to geNormPlus) and miR-28-5p (best according to NormFinder) and one snoRNA (RNU44) as suitable reference genes choice for human glomerular miRNA quantification in IgA nephropathy. Nevertheless, individual experimental conditions, especially different species (mouse, rat etc.) have to be considered and similar studies to ours might have to be conducted to identify better-suited references.
Additional Information
How to cite this article: Bockmeyer, C. L. et al. Comparison of different normalization strategies for the analysis of glomerular microRNAs in IgA nephropathy. Sci. Rep. 6, 31992; doi: 10.1038/srep31992 (2016).
Supplementary Material
Acknowledgments
The authors acknowledge the support of the German Jackstädt Stiftung to CLB. Furthermore, support by Deutsche Forschungsgemeinschaft and Friedrich-Alexander-Universität Erlangen-Nürnberg (FAU) within the funding programme Open Access Publishing is acknowledged.
Footnotes
Author Contributions C.L.B.: Research design, laboratory work, data collection, data analysis, discussion of the results, writing of the manuscript, new reagents and analytic tools. K.S.: Laboratory work, data collection, data analysis. J.W.: Discussion of the results and laboratory work. M.E.: Discussion of the results. S.S.R.: Discussion of the results and writing of the manuscript. U.V. and P.F.H.: Data collection. P.A.A.: Data collection and laboratory work. P.Z.: Data analysis and discussion of the results. K.A.: Discussion of the results. C.D.: Discussion of the results. J.U.B.: Research design, data collection, data analysis, discussion of the results, writing of the manuscript, new reagents and analytic tools.
References
- D’Amico G. The commonest glomerulonephritis in the world: IgA nephropathy. Q J Med 64, 709–727 (1987). [PubMed] [Google Scholar]
- Barbour S. J. et al. The MEST score provides earlier risk prediction in lgA nephropathy. Kidney Int 89, 167–175, doi: 10.1038/ki.2015.322 (2016). [DOI] [PubMed] [Google Scholar]
- Nassirpour R., Raj D., Townsend R. & Argyropoulos C. MicroRNA biomarkers in clinical renal disease: from diabetic nephropathy renal transplantation and beyond. Food Chem Toxicol, doi: 10.1016/j.fct.2016.02.018 (2016). [DOI] [PubMed] [Google Scholar]
- Siebolts U. et al. Tissues from routine pathology archives are suitable for microRNA analyses by quantitative PCR. J Clin Pathol 62, 84–88, doi: 10.1136/jcp.2008.058339 (2009). [DOI] [PMC free article] [PubMed] [Google Scholar]
- Singh U. et al. General principles and methods for routine automated microRNA in situ hybridization and double labeling with immunohistochemistry. Biotech Histochem 89, 259–266, doi: 10.3109/10520295.2013.839825 (2014). [DOI] [PubMed] [Google Scholar]
- Trionfini P., Benigni A. & Remuzzi G. MicroRNAs in kidney physiology and disease. Nat Rev Nephrol 11, 23–33, doi: 10.1038/nrneph.2014.202 (2015). [DOI] [PubMed] [Google Scholar]
- Szeto C. C. & Li P. K. MicroRNAs in IgA nephropathy. Nat Rev Nephrol 10, 249–256, doi: 10.1038/nrneph.2014.50 (2014). [DOI] [PubMed] [Google Scholar]
- Wang G. et al. Intrarenal expression of microRNAs in patients with IgA nephropathy. Lab Invest 90, 98–103, doi: 10.1038/labinvest.2009.118 (2010). [DOI] [PubMed] [Google Scholar]
- Wang G. et al. Elevated levels of miR-146a and miR-155 in kidney biopsy and urine from patients with IgA nephropathy. Dis Markers 30, 171–179, doi: 10.3233/dma-2011-0766 (2011). [DOI] [PMC free article] [PubMed] [Google Scholar]
- Bao H. et al. Inhibition of miRNA-21 prevents fibrogenic activation in podocytes and tubular cells in IgA nephropathy. Biochem Biophys Res Commun 444, 455–460, doi: 10.1016/j.bbrc.2014.01.065 (2014). [DOI] [PubMed] [Google Scholar]
- Bao H. et al. MiR-223 downregulation promotes glomerular endothelial cell activation by upregulating importin alpha4 and alpha5 in IgA nephropathy. Kidney Int 85, 624–635, doi: 10.1038/ki.2013.469 (2014). [DOI] [PubMed] [Google Scholar]
- Gee H. E. et al. The small-nucleolar RNAs commonly used for microRNA normalisation correlate with tumour pathology and prognosis. Br J Cancer 104, 1168–1177, doi: 10.1038/sj.bjc.6606076 (2011). [DOI] [PMC free article] [PubMed] [Google Scholar]
- Agustian P. A. et al. Glomerular mRNA expression of prothrombotic and antithrombotic factors in renal transplants with thrombotic microangiopathy. Transplantation 95, 1242–1248, doi: 10.1097/TP.0b013e318291a298 (2013). [DOI] [PubMed] [Google Scholar]
- Theophile K., Jonigk D., Kreipe H. & Bock O. Amplification of mRNA from laser-microdissected single or clustered cells in formalin-fixed and paraffin-embedded tissues for application in quantitative real-time PCR. Diagn Mol Pathol 17, 101–106, doi: 10.1097/PDM.0b013e318163f26e (2008). [DOI] [PubMed] [Google Scholar]
- Schopman N. C., Heynen S., Haasnoot J. & Berkhout B. A miRNA-tRNA mix-up: tRNA origin of proposed miRNA. RNA Biol 7, 573–576, doi: 10.4161/rna.7.4.13141 (2010). [DOI] [PubMed] [Google Scholar]
- Bockmeyer C. L., Jonigk D., Kreipe H. & Lehmann U. MicroRNA profiling using RNA from microdissected immunostained tissue. Methods Mol Biol 755, 85–94, doi: 10.1007/978-1-61779-163-5_7 (2011). [DOI] [PubMed] [Google Scholar]
- Stahlberg A., Rusnakova V., Forootan A., Anderova M. & Kubista M. RT-qPCR work-flow for single-cell data analysis. Methods 59, 80–88, doi: 10.1016/j.ymeth.2012.09.007 (2013). [DOI] [PubMed] [Google Scholar]
- D’Haene B., Mestdagh P., Hellemans J. & Vandesompele J. miRNA expression profiling: from reference genes to global mean normalization. Methods Mol Biol 822, 261–272, doi: 10.1007/978-1-61779-427-8_18 (2012). [DOI] [PubMed] [Google Scholar]
- Wotschofsky Z. et al. Reference genes for the relative quantification of microRNAs in renal cell carcinomas and their metastases. Anal Biochem 417, 233–241, doi: 10.1016/j.ab.2011.06.009 (2011). [DOI] [PubMed] [Google Scholar]
- Vandesompele J. et al. Accurate normalization of real-time quantitative RT-PCR data by geometric averaging of multiple internal control genes. Genome Biol 3, RESEARCH0034 (2002). [DOI] [PMC free article] [PubMed] [Google Scholar]
- Hellemans J., Mortier G., De Paepe A., Speleman F. & Vandesompele J. qBase relative quantification framework and software for management and automated analysis of real-time quantitative PCR data. Genome Biol 8, R19, doi: 10.1186/gb-2007-8-2-r19 (2007). [DOI] [PMC free article] [PubMed] [Google Scholar]
- Ratert N. et al. miRNA profiling identifies candidate mirnas for bladder cancer diagnosis and clinical outcome. J Mol Diagn 15, 695–705, doi: 10.1016/j.jmoldx.2013.05.008 (2013). [DOI] [PubMed] [Google Scholar]
- Andersen C. L., Jensen J. L. & Orntoft T. F. Normalization of real-time quantitative reverse transcription-PCR data: a model-based variance estimation approach to identify genes suited for normalization, applied to bladder and colon cancer data sets. Cancer Res 64, 5245–5250, doi: 10.1158/0008-5472.can-04-0496 (2004). [DOI] [PubMed] [Google Scholar]
- Latham G. J. Normalization of microRNA quantitative RT-PCR data in reduced scale experimental designs. Methods Mol Biol 667, 19–31, doi: 10.1007/978-1-60761-811-9_2 (2010). [DOI] [PubMed] [Google Scholar]
- Cameron R. C., Duncan E. J. & Dearden P. K. Stable reference genes for the measurement of transcript abundance during larval caste development in the honeybee. Apidologie 44, 357–366 (2013). [Google Scholar]
- Kamanu T. K., Radovanovic A., Archer J. A. & Bajic V. B. Exploration of miRNA families for hypotheses generation. Sci Rep 3, 2940, doi: 10.1038/srep02940 (2013). [DOI] [PMC free article] [PubMed] [Google Scholar]
- Mestdagh P. et al. A novel and universal method for microRNA RT-qPCR data normalization. Genome Biol 10, R64, doi: 10.1186/gb-2009-10-6-r64 (2009). [DOI] [PMC free article] [PubMed] [Google Scholar]
- Dweep H., Sticht C., Kharkar A., Pandey P. & Gretz N. Parallel analysis of mRNA and microRNA microarray profiles to explore functional regulatory patterns in polycystic kidney disease: using PKD/Mhm rat model. Plos One 8, e53780, doi: 10.1371/journal.pone.0053780 (2013). [DOI] [PMC free article] [PubMed] [Google Scholar]
- Krupa A. et al. Loss of MicroRNA-192 promotes fibrogenesis in diabetic nephropathy. J Am Soc Nephrol 21, 438–447, doi: 10.1681/asn.2009050530 (2010). [DOI] [PMC free article] [PubMed] [Google Scholar]
- Lu J. et al. Glomerular and tubulointerstitial miR-638, miR-198 and miR-146a expression in lupus nephritis. Nephrology (Carlton) 17, 346–351, doi: 10.1111/j.1440-1797.2012.01573.x (2012). [DOI] [PubMed] [Google Scholar]
- Macconi D. et al. MicroRNA-324-3p promotes renal fibrosis and is a target of ACE inhibition. J Am Soc Nephrol 23, 1496–1505, doi: 10.1681/asn.2011121144 (2012). [DOI] [PMC free article] [PubMed] [Google Scholar]
- Deshpande S. D. et al. Transforming growth factor-beta-induced cross talk between p53 and a microRNA in the pathogenesis of diabetic nephropathy. Diabetes 62, 3151–3162, doi: 10.2337/db13-0305 (2013). [DOI] [PMC free article] [PubMed] [Google Scholar]
- Nasri H. & Mubarak M. Extracapillary proliferation in IgA nephropathy; recent findings and new ideas. J Nephropathol 4, 1–5, doi: 10.12860/jnp.2015.01 (2015). [DOI] [PMC free article] [PubMed] [Google Scholar]
- Haller F. et al. Equivalence test in quantitative reverse transcription polymerase chain reaction: confirmation of reference genes suitable for normalization. Anal Biochem 335, 1–9, doi: 10.1016/j.ab.2004.08.024 (2004). [DOI] [PubMed] [Google Scholar]
- Schmid H. et al. Validation of endogenous controls for gene expression analysis in microdissected human renal biopsies. Kidney Int 64, 356–360, doi: 10.1046/j.1523-1755.2003.00074.x (2003). [DOI] [PubMed] [Google Scholar]
- Haider B. A. et al. A critical evaluation of microRNA biomarkers in non-neoplastic disease. Plos One 9, e89565, doi: 10.1371/journal.pone.0089565 (2014). [DOI] [PMC free article] [PubMed] [Google Scholar]
- Genovesi L. A., Anderson D., Carter K. W., Giles K. M. & Dallas P. B. Identification of suitable endogenous control genes for microRNA expression profiling of childhood medulloblastoma and human neural stem cells. BMC Res Notes 5, 507, doi: 10.1186/1756-0500-5-507 (2012). [DOI] [PMC free article] [PubMed] [Google Scholar]
- Van Peer G. et al. miRBase Tracker: keeping track of microRNA annotation changes. Database (Oxford) 2014, doi: 10.1093/database/bau080 (2014). [DOI] [PMC free article] [PubMed] [Google Scholar]
- Marques F. Z. et al. Signatures of miR-181a on renal transcriptome and blood pressure. Mol Med, doi: 10.2119/molmed.2015.00096 (2015). [DOI] [PMC free article] [PubMed] [Google Scholar]
- Marques F. Z. et al. Gene expression profiling reveals renin mRNA overexpression in human hypertensive kidneys and a role for microRNAs. Hypertension 58, 1093–1098, doi: 10.1161/hypertensionaha.111.180729 (2011). [DOI] [PubMed] [Google Scholar]
- Jackson K. L. et al. A novel interaction between sympathetic overactivity and aberrant regulation of renin by miR-181a in BPH/2J genetically hypertensive mice. Hypertension 62, 775–781, doi: 10.1161/hypertensionaha.113.01701 (2013). [DOI] [PubMed] [Google Scholar]
- Chen Y. Q. et al. Abated microRNA-195 expression protected mesangial cells from apoptosis in early diabetic renal injury in mice. J Nephrol 25, 566–576, doi: 10.5301/jn.5000034 (2012). [DOI] [PubMed] [Google Scholar]
- Chen Y. Q. et al. MicroRNA-195 promotes apoptosis in mouse podocytes via enhanced caspase activity driven by BCL2 insufficiency. Am J Nephrol 34, 549–559, doi: 10.1159/000333809 (2011). [DOI] [PubMed] [Google Scholar]
- Mortuza R., Feng B. & Chakrabarti S. miR-195 regulates SIRT1-mediated changes in diabetic retinopathy. Diabetologia 57, 1037–1046, doi: 10.1007/s00125-014-3197-9 (2014). [DOI] [PubMed] [Google Scholar]
- Bible E. Diabetic nephropathy: Sirt1 attenuates diabetic albuminuria. Nat Rev Nephrol 9, 696, doi: 10.1038/nrneph.2013.228 (2013). [DOI] [PubMed] [Google Scholar]
- Huang K. et al. Sirt1 resists advanced glycation end products-induced expressions of fibronectin and TGF-beta1 by activating the Nrf2/ARE pathway in glomerular mesangial cells. Free Radic Biol Med 65, 528–540, doi: 10.1016/j.freeradbiomed.2013.07.029 (2013). [DOI] [PubMed] [Google Scholar]
- Liu R. et al. Role of transcription factor acetylation in diabetic kidney disease. Diabetes 63, 2440–2453, doi: 10.2337/db13-1810 (2014). [DOI] [PMC free article] [PubMed] [Google Scholar]
- Kitada M., Kume S., Imaizumi N. & Koya D. Resveratrol improves oxidative stress and protects against diabetic nephropathy through normalization of Mn-SOD dysfunction in AMPK/SIRT1-independent pathway. Diabetes 60, 634–643, doi: 10.2337/db10-0386 (2011). [DOI] [PMC free article] [PubMed] [Google Scholar]
- Argyropoulos C. et al. Urinary MicroRNA Profiling Predicts the Development of Microalbuminuria in Patients with Type 1 Diabetes. J Clin Med 4, 1498–1517, doi: 10.3390/jcm4071498 (2015). [DOI] [PMC free article] [PubMed] [Google Scholar]
- Anglicheau D. et al. MicroRNA expression profiles predictive of human renal allograft status. Proc Natl Acad Sci USA 106, 5330–5335, doi: 10.1073/pnas.0813121106 (2009). [DOI] [PMC free article] [PubMed] [Google Scholar]
- Rudnicki M. et al. Renal microRNA- and RNA-profiles in progressive chronic kidney disease. Eur J Clin Invest 46, 213–226, doi: 10.1111/eci.12585 (2016). [DOI] [PubMed] [Google Scholar]
- Liu L., Lin W., Zhang Q., Cao W. & Liu Z. TGF-beta induces miR-30d down-regulation and podocyte injury through Smad2/3 and HDAC3-associated transcriptional repression. J Mol Med (Berl) 94, 291–300, doi: 10.1007/s00109-015-1340-9 (2016). [DOI] [PubMed] [Google Scholar]
- Lee H. S. Mechanisms and consequences of TGF-ss overexpression by podocytes in progressive podocyte disease. Cell Tissue Res 347, 129–140, doi: 10.1007/s00441-011-1169-7 (2012). [DOI] [PMC free article] [PubMed] [Google Scholar]
- Lai J. Y. et al. MicroRNA-21 in Glomerular Injury. J Am Soc Nephrol, doi: 10.1681/asn.2013121274 (2014). [DOI] [PMC free article] [PubMed] [Google Scholar]
- Pellegrini K. L. et al. Application of small RNA sequencing to identify microRNAs in acute kidney injury and fibrosis. Toxicol Appl Pharmacol, doi: 10.1016/j.taap.2015.12.002 (2015). [DOI] [PMC free article] [PubMed] [Google Scholar]
- Eskildsen T. V. et al. Angiotensin II regulates microRNA-132/-212 in hypertensive rats and humans. Int J Mol Sci 14, 11190–11207, doi: 10.3390/ijms140611190 (2013). [DOI] [PMC free article] [PubMed] [Google Scholar]
- Kume S. et al. SIRT1 inhibits transforming growth factor beta-induced apoptosis in glomerular mesangial cells via Smad7 deacetylation. J Biol Chem 282, 151–158, doi: 10.1074/jbc.M605904200 (2007). [DOI] [PubMed] [Google Scholar]
- Yuan Y. et al. Activation of peroxisome proliferator-activated receptor-gamma coactivator 1alpha ameliorates mitochondrial dysfunction and protects podocytes from aldosterone-induced injury. Kidney Int 82, 771–789, doi: 10.1038/ki.2012.188 (2012). [DOI] [PubMed] [Google Scholar]
- Serino G. et al. In a retrospective international study, circulating miR-148b and let-7b were found to be serum markers for detecting primary IgA nephropathy. Kidney Int, doi: 10.1038/ki.2015.333 (2015). [DOI] [PubMed] [Google Scholar]
- Serino G. et al. Role of let-7b in the regulation of N-acetylgalactosaminyltransferase 2 in IgA nephropathy. Nephrol Dial Transplant 30, 1132–1139, doi: 10.1093/ndt/gfv032 (2015). [DOI] [PubMed] [Google Scholar]
- Tanaka M. et al. Down-regulation of miR-92 in human plasma is a novel marker for acute leukemia patients. Plos One 4, e5532, doi: 10.1371/journal.pone.0005532 (2009). [DOI] [PMC free article] [PubMed] [Google Scholar]
- Liu H. et al. Genome-wide microRNA profiles identify miR-378 as a serum biomarker for early detection of gastric cancer. Cancer Lett 316, 196–203, doi: 10.1016/j.canlet.20.10.034 (2012). [DOI] [PubMed] [Google Scholar]
Associated Data
This section collects any data citations, data availability statements, or supplementary materials included in this article.