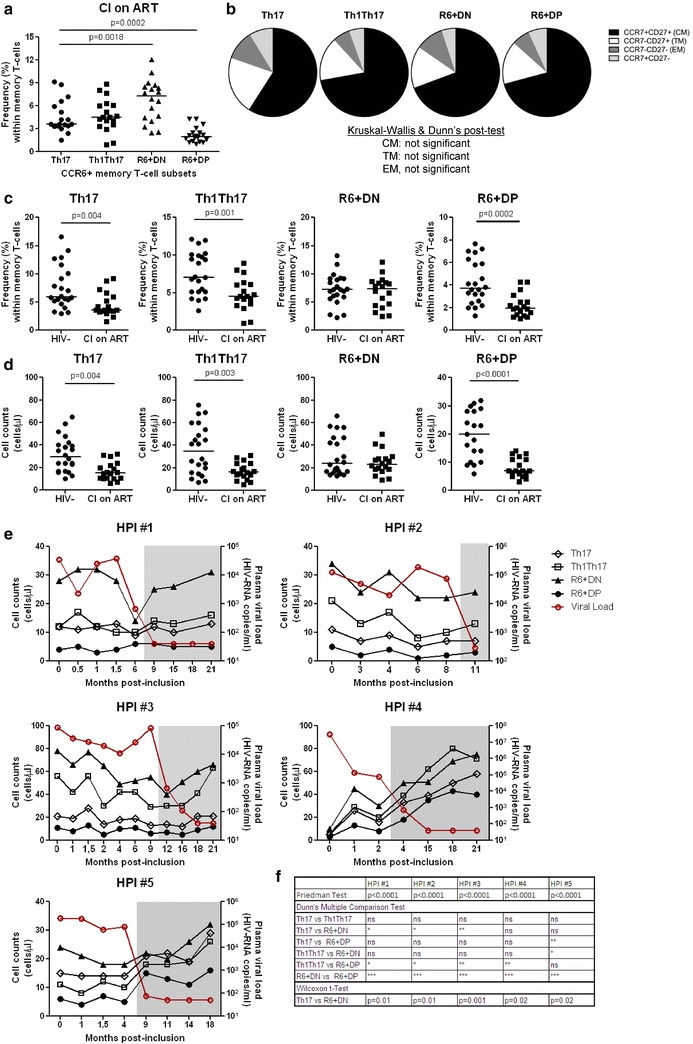
Fig. 6.

CCR6+DN distinguish from the other Th17-subsets by superior frequency/counts in CI on ART individuals. a PBMCs from CI on ART individuals (n = 20; Additional file 8: Table S2) were stained as in Fig. 1. Shown is the relative frequency of the four CCR6+ subsets in CI on ART individuals. Paired t-Test p-values are indicated on the figures. Horizontal bars indicate median values. b Shown are median frequencies of CM, TM, and EM within each CCR6+ subsets from CI on ART (n = 10). Shown is the frequency (c) and counts (d) of the four CCR6+ subsets in CI on ART versus uninfected individuals. Cell counts were calculated taking into account their frequency within the total CD4+ T-cell fraction. e The dynamics of CCR6+ subset counts were investigated longitudinally in n = 5 HIV-infected individuals from the Montreal HIV Primary infection cohort (Additional file 8: Table S3), in relationship with plasma viral load, before and after ART initiation (grey). f Shown are statistical analysis for differences in cell counts between the four CCR6+ subsets (n = 5 HIV-infected individuals) using Friedman test and the post-test Dunn’s multiple comparison and Wilcoxon t test
