

Abstract
Background
The predictive accuracy of the American Joint Committee on Cancer (AJCC) stages of colorectal cancer (CRC) is mediocre. This study aimed to develop postoperative nomograms to predict cancer-specific survival (CSS) and overall survival (OS) after CRC resection without preoperative therapy.
Methods
Eligible patients with stage I to IV CRC (n = 56072) diagnosed from 2004 to 2010 were selected from the Surveillance, Epidemiology, and End Results (SEER) database. The patients were allocated into training (n = 27,700), contemporary (n = 3158), and prospective (n = 25,214) validation cohorts. Clinically important variables were incorporated and selected using the Akaike information criterion in multivariate Cox regressions to derive nomograms with the training cohort. The performance of the nomograms was assessed and externally testified using the concordance index (c-index), bootstrap validation, calibration, time-dependent receiver-operating characteristic curves, Kaplan–Meier curves, mosaic plots, and decision curve analysis (DCA). Performance of the conventional AJCC stages was also compared with the nomograms using similar statistics.
Results
The nomograms for CSS and OS shared common predictors: sex, age, race, marital status, preoperative carcinoembryonic antigen status, surgical extent, tumor size, location, histology, differentiation, infiltration depth, lymph node count, lymph node ratio, and metastasis. The c-indexes of the nomograms for CSS and OS were 0.816 (95 % CI 0.810–0.822) and 0.777 (95 % CI 0.772–0.782), respectively. Performance evaluations showed that the nomograms achieved considerable predictive accuracy, appreciable reliability, and significant clinical validity with wide practical threshold probabilities, while the results remained reproducible when applied to the validation cohorts. Additionally, model comparisons and DCA proved that the nomograms excelled in stratifying each AJCC stage into three significant prognostic subgroups, allowing for more robust risk classification with an improved net benefit.
Conclusions
We propose two prognostic nomograms that exhibit improved predictive accuracy and net benefit for patients who have undergone CRC resection. The established nomograms are intended for risk assessment and selection of suitable patients who may benefit from adjuvant therapy and intensified follow-up after surgery. Independent external validations may still be required.
Keywords: Colorectal cancer, Nomogram, Cancer-specific survival, Overall survival, Decision curve analysis
Background
Colorectal cancer (CRC) is a leading contributor to cancer mortality worldwide [1, 2]. Surgical treatment is the mainstay for elimination of CRC and continuity of life [3, 4]. However, patients with a high risk of postoperative progression of CRC require additional interventions and informed decision-making with the help of physicians [3–5]. Among the vast spectrum of clinicopathological information [3, 6], the American Joint Committee on Cancer (AJCC) stages of CRC are fundamental for choosing optimal clinical interventions, and their use remains at the forefront of predicting and treating CRC [7]. Unfortunately, many observations are not consistent with the assumed relationship between advanced anatomical stages and reduced survival probabilities. For instance, disease recurs in 25 % of patients with early CRC who are node-negative following curative resection [8]. Patients with stage II CRCs with low-risk features more frequently encounter adverse events than those with high-risk features [9]. Postoperative adjuvant therapies for patients with stage II CRC with fewer than 12 recovered nodes or other risk factors have not gained a clear survival benefit as expected [10–12]; however, a substantial improvement in survival has been achieved for patients with stage III CRC [11, 12]. Therapeutic effects only partially explain the conspicuous survival inhomogeneity within stage III CRC although stage migrations due to inadequate pathologic assessment may also play a role [13, 14]. Metastatic CRC after curative hepatic resection has a 5-year overall survival (OS) of 47.7 to 57.6 % [15, 16], while the OS of most patients with unresectable metastatic CRC is extremely poor [17]. Survival of CRC remains poor for multiple reasons that are not limited to tumor-related factors. Despite the increased complexity among several modifications of the AJCC cancer staging manuals [14], the AJCC stages have intrinsic defects as an anatomy-dependent rather than multidiscipline-integrated metric [18]. Moreover, the AJCC stages force categorization of tumor dissemination in a stepwise fashion, causing additional loss of predictive accuracy [18, 19]. A consequential issue has thus emerged: both the 5-year cancer-specific survival (CSS) and OS are heterogeneous among patients with the same stage of CRC [14].
Many useful factors are not sufficiently utilized in clinical prognostication. The plasma carcinoembryonic antigen (CEA) concentration is strongly predictive [15, 19] and plays roles in staging other than indicating recurrence. Patient-specific factors such as sex, ethnicity, and marital status are also associated with survival [1, 2, 20, 21], representing untapped information that may be useful for individualized therapies and outcomes. Many other parameters included in routine pathologic reports are also apparent survival determinants, including tumor location, size, histology, grade, differentiation, lymph node count (LNC), lymph node ratio (LNR), and surgical extent [6]. All of these elements are inseparable qualities of a “successful cancer career,” of which more detailed evaluations are still required, however.
We anticipate that the combined performance of the above-mentioned factors is superior to that of the AJCC stages and may serve as a more precise and reproducible tool for individualized survival estimations. We have herein incorporated clinically important variables with data from the Surveillance, Epidemiology, and End Results (SEER) database to develop validated prognostic nomograms for predicting CSS and OS of patients with surgically treated CRC without neoadjuvant therapies.
Methods
Patient eligibility and variables
The SEER program is a national database and primary source of cancer statistics that is currently maintained by the National Cancer Institute [22]. The data of patients with CRC diagnosed from 2004 to 2010 were retrieved from the SEER research database using the SEER*Stat program (v 8.2.1) [22]. In total, 265,030 records were retrieved. Any surgically treated, pathologically proven, staged colorectal adenocarcinomas were considered. Only patients who met the following criteria were included in the formal analysis: (1) known preoperative CEA status, (2) no history of malignancy, (3) microscopically proven stage I to IV primary adenocarcinoma (including signet ring cell carcinoma), (3) no adjuvant therapy before surgery, (4) cancer-directed surgery of primary tumors with sufficient information to specify the T/N/M stage and LNC/LNR, (5) active follow-up with complete date and known outcome, and (6) adequate/consistent information to specify the primary tumor site, size, and other variables. Patients aged <18 or >99 years and those with multiple primary cancers were excluded. Patients were also excluded if their T/N did not meet pathological staging criteria (not pT/N). These patients were small in number, but they might have introduced bias to the survival analysis; thus, they were excluded.
The following variables were assessed: sex, age, race, marital status, year of diagnosis, primary tumor location, size, histology, grade, TNM stage, LNC, cause-specific death, and vital status. Cancer stages reported using the 6th AJCC/TNM stages (AJCC6) were converted based on the 7th edition (AJCC7). The LNR was calculated by dividing metastatic node number by the LNC.
After patient exclusion based on the above-mentioned criteria, 56,072 eligible patients were identified. Patients diagnosed from 2004 to 2007 were randomized into a training cohort and a contemporary validation cohort (ratio, 90:10). The remaining patients were diagnosed from 2008 to 2010 and were thus assigned to a prospective test cohort (Fig. 1).
Fig. 1.
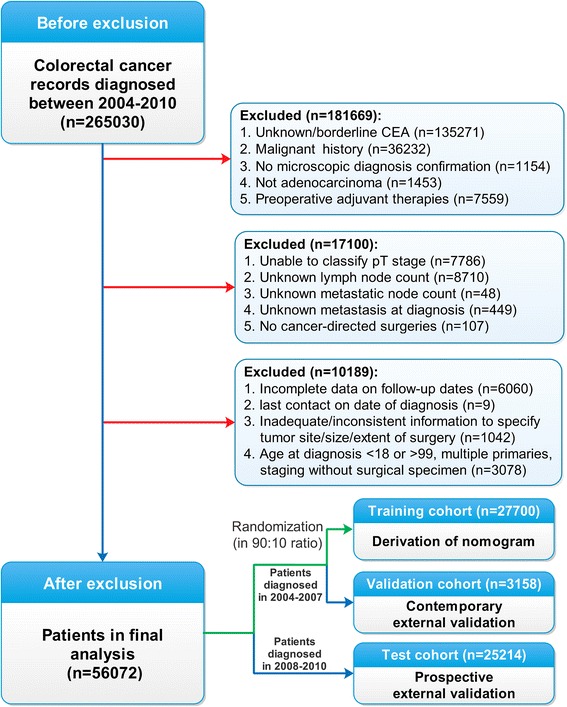
Flow diagram of patient selection and study development
Statistical methods
Discontinuous variables were categorized before modeling based on clinical reasoning and significance. Linear assumptions of continuous variables (age, LNC, and LNR) were relaxed with restricted cubic spline functions to determine the optimal number of knots by maximizing goodness of fit using the log-likelihood and minimizing information loss using the Akaike information criterion (AIC) [23]. Multivariate models for nomograms were built by incorporating significant variables from univariate Cox proportional hazard regressions in a backward stepwise manner based on the AIC. Model performance was appraised using the concordance index (c-index) and internally testified by 200-sample bootstrap validation and calibration. External validation was performed by applying nomograms to the contemporary validation cohort and prospective test cohort separately, followed by evaluation of similar statistics in the new data sets. Different c-indexes were compared using the compareC [24] package. Next, patients in all cohorts were given an aggregated score using standard points derived from the nomograms. Time-dependent receiver-operating characteristic (ROC) curve analysis was performed with the timeROC [25] package to evaluate the performance of the nomograms with the accumulated scores as a continuous predictive variable. The nomograms were compared with the AJCC6/7 stages by risk classification and stratification using Kaplan–Meier survival curves and statistically clarified by quantifying the cumulative 5-year survival and hazard ratios for each stratum. Briefly, risk classification was achieved by ranking the accumulated nomogram scores by deciles to derive 10 risk groups (Nomo stages) with patients in the training cohort. For risk stratification, the patients were divided by score tertiles for each AJCC7 substage to generate three prognostic strata: low-, median-, and high-risk. The two external cohorts were likewise classified and stratified according to thresholds defined by the training cohort. Next, mosaic plots were drawn to demonstrate the AJCC7 stage distributions in contrast with the Nomo stages. After addressing the accuracy of the nomograms, decision curve analysis (DCA) [26] was performed to finalize the ranges of threshold probabilities within which the nomograms were clinically valuable. The patients were randomly allocated using the PASW 18.0 program (SPSS Inc., Chicago, IL); the other analyses were processed with the R program (v 3.2.3) using rms [23] and the above-mentioned packages. Only a two-tailed P value of <0.05 was considered statistically significant. This study followed the TRIPOD statement [27] and adhered to the Declaration of Helsinki for medical research involving human subjects [28].
Results
Baseline characteristics
The characteristics of the patients in the derivation and validation cohorts are shown in Table 1.
Table 1.
Characteristics of patients with colorectal cancer
| Variables | Training cohort | Validation cohort | Test cohort | |||
|---|---|---|---|---|---|---|
| (n = 27700) | (n = 3158) | (n = 25214) | ||||
| Sex, n, % | ||||||
| Female | 14077 | 50.8 | 1605 | 50.8 | 12702 | 50.4 |
| Male | 13623 | 49.2 | 1553 | 49.2 | 12512 | 49.6 |
| Age, year, median, range | 67 | 18–99 | 67 | 18–99 | 67 | 18–99 |
| Race, n, % | ||||||
| White | 21722 | 78.4 | 2428 | 76.9 | 19710 | 78.2 |
| Black | 3422 | 12.4 | 412 | 13.0 | 3106 | 12.3 |
| Yellow (Chinese, Korean and Japanese) | 1229 | 4.4 | 169 | 5.4 | 1075 | 4.3 |
| Other | 1327 | 4.8 | 149 | 4.7 | 1323 | 5.2 |
| Marital status at diagnosis, n, % | ||||||
| Married (including separated) | 15900 | 57.4 | 1812 | 57.3 | 14166 | 56.2 |
| Divorced | 2378 | 8.6 | 266 | 8.4 | 2297 | 9.1 |
| Single (never married) | 3519 | 12.7 | 406 | 12.9 | 3553 | 14.1 |
| Widowed | 5185 | 18.7 | 601 | 19.1 | 4363 | 17.3 |
| Unknown | 718 | 2.6 | 73 | 2.3 | 835 | 3.3 |
| CEA status, n, % | ||||||
| Negative | 15550 | 56.1 | 1803 | 57.1 | 14824 | 58.8 |
| Positive | 12150 | 43.9 | 1355 | 42.9 | 10390 | 41.2 |
| Tumor site, n, % | ||||||
| Proximal colon (cecum to splenic flexure) | 14341 | 51.7 | 1621 | 51.3 | 13790 | 54.7 |
| Distal colon (descending to sigmoid colon) | 8015 | 29.0 | 952 | 30.2 | 7441 | 29.5 |
| Overlapping lesion of colon | 284 | 1.0 | 24 | 0.8 | 275 | 1.1 |
| Rectum (including rectosigmoid junction) | 5060 | 18.3 | 561 | 17.7 | 3708 | 14.7 |
| Tumor size, n, % | ||||||
| ≤ 5 cm | 16861 | 60.9 | 1966 | 62.3 | 15178 | 60.2 |
| > 5 cm | 9120 | 32.9 | 998 | 31.6 | 8557 | 33.9 |
| Unknown | 1719 | 6.2 | 194 | 6.1 | 1479 | 5.9 |
| Extent of surgery, n, % | ||||||
| Local/segmental resection | 12879 | 46.5 | 1505 | 47.7 | 11464 | 45.5 |
| Subtotal/hemisection | 13991 | 50.5 | 1549 | 49.0 | 13137 | 52.1 |
| Total resection | 830 | 3.0 | 104 | 3.3 | 613 | 2.4 |
| Histology, n, % | ||||||
| Adenocarcinoma | 27375 | 98.8 | 3116 | 98.7 | 24975 | 99.1 |
| Signet ring cell carcinoma | 325 | 1.2 | 42 | 1.3 | 239 | 0.9 |
| Tumor grade, n, % | ||||||
| Well to Moderately differentiated (G1 + G2) | 21137 | 76.3 | 2435 | 77.1 | 19450 | 77.2 |
| Poorly to Undifferentiated (G3 + G4) | 5931 | 21.4 | 646 | 20.5 | 5202 | 20.6 |
| Unknown | 632 | 2.3 | 77 | 2.4 | 562 | 2.2 |
| pT stage, n, % | ||||||
| pT1 | 2381 | 8.6 | 272 | 8.6 | 2662 | 10.6 |
| pT2 | 3987 | 14.4 | 447 | 14.2 | 3844 | 15.2 |
| pT3 | 17094 | 61.7 | 1980 | 62.7 | 14887 | 59.0 |
| pT4a | 2244 | 8.1 | 256 | 8.1 | 2242 | 8.9 |
| pT4b | 1994 | 7.2 | 203 | 6.4 | 1579 | 6.3 |
| pN stage, n, % | ||||||
| N0 | 14069 | 50.8 | 1615 | 51.1 | 13378 | 53.1 |
| N1a | 3445 | 12.4 | 402 | 12.7 | 3005 | 11.9 |
| N1b | 3960 | 14.3 | 456 | 14.4 | 3378 | 13.4 |
| N2a | 3055 | 11.0 | 356 | 11.2 | 2611 | 10.4 |
| N2b | 3171 | 11.5 | 329 | 10.4 | 2842 | 11.2 |
| Lymph node count, mean, sd | 15.7 | 9.6 | 15.8 | 9.6 | 18.4 | 9.6 |
| Lymph node ratio, mean, IQR | 0.16 | 0–0.24 | 0.16 | 0–0.22 | 0.13 | 0–0.18 |
| Metastasis, n, % | ||||||
| M0 | 22512 | 81.3 | 2587 | 81.9 | 21112 | 83.7 |
| M1 | 5188 | 18.7 | 571 | 18.1 | 4102 | 16.3 |
| Follow-up | 63 | 1–107 | 64 | 1–107 | 34 | 1–59 |
| Number of events | 9341 | 13359 | 1055 | 1496 | 5659 | 7689 |
| 1-year cumulative survival | 87.9 | 84.1 | 88.6 | 84.7 | 89.8 | 86.5 |
| 3-year cumulative survival | 73.8 | 67.1 | 75.1 | 68.7 | 77.3 | 70.9 |
| 5-year cumulative survival a | 66.6 | 57.2 | 67.7 | 58.6 | 70.8 | 60.6 |
aSurvival probabilities of the test cohort at 5 years were approximated at 59 months
CEA carcinoembryonic antigen, sd standard deviation, IQR interquartile range, CSS cancer-specific survival, OS overall survival
Cox regression of training cohort
No continuous variables (age, LNC, or LNR) had linear effects on either CSS or OS (Fig. 2). All variables assessed in the univariate analysis (Table 2) remained significant in the multivariate Cox regressions except tumor size (Table 3).
Fig. 2.
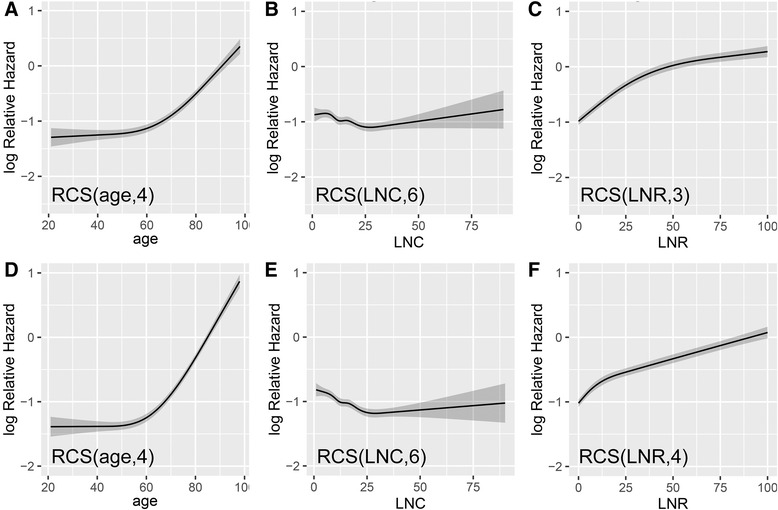
Adjusted relative hazards with continuous variables. a–c The optimized number of knots applied in the multivariate analysis of CSS was 4, 6, and 3 for age, LNC, and LNR, respectively. d–f These numbers of knots were 4, 6, and 4 for the same three variables in the analysis of OS. RCS, restricted cubic spline function; CSS, cancer-specific survival; OS, overall survival; LNC, lymph node count; LNR, lymph node ratio
Table 2.
Univariate cox regression analysis of training cohort
| Variables | Cancer-specific survival | Overall survival | ||||
|---|---|---|---|---|---|---|
| HR | 95 % CI | P | HR | 95 % CI | P | |
| Sex | ||||||
| Female | ref | ref | ||||
| Male | 1.060 | 1.018–1.104 | 0.0049 | 1.055 | 1.019–1.091 | 0.0021 |
| Race | ||||||
| White | ref | ref | ||||
| Black | 1.278 | 1.206–1.354 | <0.0001 | 1.157 | 1.101–1.216 | <0.0001 |
| Yellow (Chinese, Korean and Japanese) | 0.762 | 0.682–0.850 | <0.0001 | 0.701 | 0.638–0.770 | <0.0001 |
| Other | 0.974 | 0.884–1.072 | 0.5850 | 0.870 | 0.800–0.946 | 0.0011 |
| Marital status at diagnosis | ||||||
| Married (including separated) | ref | ref | ||||
| Divorced | 1.171 | 1.088–1.259 | <0.0001 | 1.175 | 1.103–1.251 | <0.0001 |
| Single (never married) | 1.332 | 1.255–1.414 | <0.0001 | 1.316 | 1.250–1.386 | <0.0001 |
| Widowed | 1.376 | 1.305–1.450 | <0.0001 | 1.746 | 1.675–1.821 | <0.0001 |
| Unknown | 1.045 | 0.914–1.196 | 0.5175 | 1.246 | 1.120–1.387 | 0.0001 |
| CEA status | ||||||
| Negative | ref | ref | ||||
| Positive | 3.174 | 3.042–3.313 | <0.0001 | 2.449 | 2.366–2.535 | <0.0001 |
| Tumor site | ||||||
| Proximal colon | ref | ref | ||||
| Distal colon | 0.892 | 0.850–0.935 | <0.0001 | 0.835 | 0.803–0.869 | <0.0001 |
| Overlapping lesion of colon | 1.382 | 1.153–1.657 | 0.0005 | 1.294 | 1.108–1.510 | 0.0011 |
| Rectum | 0.880 | 0.833–0.931 | <0.0001 | 0.825 | 0.787–0.865 | <0.0001 |
| Tumor size | ||||||
| ≤ 5 cm | ref | ref | ||||
| > 5 cm | 1.429 | 1.370–1.491 | <0.0001 | 1.316 | 1.270–1.363 | <0.0001 |
| Unknown | 0.821 | 0.746–0.904 | 0.0001 | 0.806 | 0.745–0.873 | <0.0001 |
| Extent of surgery | ||||||
| Local/segmental resection | ref | ref | ||||
| Subtotal/hemisection | 1.161 | 1.114–1.211 | <0.0001 | 1.181 | 1.141–1.223 | <0.0001 |
| Total resection | 1.527 | 1.373–1.699 | <0.0001 | 1.388 | 1.264–1.525 | <0.0001 |
| Histology | ||||||
| Adenocarcinoma | ref | ref | ||||
| Signet ring cell carcinoma | 2.648 | 2.304–3.044 | <0.0001 | 2.180 | 1.916–2.480 | <0.0001 |
| Tumor grade | ||||||
| G1/G2 | ref | ref | ||||
| G3/G4 | 1.903 | 1.820–1.989 | <0.0001 | 1.614 | 1.553–1.678 | <0.0001 |
| Unknown | 1.007 | 0.871–1.164 | 0.9283 | 0.942 | 0.834–1.064 | 0.3372 |
| pT stage | ||||||
| pT1 | ref | ref | ||||
| pT2 | 1.854 | 1.556–2.209 | <0.0001 | 1.662 | 1.495–1.848 | <0.0001 |
| pT3 | 6.161 | 5.285–7.182 | <0.0001 | 3.150 | 2.871–1.848 | <0.0001 |
| pT4a | 13.422 | 11.43–15.760 | <0.0001 | 5.775 | 5.21–6.400 | <0.0001 |
| pT4b | 17.429 | 14.844–20.464 | <0.0001 | 7.324 | 6.607–8.120 | <0.0001 |
| Metastasis | ||||||
| M0 | ref | ref | ||||
| M1 | 7.733 | 7.414–8.066 | <0.0001 | 4.953 | 4.773–5.139 | <0.0001 |
HR hazard ratio, 95 % CI 95 % confident interval, ref reference category, CEA carcinoembryonic antigen
Table 3.
Multivariate cox regression analysis of training cohort
| Cancer-specific survival | Overall survival | |||||
|---|---|---|---|---|---|---|
| Covariates | HR | 95 % CI | P | HR | 95 % CI | P |
| Sex (Male vs. Female) | 1.142 | 1.094–1.193 | <0.0001 | 1.246 | 1.202–1.293 | <0.0001 |
| Race (ref, White) | ||||||
| Black | 1.199 | 1.130–1.273 | <0.0001 | 1.191 | 1.132–1.254 | <0.0001 |
| Yellow (Chinese, Korean, Japanese) | 0.784 | 0.702–0.875 | <0.0001 | 0.713 | 0.649–0.784 | <0.0001 |
| Other | 1.030 | 0.935–1.135 | 0.5449 | 0.996 | 0.915–1.083 | 0.9203 |
| Marital status at diagnosis (ref, Married) | ||||||
| Divorced | 1.175 | 1.092–1.265 | <0.0001 | 1.214 | 1.139–1.293 | <0.0001 |
| Single (never married) | 1.235 | 1.161–1.313 | <0.0001 | 1.277 | 1.211–1.346 | <0.0001 |
| Widowed | 1.189 | 1.118–1.264 | <0.0001 | 1.224 | 1.165–1.285 | <0.0001 |
| Unknown | 1.014 | 0.886–1.161 | 0.8424 | 1.145 | 1.029–1.275 | 0.0131 |
| CEA status (Positive vs. negative) | 1.589 | 1.517–1.664 | <0.0001 | 1.486 | 1.431–1.543 | <0.0001 |
| Extent of surgery (ref, Loc/seg resection) | ||||||
| Subtotal/hemisection | 1.067 | 1.012–1.125 | 0.0156 | 1.040 | 0.995–1.087 | 0.0824 |
| Total resection | 1.269 | 1.139–1.414 | <0.0001 | 1.180 | 1.073–1.297 | 0.0007 |
| Tumor site (ref, Proximal colon) | ||||||
| Distal colon | 0.910 | 0.860–0.962 | <0.0001 | 0.918 | 0.876–0.962 | 0.0004 |
| Overlapping lesion of colon | 1.090 | 0.909–1.307 | 0.3545 | 1.111 | 0.952–1.298 | 0.1824 |
| Rectum | 1.002 | 0.935–1.074 | 0.9516 | 0.981 | 0.926–1.040 | 0.5211 |
| Tumor size (ref, ≤ 5 cm) | ||||||
| >5 cm | 1.029 | 0.984–1.076 | 0.2050 | 1.026 | 0.989–1.066 | 0.1741 |
| Unknown | 1.141 | 1.035–1.258 | 0.0078 | 1.075 | 0.991–1.166 | 0.0810 |
| Histology (ref, Adenocarcinoma) | ||||||
| Signet ring cell carcinoma | 1.409 | 1.220–1.626 | <0.0001 | 1.380 | 1.209–1.575 | <0.0001 |
| Tumor grade (ref, G1/G2) | ||||||
| G3/G4 | 1.278 | 1.219–1.339 | <0.0001 | 1.184 | 1.137–1.233 | <0.0001 |
| Unknown | 1.143 | 0.987–1.323 | 0.0736 | 1.049 | 0.927–1.186 | 0.4501 |
| pT stage (ref, pT1) | ||||||
| pT2 | 1.567 | 1.312–1.872 | <0.0001 | 1.398 | 1.254–1.558 | <0.0001 |
| pT3 | 2.949 | 2.516–3.457 | <0.0001 | 1.796 | 1.628–1.981 | <0.0001 |
| pT4a | 4.429 | 3.746–5.237 | <0.0001 | 2.508 | 2.247–2.799 | <0.0001 |
| pT4b | 4.760 | 4.021–5.634 | <0.0001 | 2.746 | 2.456–3.069 | <0.0001 |
| Metastasis (M1 vs. M0) | 4.075 | 3.876–4.284 | <0.0001 | 3.357 | 3.213–3.508 | <0.0001 |
HR hazard ratio, 95 % CI 95 % confident interval, ref reference category, Loc/seg resection Local/segmental resection, CEA carcinoembryonic antigen
Nomograms for CSS and OS
As selected by the AIC, all tested covariates were employed in the nomograms. The c-indexes were 0.816 (95 % CI 0.810–0.822) and 0.777 (95 % CI 0.772–0.782) for the CSS (Fig. 3a) and OS (Fig. 3b) predictive nomograms, respectively. Details of the nomograms’ labels and points were shown in Table 4 and Table 5.
Fig. 3.
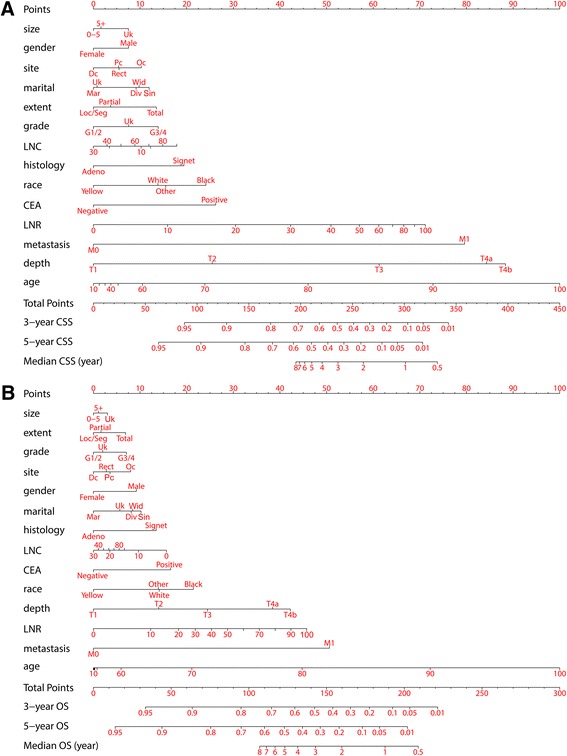
Nomograms for (a) CSS and (b) OS. Generally, each individual involved covariate was assessed for the patient and given a point on the basis of the nomograms. Aggregated points were obtained by summing the given points of all involved variables. The aggregated points corresponded to particular survival probabilities and median survival years that could be indicated by the nomograms. A higher total number of points frequently indicated a higher possibility of adverse outcomes (CSS or OS) and therefore a lower expected survival. CSS, cancer-specific survival; OS, overall survival
Table 4.
Points for categorical variables in nomograms
| Points | |||
|---|---|---|---|
| Variables | Labels for tick marks | CSS | OS |
| Sex | |||
| Female | Female | 0 | 0 |
| Male | Male | 7.5 | 9.2 |
| Race | |||
| White | White | 13.8 | 14.1 |
| Black | Black | 24.1 | 21.4 |
| Yellow (Chinese, Korean and Japanese) | Yellow | 0 | 0 |
| Other | Other | 15.5 | 13.9 |
| Marital status at diagnosis | |||
| Married (including separated) | Mar | 0 | 0 |
| Divorced | Div | 9.2 | 8.1 |
| Single (never married) | Sin | 11.9 | 10.2 |
| Widowed | Wid | 9.8 | 8.4 |
| Unknown | Uk | 0.8 | 5.7 |
| CEA status | |||
| Negative | Negative | 0 | 0 |
| Positive | Positive | 26.2 | 16.6 |
| Tumor site | |||
| Proximal colon (cecum to splenic flexure) | Pc | 5.4 | 3.6 |
| Distal colon (descending to sigmoid colon) | Dc | 0 | 0 |
| Overlapping lesion of colon | Oc | 10.3 | 8.0 |
| Rectum (including rectosigmoid junction) | Rect | 5.5 | 2.8 |
| Tumor size | |||
| ≤5 cm | 0–5 | 0 | 0 |
| >5 cm | 5+ | 1.6 | 1.1 |
| Unknown | Uk | 7.5 | 3.0 |
| Extent of surgery | |||
| Local/segmental resection | Loc/Seg | 0 | 0 |
| Subtotal/hemisection | Partial | 3.7 | 1.6 |
| Total resection | Total | 13.5 | 6.9 |
| Histology | |||
| Adenocarcinoma | Adeno | 0 | 0 |
| Signet ring cell carcinoma | Signet | 19.4 | 13.5 |
| Tumor grade | |||
| Well to Moderately differentiated (G1 + G2) | G1/2 | 0 | 0 |
| Poorly to Undifferentiated (G3 + G4) | G3/4 | 13.9 | 7.1 |
| Unknown | Uk | 7.6 | 2.0 |
| pT stage | |||
| pT1 | T1 | 0 | 0 |
| pT2 | T2 | 25.5 | 14.0 |
| pT3 | T3 | 61.3 | 24.5 |
| pT4a | T4a | 84.3 | 38.4 |
| pT4b | T4b | 88.4 | 42.2 |
| Metastasis | |||
| M0 | M0 | 0 | 0 |
| M1 | M1 | 79.6 | 50.6 |
CSS cancer-specific survival, OS overall survival, CEA carcinoembryonic antigen
Table 5.
Points for continuous variables in nomograms
| Age at diagnosis | Lymph node count, n | Lymph node ratio | ||||||
|---|---|---|---|---|---|---|---|---|
| Values, no. | Pts for CSS | Pts for OS | Values, no. | Pts for CSS | Pts for OS | Values, % | Pts for CSS | Pts for OS |
| 10 | 0.0 | 0.0 | 0 | 12.3 | 15.7 | 0 | 0.0 | 0.0 |
| 20 | 1.2 | 0.1 | 10 | 10.2 | 9.7 | 10 | 15.9 | 12.3 |
| 30 | 2.5 | 0.2 | 20 | 3.4 | 3.5 | 20 | 30.5 | 18.2 |
| 40 | 3.7 | 0.3 | 30 | 0.0 | 0.0 | 30 | 42.3 | 21.8 |
| 50 | 5.3 | 0.8 | 40 | 2.9 | 1.1 | 40 | 50.9 | 25.3 |
| 60 | 10.5 | 5.9 | 50 | 5.9 | 2.2 | 50 | 57.0 | 28.8 |
| 70 | 23.9 | 21.1 | 60 | 8.9 | 3.3 | 60 | 61.2 | 32.2 |
| 80 | 46.0 | 44.8 | 70 | 11.9 | 4.4 | 70 | 64.2 | 35.6 |
| 90 | 72.8 | 72.2 | 80 | 14.9 | 5.5 | 80 | 66.5 | 39.0 |
| 100 | 100.0 | 100.0 | 90 | 17.9 | 6.6 | 90 | 68.9 | 42.4 |
| 100 | 71.2 | 45.7 | ||||||
Pts points, CSS cancer-specific survival, OS overall survival
Internal validation
The bootstrap-corrected c-indexes (CSS, 0.8157; OS, 0.7768) were close to those of the nomograms. Both models exhibited good validation.
Nomogram calibration
As shown in the calibration plots, the nomogram-predicted 3- and 5-year CSS and OS were well correlated with the corresponding Kaplan–Meier estimates (Fig. 4), suggesting appreciable reliability of the nomograms.
Fig. 4.
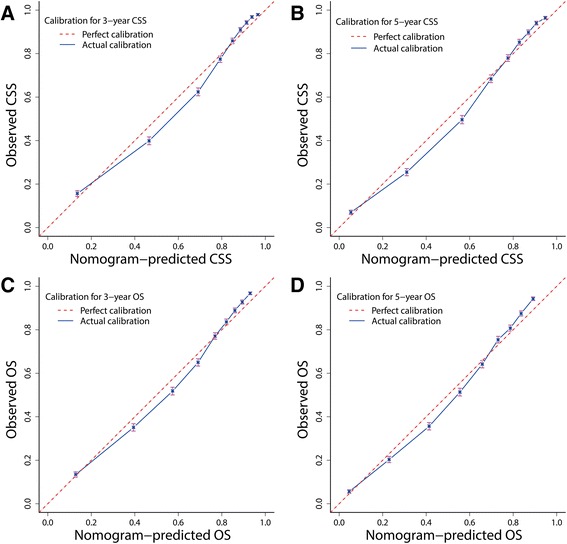
Bootstrap calibrations of nomograms. The predicted 3- and 5-year (a, b) CSS and (c, d) OS were well correlated with the actual survival probabilities
External validation
The c-indexes of the nomograms for prediction of CSS and OS were 0.809 (95 % CI 0.791–0.827) and 0.773 (95 % CI 0.757–0.789) in the validation cohort, while the optimism-corrected c-indexes were 0.804 and 0.768, respectively. In the test cohort, the c-indexes were 0.839 (95 % CI 0.830–0.846) and 0.802 (95 % CI 0.796–0.808) with corrected estimates of 0.838 and 0.801 for CSS and OS prediction, respectively. The external calibration plots also showed good validation (Fig. 5).
Fig. 5.
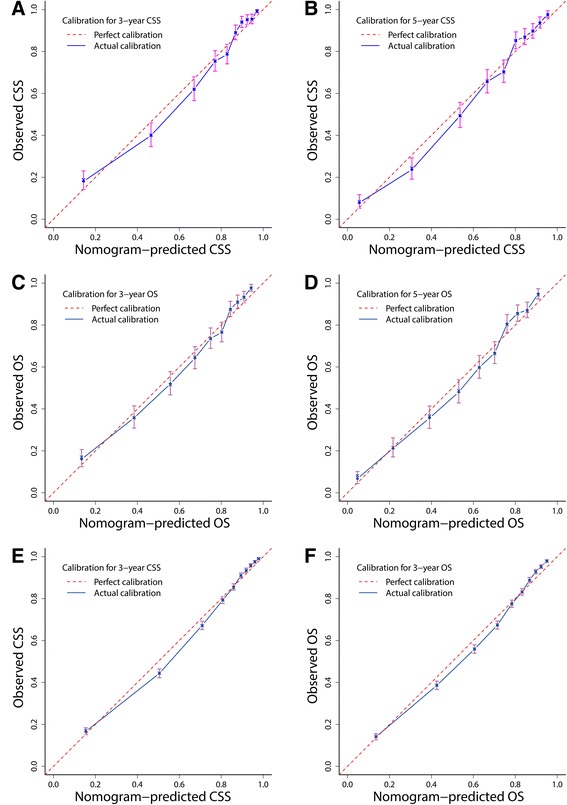
Bootstrap calibration of nomograms in the external cohorts. The nomograms were externally calibrated in the validation cohort by predicting the 3- and 5-year (a, b) CSS and (c, d) OS. The nomograms were also calibrated in the test cohort for the 3-year (e) CSS and (f) OS. All results showed good validation. CSS, cancer-specific survival; OS, overall survival
Time-dependent ROC curve analysis
The areas under the ROC curve (AUCs) for predicting CSS ranged from 83.0 to 87.8 % in the three cohorts from 1 to 7 years. The AUCs for predicting OS varied from 80.6 to 84.6 % during the same years (Table 6). The nomograms exhibited considerable efficiency to discriminate outcomes.
Table 6.
Time-dependent receiver-operating characteristic curves analysis
| Cancer-specific survival | Overall survival | |||||||
|---|---|---|---|---|---|---|---|---|
| AUC, % | AUC, % | |||||||
| Study cohort | 1 year | 3 years | 5 years | 7 years | 1 year | 3 years | 5 years | 7 years |
| Training cohort | 85.2 | 87.6 | 87.5 | 86.6 | 82.1 | 84.1 | 84.2 | 83.6 |
| Validation cohort | 83.0 | 87.1 | 86.7 | 85.5 | 80.6 | 83.7 | 83.7 | 82.7 |
| Test cohort | 86.0 | 87.8 | / | / | 83.1 | 84.6 | / | / |
AUC area under the time-dependent receiver-operating characteristic curves
Comparison of nomograms with AJCC stages
First, when compared with the AJCC6/7 stages, the nomograms yielded the largest log-likelihoods and c-indexes along with the smallest AIC values for CSS and OS prediction in all cohorts (Table 7). These results imply that the nomograms were more robust than the AJCC stages.
Table 7.
Comparison of nomogram with AJCC staging system
| Nomogram score | 7th AJCC stage | 6th AJCC stage | P | |
|---|---|---|---|---|
| Training cohort, CSS | ||||
| AIC | 172262 | 174703 | 174949 | / |
| Log-likelihood | −86130 | −87344 | −87468 | All <0.0001 |
| C-index (95 % CI) | 0.816 (0.810–0.822) | 0.777 (0.771–0.783) | 0.774 (0.768–0.780) | All <0.0001 |
| Training cohort, OS | ||||
| AIC | 250348 | 255973 | 256182 | / |
| Log-likelihood | −125173 | −127979 | −128085 | All <0.0001 |
| C-index (95 % CI) | 0.777 (0.772–0.782) | 0.698 (0.693–0.0.703) | 0.696 (0.691–0.701) | All <0.0001 |
| Validation cohort, CSS | ||||
| AIC | 14983 | 15261 | 15272 | / |
| Log-likelihooda | −7490 | −7623 | −7630 | All <0.0001 |
| C-indexb (95 % CI) | 0.809 (0.791–0.827) | 0.770 (0.752–0.788) | 0.768 (0.750–0.786) | All <0.0001 |
| Validation cohort, OS | ||||
| AIC | 21611 | 22235 | 22244 | / |
| Log-likelihoodc | −10805 | −11110 | −11116 | All <0.0001 |
| C-indexd (95 % CI) | 0.773 (0.757–0.789) | 0.699 (0.683–0.715) | 0.697 (0.681–0.713) | All <0.0001 |
| Test cohort, CSS | ||||
| AIC | 102103 | 104057 | 105039 | / |
| Log-likelihood | −51050 | −52021 | −52519 | All <0.0001 |
| C-index (95 % CI) | 0.838 (0.830–0.846) | 0.794 (0.786–0.802) | 0.786 (0.778–0.794) | All <0.0001 |
| Test cohort, OS | ||||
| AIC | 141606 | 145343 | 146456 | / |
| Log-likelihood | −70802 | −72664 | −73227 | All <0.0001 |
| C-index (95 % CI) | 0.802 (0.796–0.808) | 0.723 (0.717–0.729) | 0.715 (0.709–0.721) | All <0.0001 |
AJCC American joint committee on cancer, AIC akaike information criterion, C-index concordance index, 95 % CI 95 % confident interval
aThe P value comparing 6th and 7th AJCC stage was 0.0003
bThe P value comparing 6th and 7th AJCC stage was 0.5187
cThe P value comparing 6th and 7th AJCC stage was 0.0006
dThe P value comparing 6th and 7th AJCC stage was 0.3709
Second, as depicted by the Kaplan–Meier curves, the ability of the AJCC7 stages to discriminate CSS and OS was mediocre in both the training (Fig. 6a) and external cohorts (Fig. 7). However, the Nomo stages performed consistently much better in all cohorts (Figs. 6a and 7). Further analysis in the training (Fig. 6b and c) and test cohorts (Fig. 8) showed that the nomograms were also able to stratify each AJCC7 stage into three significant prognostic groups with low, medium, and high risks of CSS and OS, respectively. Additional elaborations on the 5-year cumulative survival (Table 8) and hazard ratios (Table 9) of the Nomo stages as well as the stratified risk groups (Table 10) confirmed robust utility of nomograms in both risk classification and stratification.
Fig. 6.
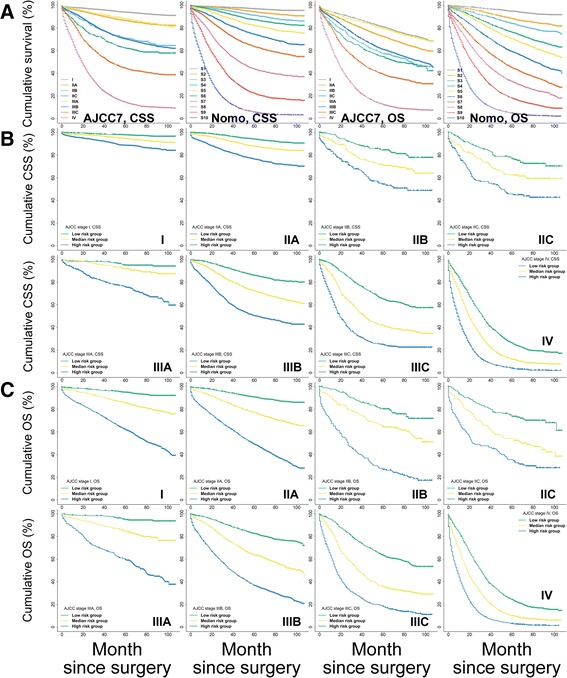
Kaplan–Meier curve analysis of risk classification and stratification in the training cohort. a Risk classification of CSS and OS using the 7th edition of the AJCC stages (AJCC7) and Nomo stages (all log-rank P values for trend <0.0001). b Risk stratification of CSS for each AJCC7 substage. c Risk stratification of OS for each AJCC7 substage (all log-rank P values for trend <0.0001, all log-rank P values for pairwise comparisons <0.05). CSS, cancer-specific survival; OS, overall survival; AJCC, American Joint Committee on Cancer
Fig. 7.
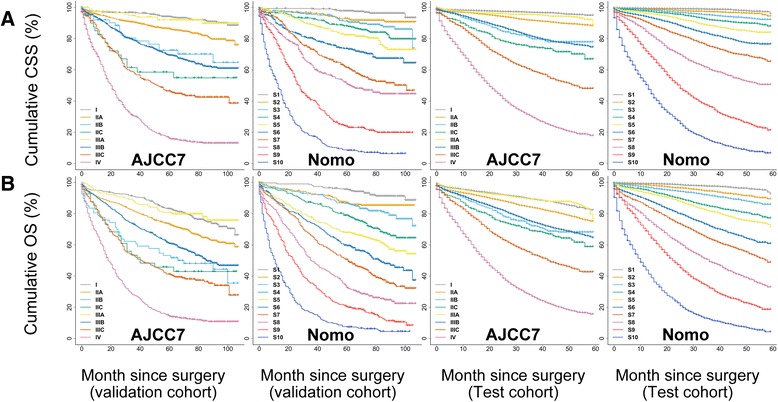
Kaplan–Meier curve analysis for risk classification of (a) CSS and (b) OS in the validation and test cohorts. All log-rank P values for trend <0.0001. CSS, cancer-specific survival; OS, overall survival
Fig. 8.
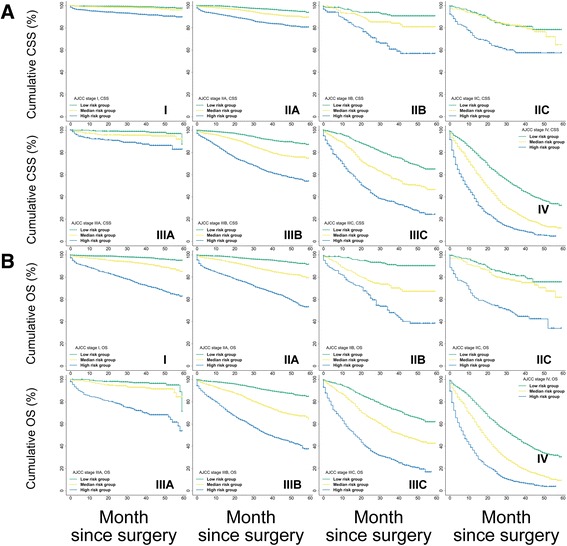
Kaplan–Meier curve analysis for risk stratification of (a) CSS and (b) OS within each AJCC substage using the test cohort. All log-rank P values for trend <0.0001. CSS, cancer-specific survival; OS, overall survival
Table 8.
Cumulative survival for Nomo stages in derivation and external validation cohorts
| Training cohort | Validation cohort | Test cohort | ||||||||||
|---|---|---|---|---|---|---|---|---|---|---|---|---|
| (Cumulative survival, 60 months, %) | (Cumulative survival, 60 months, %) | (Cumulative survival, 59 months, %) | ||||||||||
| Nomo stage | CSS | 95 % CI | OS | 95 % CI | CSS | 95 % CI | OS | 95 % CI | CSS | 95 % CI | OS | 95 % CI |
| Nomo 1 | 96.8 | 96.1–97.4 | 94.6 | 93.7–95.4 | 97.7 | 96.1–99.4 | 95.5 | 93.2–97.8 | 94.3 | 88.7–99.8 | 90.8 | 85.5–96.1 |
| Nomo 2 | 94.0 | 93.1–95.0 | 88.1 | 86.9–89.3 | 92.9 | 90.0–95.8 | 87.1 | 83.4–90.9 | 94.0 | 91.5–96.6 | 89.0 | 86.5–91.4 |
| Nomo 3 | 90.9 | 89.8–92.0 | 83.7 | 82.4–85.1 | 91.2 | 88.0–94.4 | 86.6 | 82.8–90.3 | 92.1 | 90.5–93.6 | 85.5 | 83.4–87.7 |
| Nomo 4 | 87.1 | 85.8–88.4 | 76.1 | 74.5–77.7 | 88.1 | 84.4–91.7 | 78.9 | 74.4–83.4 | 87.4 | 84.5–90.3 | 76.5 | 73.5–79.5 |
| Nomo 5 | 82.0 | 80.4–83.5 | 70.3 | 68.6–72.0 | 82.3 | 77.9–86.7 | 67.8 | 62.6–73.0 | 83.7 | 81.8–85.7 | 69.1 | 62.1–76.1 |
| Nomo 6 | 74.2 | 72.4–75.9 | 59.0 | 57.2–60.9 | 73.6 | 68.5–78.7 | 59.4 | 54.0–64.8 | 76.1 | 73.9–78.4 | 60.1 | 56.9–63.3 |
| Nomo 7 | 63.3 | 61.4–65.2 | 44.8 | 42.9–46.7 | 61.3 | 55.6–67.0 | 50.6 | 45.1–56.1 | 64.4 | 60.3–68.6 | 47.4 | 43.3–51.5 |
| Nomo 8 | 43.6 | 41.6–45.6 | 32.6 | 30.9–34.4 | 50.8 | 44.8–56.8 | 32.7 | 27.5–37.9 | 49.9 | 46.9–53.0 | 31.8 | 27.9–35.7 |
| Nomo 9 | 22.1 | 20.4–23.7 | 18.0 | 16.5–19.4 | 23.9 | 18.8–29.0 | 20.2 | 15.8–24.7 | 20.2 | 16.0–24.4 | 17.8 | 15.0–20.6 |
| Nomo 10 | 5.7 | 4.7–6.6 | 4.8 | 4.0–5.6 | 8.4 | 5.2–11.6 | 7.3 | 4.5–10.2 | 6.3 | 3.9–8.6 | 3.8 | 1.3–6.3 |
| P log-rank for trend | <0.0001 | <0.0001 | <0.0001 | <0.0001 | <0.0001 | <0.0001 | ||||||
CSS cancer-specific survival, OS overall survival, Nomo Nomo stages
Table 9.
Relative hazard for Nomo stages in derivation and external validation cohorts
| Training cohort | Validation cohort | Test cohort | ||||||||
|---|---|---|---|---|---|---|---|---|---|---|
| Nomo stages | Cut-off Points | HR | 95 % CI | P | HR | 95 % CI | P | HR | 95 % CI | P |
| Cancer-specific survival | ||||||||||
| Nomo 1 | ≤82.0 | ref | ref | ref | ||||||
| Nomo 2 | ≤106.2 | 1.86 | 1.48–2.35 | <0.0001 | 2.40 | 1.19–4.84 | 0.0147 | 1.92 | 1.37–2.70 | 0.0002 |
| Nomo 3 | ≤122.9 | 2.86 | 2.30–3.55 | <0.0001 | 3.33 | 1.70–6.51 | 0.0004 | 3.38 | 2.48–4.62 | <0.0001 |
| Nomo 4 | ≤138.2 | 3.91 | 3.17–4.82 | <0.0001 | 4.83 | 2.54–9.22 | <0.0001 | 5.13 | 3.81–6.91 | <0.0001 |
| Nomo 5 | ≤153.0 | 5.58 | 4.55–6.84 | <0.0001 | 6.60 | 3.50–12.42 | <0.0001 | 7.87 | 5.89–10.51 | <0.0001 |
| Nomo 6 | ≤170.7 | 8.47 | 6.95–10.33 | <0.0001 | 10.41 | 5.60–19.32 | <0.0001 | 12.17 | 9.19–16.13 | <0.0001 |
| Nomo 7 | ≤192.2 | 12.46 | 10.25–15.14 | <0.0001 | 16.23 | 8.84–29.81 | <0.0001 | 18.39 | 13.91–24.3 | <0.0001 |
| Nomo 8 | ≤225.6 | 22.40 | 18.49–27.13 | <0.0001 | 21.11 | 11.53–38.67 | <0.0001 | 32.19 | 24.47–42.34 | <0.0001 |
| Nomo 9 | ≤272.1 | 40.47 | 33.46–48.94 | <0.0001 | 42.87 | 23.56–78.00 | <0.0001 | 65.32 | 49.79–85.68 | <0.0001 |
| Nomo 10 | 272.1+ | 83.31 | 68.9–100.73 | <0.0001 | 86.07 | 47.39–156.31 | <0.0001 | 127.46 | 97.2–167.12 | <0.0001 |
| Overall survival | ||||||||||
| Nomo 1 | ≤57.2 | ref | ref | ref | ||||||
| Nomo 2 | ≤70.0 | 2.16 | 1.83–2.56 | <0.0001 | 1.96 | 1.19–3.22 | 0.0078 | 2.13 | 1.68–2.70 | <0.0001 |
| Nomo 3 | ≤80.8 | 3.04 | 2.59–3.58 | <0.0001 | 2.63 | 1.64–4.21 | 0.0001 | 3.12 | 2.49–3.92 | <0.0001 |
| Nomo 4 | ≤90.7 | 4.76 | 4.08–5.56 | <0.0001 | 4.28 | 2.73–6.71 | <0.0001 | 5.55 | 4.48–6.87 | <0.0001 |
| Nomo 5 | ≤101.6 | 6.12 | 5.26–7.12 | <0.0001 | 6.17 | 3.99–9.55 | <0.0001 | 6.90 | 5.59–8.52 | <0.0001 |
| Nomo 6 | ≤114.2 | 9.01 | 7.76–10.45 | <0.0001 | 8.41 | 5.47–12.92 | <0.0001 | 11.11 | 9.06–13.63 | <0.0001 |
| Nomo 7 | ≤129.1 | 13.46 | 11.62–15.58 | <0.0001 | 11.25 | 7.36–17.19 | <0.0001 | 15.23 | 12.45–18.62 | <0.0001 |
| Nomo 8 | ≤147.1 | 18.68 | 16.15–21.61 | <0.0001 | 16.81 | 11.04–25.61 | <0.0001 | 24.23 | 19.85–29.57 | <0.0001 |
| Nomo 9 | ≤171.8 | 28.44 | 24.61–32.88 | <0.0001 | 25.47 | 16.76–38.68 | <0.0001 | 37.66 | 30.91–45.89 | <0.0001 |
| Nomo 10 | 171.8+ | 55.25 | 47.8–63.86 | <0.0001 | 45.27 | 29.80–68.76 | <0.0001 | 75.07 | 61.63–91.45 | <0.0001 |
HR hazard ratio, 95 % CI 95 % confident interval
Table 10.
Risk stratifications for each AJCC substage in training and test cohorts
| Training cohort | Test cohort | |||||||
|---|---|---|---|---|---|---|---|---|
| AJCC stages | Cut-off Points | Cumulative Survival, 60 months, % | HR | 95 % CI | Pairwise P log-rank | HR | 95 % CI | Pairwise P log-rank |
| Cancer-specific survival | ||||||||
| Stage I | ||||||||
| Low risk group (L) | ≤70.0 | 97.7 | ref | L v M < 0.0001 | ref | L v M < 0.0205 | ||
| Median risk group (M) | ≤97.2 | 94.4 | 2.44 | 1.91–3.13 | L v H < 0.0001 | 1.75 | 1.24–2.45 | L v H < 0.0001 |
| High risk group (H) | 97.2+ | 88.4 | 4.73 | 3.66–6.12 | M v H < 0.0001 | 6.12 | 4.27–8.77 | M v H < 0.0001 |
| Stage IIA | ||||||||
| Low risk group (L) | ≤122.7 | 93.9 | ref | L v M < 0.0001 | ref | L v M < 0.0001 | ||
| Median risk group (M) | ≤149.4 | 87.7 | 1.90 | 1.64–2.19 | L v H < 0.0001 | 2.11 | 1.4–2.58 | L v H < 0.0001 |
| High risk group (H) | 149.4+ | 76.2 | 3.96 | 3.41–4.61 | M v H < 0.0001 | 4.66 | 3.80–5.72 | M v H < 0.0001 |
| Stage IIB | ||||||||
| Low risk group (L) | ≤151.2 | 84.4 | ref | L v M = 0.0046 | ref | L v M = 0.0220 | ||
| Median risk group (M) | ≤178.4 | 71.1 | 1.84 | 1.28–2.64 | L v H < 0.0001 | 2.09 | 1.29–3.39 | L v H < 0.0001 |
| High risk group (H) | 178.4+ | 54.1 | 3.30 | 2.22–4.90 | M v H < 0.0012 | 5.27 | 3.16–8.81 | M v H < 0.0001 |
| Stage IIC | ||||||||
| Low risk group (L) | ≤158.0 | 76.7 | ref | L v M = 0.0121 | ref | L v M = 0.6571 | ||
| Median risk group (M) | ≤181.8 | 62.3 | 1.64 | 1.16–2.31 | L v H < 0.0001 | 1.12 | 0.72–1.74 | L v H < 0.0001 |
| High risk group (H) | 181.8+ | 45.6 | 2.79 | 1.93–2.03 | M v H < 0.0020 | 2.73 | 1.68–4.42 | M v H < 0.0001 |
| Stage IIIA | ||||||||
| Low risk group (L) | ≤88.9 | 94.8 | ref | L v M = 0.0116 | ref | L v M < 0.0210 | ||
| Median risk group (M) | ≤120.2 | 91.6 | 2.04 | 1.39–2.99 | L v H < 0.0001 | 2.51 | 1.36–4.63 | L v H < 0.0001 |
| High risk group (H) | 120.2+ | 75.6 | 6.84 | 4.57–10.24 | M v H < 0.0001 | 6.54 | 3.20–13.35 | M v H = 0.0015 |
| Stage IIIB | ||||||||
| Low risk group (L) | ≤147.6 | 85.9 | ref | L v M < 0.0001 | ref | L v M < 0.0001 | ||
| Median risk group (M) | ≤180.3 | 72.1 | 2.09 | 1.89–2.32 | L v H < 0.0001 | 2.35 | 2.04–2.70 | L v H < 0.0001 |
| High risk group (H) | 180.3+ | 50.1 | 4.25 | 3.80–4.76 | M v H < 0.0001 | 5.34 | 4.55–2.67 | M v H < 0.0001 |
| Stage IIIC | ||||||||
| Low risk group (L) | ≤187.2 | 65.1 | ref | L v M < 0.0001 | ref | L v M < 0.0001 | ||
| Median risk group (M) | ≤218.0 | 41.6 | 1.99 | 1.74–2.27 | L v H < 0.0001 | 2.01 | 1.72–2.36 | L v H < 0.0001 |
| High risk group (H) | 218.0+ | 24.8 | 3.49 | 3.01–4.04 | M v H < 0.0001 | 4.05 | 3.39–4.84 | M v H < 0.0001 |
| Stage IV | ||||||||
| Low risk group (L) | ≤255.6 | 26.2 | ref | L v M < 0.0001 | ref | L v M < 0.0001 | ||
| Median risk group (M) | ≤292.1 | 12.0 | 1.56 | 1.46–1.67 | L v H < 0.0001 | 1.85 | 1.70–2.01 | L v H < 0.0001 |
| High risk group (H) | 292.1+ | 4.0 | 2.78 | 2.57–3.01 | M v H < 0.0001 | 3.34 | 3.20–3.70 | M v H < 0.0001 |
| Overall survival | ||||||||
| Stage I | ||||||||
| Low risk group (L) | ≤55.1 | 94.6 | ref | L v M < 0.0001 | ref | L v M < 0.0001 | ||
| Median risk group (M) | ≤79.9 | 84.5 | 2.94 | 2.58–3.35 | L v H < 0.0001 | 3.10 | 2.58–3.72 | L v H < 0.0001 |
| High risk group (H) | 79.9+ | 63.1 | 9.07 | 7.90–10.41 | M v H < 0.0001 | 10.70 | 8.80–13.01 | M v H < 0.0001 |
| Stage IIA | ||||||||
| Low risk group (L) | ≤75.9 | 90.6 | ref | L v M < 0.0001 | ref | L v M < 0.0001 | ||
| Median risk group (M) | ≤101.4 | 77.0 | 2.66 | 2.42–2.91 | L v H < 0.0001 | 2.86 | 2.50–3.28 | L v H < 0.0001 |
| High risk group (H) | 101.4+ | 49.1 | 7.38 | 6.68–8.15 | M v H < 0.0001 | 7.80 | 6.77–8.97 | M v H < 0.0001 |
| Stage IIB | ||||||||
| Low risk group (L) | ≤93.5 | 80.3 | ref | L v M = 0.0007 | ref | L v M < 0.0001 | ||
| Median risk group (M) | ≤120.4 | 64.7 | 1.86 | 1.40–2.45 | L v H < 0.0001 | 3.86 | 2.60–5.72 | L v H < 0.0001 |
| High risk group (H) | 120.4+ | 26.8 | 5.48 | 4.00–7.49 | M v H < 0.0001 | 8.03 | 5.27–12.22 | M v H < 0.0001 |
| Stage IIC | ||||||||
| Low risk group (L) | ≤96.9 | 73.6 | ref | L v M < 0.0001 | ref | L v M = 0.2111 | ||
| Median risk group (M) | ≤121.9 | 54.4 | 2.09 | 1.56–2.80 | L v H < 0.0001 | 1.35 | 0.92–1.98 | L v H < 0.0001 |
| High risk group (H) | 121.9+ | 35.5 | 3.54 | 2.58–4.86 | M v H = 0.0002 | 3.81 | 2.46–5.91 | M v H < 0.0001 |
| Stage IIIA | ||||||||
| Low risk group (L) | ≤60.0 | 94.6 | ref | L v M < 0.0001 | ref | L v M < 0.0316 | ||
| Median risk group (M) | ≤90.4 | 84.3 | 3.67 | 2.76–4.87 | L v H < 0.0001 | 2.10 | 1.36–3.25 | L v H < 0.0001 |
| High risk group (H) | 90.4+ | 59.4 | 11.71 | 8.66–15.84 | M v H < 0.0001 | 9.07 | 5.70–14.45 | M v H < 0.0001 |
| Stage IIIB | ||||||||
| Low risk group (L) | ≤91.0 | 82.3 | ref | L v M < 0.0001 | ref | L v M < 0.0001 | ||
| Median risk group (M) | ≤116.9 | 63.7 | 2.28 | 2.09–2.48 | L v H < 0.0001 | 2.72 | 2.42–3.07 | L v H < 0.0001 |
| High risk group (H) | 116.9+ | 36.6 | 5.06 | 4.60–5.56 | M v H < 0.0001 | 6.55 | 5.75–7.47 | M v H < 0.0001 |
| Stage IIIC | ||||||||
| Low risk group (L) | ≤110.6 | 63.3 | ref | L v M < 0.0001 | ref | L v M < 0.0001 | ||
| Median risk group (M) | ≤137.0 | 35.7 | 2.10 | 1.86–2.37 | L v H < 0.0001 | 1.94 | 1.68–2.24 | L v H < 0.0001 |
| High risk group (H) | 137.0+ | 18.2 | 3.97 | 3.47–4.55 | M v H < 0.0001 | 4.33 | 3.68–5.11 | M v H < 0.0001 |
| Stage IV | ||||||||
| Low risk group (L) | ≤157.2 | 24.2 | ref | L v M < 0.0001 | ref | L v M < 0.0001 | ||
| Median risk group (M) | ≤183.3 | 9.9 | 1.59 | 1.49–1.69 | L v H < 0.0001 | 1.87 | 1.73–2.03 | L v H < 0.0001 |
| High risk group (H) | 183.3+ | 3.0 | 2.79 | 2.58–3.01 | M v H < 0.0001 | 3.51 | 3.19–3.88 | M v H < 0.0001 |
AJCC American joint committee on cancer, HR hazard ratio, 95 % CI 95 % confident interval, L low risk group, M median risk group, H high risk group
Finally, the mosaic plots demonstrated significant survival heterogeneity within individual AJCC7 substages in contrast to the Nomo stages (Fig. 9). The results offer direct evidence and the underlying frequencies of staging errors in the conventional AJCC staging system.
Fig. 9.
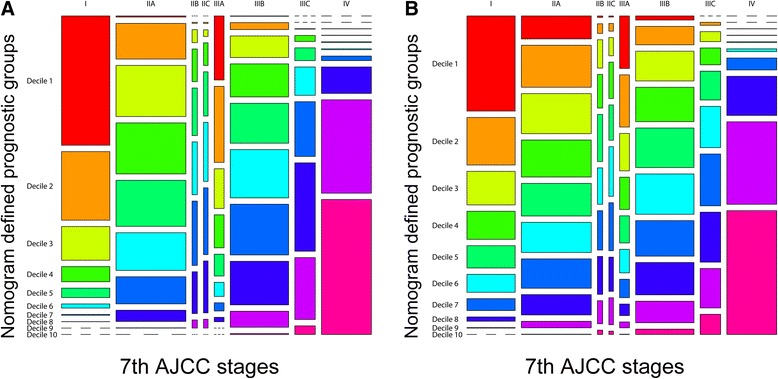
Mosaic plots using the training cohort. a CSS, b OS. In the mosaic plots, each of the 10 deciles is represented by 1 of 10 consecutive rainbow colors. The area of the individual mosaics represents the relative frequency associated with the column cell. The short segmented lines indicate a frequency of zero. CSS, cancer-specific survival; OS, overall survival; AJCC, American Joint Committee on Cancer
Decision curve analysis
After addressing the model accuracy, DCA was applied to render clinical validity to the nomograms in the derivation cohort and generalize it to the external cohorts. The results corroborated good clinical applicability of the nomograms in predicting survival of patients with CRC because their ranges of threshold probabilities were wide and practical in all cohorts (Fig. 10). Additional comparisons of model competence were also in favor of the nomograms’ superiority over the conventional AJCC stages because the net benefit for the patients was consistently enhanced (higher lines for model prediction relative to the horizontal lines) when using the nomograms compared with using the TNM stages (Fig. 10).
Fig. 10.
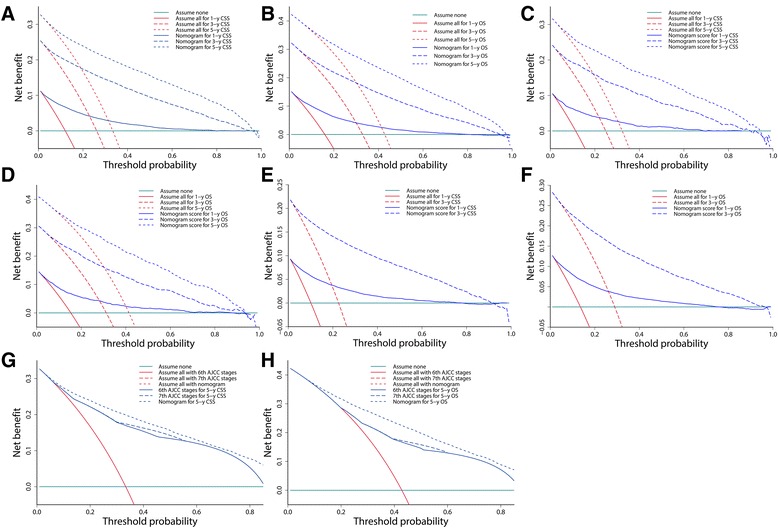
Decision curve analysis of nomograms in different cohorts and model comparisons with AJCC stages. a One-, 3-, and 5-year CSS in the training cohort. b One-, 3-, and 5-year OS in the training cohort. c One-, 3-, and 5-year CSS in the validation cohort. d One-, 3-, and 5-year OS in the validation cohort. e One- and 3-year CSS in the test cohort. f One- and 3-year OS in the test cohort. g Nomogram comparisons of the 6th and 7th versions of the AJCC stages for predicting 5-year CSS in the training cohort. h Nomogram comparisons of the 6th and 7th versions of the AJCC stages for predicting 5-year OS in the training cohort. Cyan horizontal lines represent the assumption that events occurred in no patient within a particular timespan. Red lines represent the assumption that events occurred in all patients within the same timespan. Blue lines represent the net benefit of model prediction. The net benefit per patient of each predictive model within a particular timespan was a function of the cohort size with threshold probability, and was computed by addition of the benefit (true positive) and subtraction of the harm (false positive). g, h Note that the red “assume all” lines overlap and appear to be a single line for both the nomogram and the 6th- and 7th-version AJCC stages prediction. This occurred because they were constructed using the same cohorts and time points. CSS, cancer-specific survival; OS, overall survival; AJCC, American Joint Committee on Cancer
Discussion
In the present study, we developed two postoperative nomograms to predict CSS and OS for patients who have undergone CRC resection without neoadjuvant therapy. The nomograms consistently achieved considerable predictive accuracy and appreciable reliability and reproducibility when applied to the derivation and validation cohorts. DCA subsequently demonstrated significant clinical applicability of the nomograms with wide threshold probabilities. In addition, model comparisons and DCA proved that the nomograms outperformed the conventional AJCC stages by stratifying them into three significant prognostic groups and allowing for more robust risk classification (Nomo stages) with an improved net benefit.
Prognostic nomograms are simplified representations of complicated statistical models with elegant graphics [18, 29, 30]. Compared with other predictive models, they are more accurate and comprehensible with user-friendly interfaces, allowing for wide application in clinical practice [18, 29, 30]. A recent systematic review summarized the basic characteristics of more than 16 predictive nomograms for CRC [31]. Although patient definitions, endpoints, and time points are markedly heterogeneous, most of the nomograms have demonstrated improved accuracy. Our study shows some distinctions from those published nomograms, however.
First, no previous studies incorporated both patients with non-metastatic CRC and those with metastatic CRC. Because both non-metastatic and metastatic CRC are continuous representations of systemic tumor biology, exclusion of patients with metastasis may inherit the limitations of the AJCC stages. Second, we used population-based data to derive nomograms for CRC; this may be considered an update and extension of a previously published nomogram that also used SEER data but concentrated on curative stage I to III colonic adenocarcinomas [32]. Population-based data often fail to include detailed data and novel markers such as the CEA concentration [19] and microRNAs [33], which may be helpful to increase model accuracy. However, population-based data are more likely to overcome inconsistency biased by institutional practice [18]. Third, we selected covariates based on the AIC instead of statistical significance (P value), allowing for confidence in the robustness of modeling and performance [34]. The P values depend not only on the magnitude of the predictors’ effects but also on the sample size. Small data sets are less likely to discriminate small differences, and their use makes it more difficult to reject the null hypothesis. We also used restricted cubic spline functions for continuous variables to avoid unnecessary information loss caused by categorization [23]. Finally, we introduced DCA and proved the clinical validity of our nomograms. High predictive accuracy is not necessarily associated with usefulness in clinical practice. Well-performing models may have limited applicability if the threshold probabilities of the net benefits are impractical, meaning that the new predictive models will be less beneficial than currently available tools and may even be harmful [18, 26].
Our study also produced some novel findings besides the many results consistent with previous studies. Above all, based on the nomograms, we have proposed Nomo stages and efficiently classified stage I to IV CRCs into 10 significant subgroups with a single predictive score. Our nomograms also enable stratification of each AJCC7 substage into three significant risk strata, which has not been achieved by other CRC nomograms. This risk classification and stratification may be very useful for clinicians to identify postoperative patients with high risks associated with intensified follow-up (i.e., patients with high-risk stage I CRC) and select less heterogeneous patients for clinical trials (i.e., patients with high-risk stage II CRC). This also helps to understand the degree of survival heterogeneity in the AJCC stages, which frequently introduces confusion and uncertainty to patient consulting. Note that the optimal thresholds for risk classification and stratification may be individualized, although the thresholds defined by the training cohort still worked well in our external cohorts, which are only intended for relatively strict validation. Additionally and importantly, the sharing of similar contributing predictors is a reflection of apparent correlations between CSS and OS. Some of these predictors are worth noting here. In our models, age had a persistent effect but multiplied from beyond 60 years old. Age is a traditional reference for physical condition, frequency and efficiency of reinforced therapies, thus exerts an accumulated effect on survival. It is reasonable to presume that certain tumor-related factors such as infiltration depth, metastasis, histology, LNR, and LNC are relatively more important predictors than age. They are typical features of tumor development and are closely related to patient death at various but statistically significant levels. The LNC is one of the most controversial among these tumor-related factors. It has been proposed as a quality indicator [6, 35] and is augmented in extended lymphadenectomy, the relevant long-term benefit of which has not been effectively demonstrated because of the absence of prospective clinical trials of extended colonic surgeries [35, 36]. Inadequate LNC assessment is involved in interpretation of stage migration, which is considered a source of survival heterogeneity in patients with CRC, but its influences are limited [14, 35, 36]. Several previous studies classified patients by the 12-node benchmark to derive high- and low-risk subpopulations but achieved inconsistent results, while our results indicate that such classification might be associated with a risk of dichotomizing complex, non-linear effects of LNC on patient survival [37]. Moreover, our analyses indicated that LNC was less superior to LNR, which explains the reduced survival in the patient subset with limited numbers of metastatic nodes. Additionally, the preoperative CEA concentration provides a baseline quantification of the tumor burden and severity of disease. The CEA concentration, with its individualized information and wide application, is due to play a role in the staging of CRC. Next, the effects of racial background may be multifactorial. The lowest prevalence and mortality of CRC are seen in East Asians because of the low prevalence of risk factors such as smoking and obesity in this population [1, 2]. The highest incidence and mortality are seen in black people [2]; this can be ascribed to the lower income, later diagnosis, and less access to high-quality health care in this population [2, 20]. Additionally, marriage makes a prognostic difference [20] and deserves more attention because it may provide compensative mechanisms for improvements in survival. Marital status and ethnicity were introduced to prognostic nomograms for CRC for the first time in the present study. It should also be noted that the nomogram points translated from the models’ coefficients reflect the importance of the variables relative to the presence of the other covariates. They may vary depending on the outcomes measured. Due to the existence of competing risks, the predictive accuracy for OS tended to be lower than that for CSS in our study. However, we chose a Cox proportional hazard model without competing risks because it was easier to interpret, compare, and comprehend [38].
Our study has limitations that deserve attention. Improved model accuracy frequently comes at the cost of increased complexity. The tradeoffs between comprehensiveness and comprehensibility are not easy to balance, and this is a common problem during modeling for nomograms. Considering this, we only selected variables that were clinically important and practical with high reproducibility and low time-varying effects. The nomogram itself is associated with uncertainty. Therefore, we provided 95 % CIs for the c-indexes and calibrations to determine the degree of uncertainty. Because of the shorter follow-up, the c-indexes were slightly higher in the test cohort than in the derivation cohort. However, the time-dependent ROC showed that the predictive AUCs of the nomograms in different cohorts were very close in the same years. Moreover, our nomograms were developed for risk assessment and selection of patients who might benefit from additional interventions after surgery. These interventions may include but are not restricted to adjuvant therapies, strengthened treatments, intensified follow-ups, and motivated patient consulting. Even so, nomograms cannot substitute for clinicians’ judgments or act as exclusive evidence for clinical decision-making. Finally, details regarding tumor deposit, curability of stage IV CRC, and postoperative chemoradiotherapy among the patients in the present study are unknown, placing a limitation on the survival analysis. Incorporation of the new predictors and introduction of competing risk models may further improve model performance [18, 29]. However, this will require new nomograms with different modeling strategies.
Conclusions
In the present study, the bootstrap-corrected and prospectively validated nomograms were consistently reliable and clinically practical with wide threshold probabilities. Moreover, the nomograms outperformed the conventional AJCC stages by allowing for more robust risk classification and stratifying the AJCC stages with an improved net benefit. However, independent external validations are still required in the future.
Acknowledgements
We thank Dr Cathy Chen and Dr Anthony Lodge for their suggestions with manuscript editing.
Funding
This study was supported by grants from the Shanghai Science Committee Foundation (no. 34119b0600; no. 16411970800), Shanghai Municipal Health Bureau (no. 20134194), Jiaxing Science Committee Foundation of Zhejiang province (no. 2015AY23071) and the Technology Plan Project of Medicine and Health in Zhejiang Province (no. 2016KYB295).
Availability of data and materials
The cohort data are available to researchers and should be requested under the approval of the SEER Program administration. The other datasets supporting the conclusions of this article are included within the article.
Authors’ contributions
Study conception and design: HYG; acquisition of data: ZYZ, QFL, XWY, ZLD, SB, HYG; analyses and interpretation of data: ZYZ, QFL, XWY, ZLD, SB, HYG; all authors have read and approved the final version of the manuscript.
Competing interests
The authors have that they have no competing interests.
Consent for publication
Not applicable.
Ethics approval and consent to participate
Because the patients in the SEER database could not be identified, the analysis and reporting of the data in our study were exempt from review by the Ethics Board of Shanghai East Hospital. The requirement for written informed consent to participate was waived. We were permitted to have Internet access after our signed data-use agreement (http://seer.cancer.gov/data/sample-dua.html) was approved by the SEER administration.
Abbreviations
- AIC
akaike information criterion
- AJCC
American joint committee on cancer
- AUC
area under the receiver-operating characteristic curve
- CEA
carcinoembryonic antigen
- CI
confident interval
- CRC
colorectal cancer
- CSS
cancer-specific survival
- DCA
decision curve analysis
- LNC
lymph node count
- LNR
lymph node ratio
- OS
overall survival
- ROC
receiver-operating characteristic
- SEER
surveillance, epidemiology, and end results
Contributor Information
Zhen-yu Zhang, Email: zhangsurgery@qq.com.
Qi-feng Luo, Email: luoqifeng001@163.com.
Xiao-wei Yin, Email: hjw850604@126.com.
Zhen-ling Dai, Email: dzl0702@sina.com.
Shiva Basnet, Email: altruist012@163.com.
Hai-yan Ge, Phone: +86 21 38804518, Email: gesurgery@163.com.
References
- 1.Torre LA, Bray F, Siegel RL, Ferlay J, Lortet-Tieulent J, Jemal A. Global cancer statistics, 2012. CA Cancer J Clin. 2015;65:87–108. doi: 10.3322/caac.21262. [DOI] [PubMed] [Google Scholar]
- 2.Siegel RL, Miller KD, Jemal A. Cancer statistics, 2016. CA Cancer J Clin. 2016;66:7–30. doi: 10.3322/caac.21332. [DOI] [PubMed] [Google Scholar]
- 3.Brenner H, Kloor M, Pox CP. Colorectal cancer. Lancet. 2014;383:1490–1502. doi: 10.1016/S0140-6736(13)61649-9. [DOI] [PubMed] [Google Scholar]
- 4.Schmoll HJ, Van Cutsem E, Stein A, Valentini V, Glimelius B, Haustermans K, et al. ESMO Consensus Guidelines for management of patients with colon and rectal cancer. a personalized approach to clinical decision making. Ann Oncol. 2012;23:2479–2516. doi: 10.1093/annonc/mds236. [DOI] [PubMed] [Google Scholar]
- 5.National Comprehensive Cancer Network. NCCN Clinical Practice Guidelines in Oncology: Colon Cancer. V.2.2016, 2016. https://www.nccn.org/professionals/physician_gls/pdf/colon.pdf. Accessed 31 May 2016.
- 6.Nagtegaal ID. Current concepts of colorectal cancer resection pathology. Histopathology. 2015;66:102–111. doi: 10.1111/his.12563. [DOI] [PubMed] [Google Scholar]
- 7.Edge SB, Compton CC. The American Joint Committee on Cancer: the 7th edition of the AJCC cancer staging manual and the future of TNM. Ann Surg Oncol. 2010;17:1471–1474. doi: 10.1245/s10434-010-0985-4. [DOI] [PubMed] [Google Scholar]
- 8.Hyslop T, Weinberg DS, Schulz S, Barkun A, Waldman SA. Occult tumor burden predicts disease recurrence in lymph node-negative colorectal cancer. Clin Cancer Res. 2011;17:3293–3303. doi: 10.1158/1078-0432.CCR-10-3113. [DOI] [PMC free article] [PubMed] [Google Scholar]
- 9.Benson AB, 3rd, Hamilton SR. Path toward prognostication and prediction: an evolving matrix. J Clin Oncol. 2011;29:4599–4601. doi: 10.1200/JCO.2011.37.8646. [DOI] [PubMed] [Google Scholar]
- 10.O'Connor ES, Greenblatt DY, LoConte NK, Gangnon RE, Liou JI, Heise CP, et al. Adjuvant chemotherapy for stage II colon cancer with poor prognostic features. J Clin Oncol. 2011;29:3381–3388. doi: 10.1200/JCO.2010.34.3426. [DOI] [PMC free article] [PubMed] [Google Scholar]
- 11.Andre T, Boni C, Navarro M, Tabernero J, Hickish T, Topham C, et al. Improved overall survival with Oxaliplatin, fluorouracil, and leucovorin as adjuvant treatment in stage II or III colon cancer in the MOSAIC trial. J Clin Oncol. 2009;27:3109–3116. doi: 10.1200/JCO.2008.20.6771. [DOI] [PubMed] [Google Scholar]
- 12.Tougeron D, Mouillet G, Trouilloud I, Lecomte T, Coriat R, Aparicio T, et al. Efficacy of Adjuvant Chemotherapy in Colon Cancer With Microsatellite Instability: A Large Multicenter AGEO Study. J Natl Cancer Inst. 2016;108(7): doi:10.1093/jnci/djv438. [DOI] [PubMed]
- 13.O'Connell JB, Maggard MA, Ko CY. Colon cancer survival rates with the new American Joint Committee on Cancer sixth edition staging. J Natl Cancer Inst. 2004;96:1420–1425. doi: 10.1093/jnci/djh275. [DOI] [PubMed] [Google Scholar]
- 14.Hari DM, Leung AM, Lee JH, Sim MS, Vuong B, Chiu CG, et al. AJCC Cancer Staging Manual 7th edition criteria for colon cancer: do the complex modifications improve prognostic assessment? J Am Coll Surg. 2013;217:181–190. doi: 10.1016/j.jamcollsurg.2013.04.018. [DOI] [PMC free article] [PubMed] [Google Scholar]
- 15.Kawai K, Ishihara S, Yamaguchi H, Sunami E, Kitayama J, Miyata H, et al. Nomograms for predicting the prognosis of stage IV colorectal cancer after curative resection: a multicenter retrospective study. Eur J Surg Oncol. 2015;41:457–465. doi: 10.1016/j.ejso.2015.01.026. [DOI] [PubMed] [Google Scholar]
- 16.Beppu T, Sakamoto Y, Hasegawa K, Honda G, Tanaka K, Kotera Y, et al. A nomogram predicting disease-free survival in patients with colorectal liver metastases treated with hepatic resection: multicenter data collection as a Project Study for Hepatic Surgery of the Japanese Society of Hepato-Biliary-Pancreatic Surgery. J Hepatobiliary Pancreat Sci. 2012;19:72–84. doi: 10.1007/s00534-011-0460-z. [DOI] [PubMed] [Google Scholar]
- 17.Franko J, Shi Q, Goldman CD, Pockaj BA, Nelson GD, Goldberg RM, et al. Treatment of colorectal peritoneal carcinomatosis with systemic chemotherapy: a pooled analysis of north central cancer treatment group phase III trials N9741 and N9841. J Clin Oncol. 2012;30:263–267. doi: 10.1200/JCO.2011.37.1039. [DOI] [PMC free article] [PubMed] [Google Scholar]
- 18.Balachandran VP, Gonen M, Smith JJ, DeMatteo RP. Nomograms in oncology: more than meets the eye. Lancet Oncol. 2015;16:e173–180. doi: 10.1016/S1470-2045(14)71116-7. [DOI] [PMC free article] [PubMed] [Google Scholar]
- 19.Weiser MR, Landmann RG, Kattan MW, Gonen M, Shia J, Chou J, et al. Individualized prediction of colon cancer recurrence using a nomogram. J Clin Oncol. 2008;26:380–385. doi: 10.1200/JCO.2007.14.1291. [DOI] [PubMed] [Google Scholar]
- 20.Amri R, Stronks K, Bordeianou LG, Sylla P, Berger DL. Gender and ethnic disparities in colon cancer presentation and outcomes in a US universal health care setting. J Surg Oncol. 2014;109:645–651. doi: 10.1002/jso.23567. [DOI] [PubMed] [Google Scholar]
- 21.Wang L, Wilson SE, Stewart DB, Hollenbeak CS. Marital status and colon cancer outcomes in US Surveillance, Epidemiology and End Results registries: does marriage affect cancer survival by gender and stage? Cancer Epidemiol. 2011;35:417–422. doi: 10.1016/j.canep.2011.02.004. [DOI] [PubMed] [Google Scholar]
- 22.Surveillance, Epidemiology, and End Results (SEER) Program SEER*Stat Database: Incidence - SEER 9 Regs Research Data, Nov 2014 Sub (1973–2012) < Katrina/Rita Population Adjustment > − Linked To County Attributes - Total U.S., 1969–2013 Counties, National Cancer Institute, DCCPS, Surveillance Research Program, Surveillance Systems Branch, released April 2015, based on the November 2014 submission. http://www.seer.cancer.gov. Accessed 31 May 2016.
- 23.Harrell F. Regression modeling strategies: with applications to linear models, logistic and ordinal regression, and survival analysis. Springer; 2015. http://www.springer.com/gb/book/9783319194240. Accessed 31 May 2016.
- 24.Kang L, Chen W, Petrick NA, Gallas BD. Comparing two correlated C indices with right-censored survival outcome: a one-shot nonparametric approach. Stat Med. 2015;34:685–703. doi: 10.1002/sim.6370. [DOI] [PMC free article] [PubMed] [Google Scholar]
- 25.Hung H, Chiang CT. Estimation methods for time-dependent AUC models with survival data. Can J Stat. 2010;38:8–26. [Google Scholar]
- 26.Vickers AJ, Elkin EB. Decision curve analysis: a novel method for evaluating prediction models. Med Decis Making. 2006;26:565–574. doi: 10.1177/0272989X06295361. [DOI] [PMC free article] [PubMed] [Google Scholar]
- 27.Collins GS, Reitsma JB, Altman DG, Moons KGM. Transparent Reporting of a multivariable prediction model for Individual Prognosis Or Diagnosis (TRIPOD): The TRIPOD Statement. Ann Intern Med. 2015;162:55–63. doi: 10.7326/M14-0697. [DOI] [PubMed] [Google Scholar]
- 28.WMA Declaration of Helsinki. Ethical Principles for Medical Research Involving Human Subjects. http://www.wma.net/en/30publications/10policies/b3/index.html. Accessed 31 May 2016.
- 29.Iasonos A, Schrag D, Raj GV, Panageas KS. How to build and interpret a nomogram for cancer prognosis. J Clin Oncol. 2008;26:1364–1370. doi: 10.1200/JCO.2007.12.9791. [DOI] [PubMed] [Google Scholar]
- 30.Shariat SF, Karakiewicz PI, Suardi N, Kattan MW. Comparison of nomograms with other methods for predicting outcomes in prostate cancer: A critical analysis of the literature. Clin Cancer Res. 2008;14:4400–4407. doi: 10.1158/1078-0432.CCR-07-4713. [DOI] [PubMed] [Google Scholar]
- 31.Kawai K, Sunami E, Yamaguchi H, Ishihara S, Kazama S, Nozawa H, et al. Nomograms for colorectal cancer: a systematic review. World J Gastroenterol. 2015;21:11877–11886. doi: 10.3748/wjg.v21.i41.11877. [DOI] [PMC free article] [PubMed] [Google Scholar]
- 32.Weiser MR, Gonen M, Chou JF, Kattan MW, Schrag D. Predicting survival after curative colectomy for cancer: individualizing colon cancer staging. J Clin Oncol. 2011;29:4796–4802. doi: 10.1200/JCO.2011.36.5080. [DOI] [PMC free article] [PubMed] [Google Scholar]
- 33.Zhang JX, Song W, Chen ZH, Wei JH, Liao YJ, Lei J, et al. Prognostic and predictive value of a microRNA signature in stage II colon cancer: a microRNA expression analysis. Lancet Oncol. 2013;14:1295–1306. doi: 10.1016/S1470-2045(13)70491-1. [DOI] [PubMed] [Google Scholar]
- 34.Pietrantonio F, Aprile G, Rimassa L, Franco P, Lonardi S, Cremolini C, et al. A new nomogram for estimating survival in patients with brain metastases secondary to colorectal cancer. Radiother Oncol. 2015;117:315–321. doi: 10.1016/j.radonc.2015.08.023. [DOI] [PubMed] [Google Scholar]
- 35.Wong JH, Lum SS, Morgan JW. Lymph node counts as an indicator of quality at the hospital level in colorectal surgery. J Am Coll Surg. 2011;213:226–230. doi: 10.1016/j.jamcollsurg.2011.05.003. [DOI] [PubMed] [Google Scholar]
- 36.Willaert W, Mareel M, Van De Putte D, Van Nieuwenhove Y, Pattyn P, Ceelen W. Lymphatic spread, nodal count and the extent of lymphadenectomy in cancer of the colon. Cancer Treat Rev. 2014;40:405–413. doi: 10.1016/j.ctrv.2013.09.013. [DOI] [PubMed] [Google Scholar]
- 37.Hashiguchi Y, Hase K, Ueno H, Mochizuki H, Shinto E, Yamamoto J. Optimal margins and lymphadenectomy in colonic cancer surgery. Brit J Surg. 2011;98:1171–1178. doi: 10.1002/bjs.7518. [DOI] [PubMed] [Google Scholar]
- 38.Valentini V, van Stiphout RGPM, Lammering G, Gambacorta MA, Barba MC, Bebenek M, et al. Nomograms for predicting local recurrence, distant metastases, and overall survival for patients with locally advanced rectal cancer on the basis of european randomized clinical trials. J Clin Oncol. 2011;29:3163–3172. doi: 10.1200/JCO.2010.33.1595. [DOI] [PubMed] [Google Scholar]
Associated Data
This section collects any data citations, data availability statements, or supplementary materials included in this article.
Data Availability Statement
The cohort data are available to researchers and should be requested under the approval of the SEER Program administration. The other datasets supporting the conclusions of this article are included within the article.