Significance
Previous works demonstrated the role of hypoxia in tumor development and metastasis. However, the understanding how oxygen (O2) gradients regulate early stages of tumor metastasis is lacking. Leveraging our O2-controlling hydrogel, we generated a 3D in vitro model that enables us to analyze cancer cell responses to O2 gradients and small-molecule inhibitors. Using this approach, we present a previously unidentified concept in which O2 acts as a 3D physicotactic agent during sarcoma tumor invasion, findings that are important for the understanding of the metastatic process. Through this concept, we also establish the 3D in vitro model as a platform for testing therapeutic targets and interventions for the treatment of sarcoma and potentially other cancers.
Keywords: hydrogel, sarcoma, hypoxia, gradients, migration
Abstract
Hypoxia is a critical factor in the progression and metastasis of many cancers, including soft tissue sarcomas. Frequently, oxygen (O2) gradients develop in tumors as they grow beyond their vascular supply, leading to heterogeneous areas of O2 depletion. Here, we report the impact of hypoxic O2 gradients on sarcoma cell invasion and migration. O2 gradient measurements showed that large sarcoma mouse tumors (>300 mm3) contain a severely hypoxic core [≤0.1% partial pressure of O2 (pO2)] whereas smaller tumors possessed hypoxic gradients throughout the tumor mass (0.1–6% pO2). To analyze tumor invasion, we used O2-controllable hydrogels to recreate the physiopathological O2 levels in vitro. Small tumor grafts encapsulated in the hydrogels revealed increased invasion that was both faster and extended over a longer distance in the hypoxic hydrogels compared with nonhypoxic hydrogels. To model the effect of the O2 gradient accurately, we examined individual sarcoma cells embedded in the O2-controllable hydrogel. We observed that hypoxic gradients guide sarcoma cell motility and matrix remodeling through hypoxia-inducible factor-1α (HIF-1α) activation. We further found that in the hypoxic gradient, individual cells migrate more quickly, across longer distances, and in the direction of increasing O2 tension. Treatment with minoxidil, an inhibitor of hypoxia-induced sarcoma metastasis, abrogated cell migration and matrix remodeling in the hypoxic gradient. Overall, we show that O2 acts as a 3D physicotactic agent during sarcoma tumor invasion and propose the O2-controllable hydrogels as a predictive system to study early stages of the metastatic process and therapeutic targets.
Soft tissue sarcomas are a heterogeneous group of malignant cancers derived from transformed cells of mesenchymal origin (1, 2). Approximately 13,000 new cases per year are diagnosed in the United States alone, with 25–50% of patients developing recurrent and metastatic disease (3–5). Current clinical data suggest that undifferentiated pleomorphic sarcoma (UPS) is one of the most aggressive sarcoma subtypes, which frequently results in lethal pulmonary metastases that are insensitive to radio/chemotherapy. It has recently become apparent that sarcoma progression and metastasis are regulated by microenvironmental cues, such as extracellular matrix (ECM) remodeling, stiffness modulation, cell-to-cell/matrix interactions, signaling factors, and spatial gradients (6–8). Of all these factors, low intratumoral oxygen (O2; hypoxia) is most dramatically associated with pulmonary metastasis and poor clinical outcomes (9, 10).
Intratumoral hypoxia occurs when the partial pressure of O2 (pO2) falls below 5%, and it is a commonly observed feature of many sarcomas. Regional hypoxia develops as rapidly growing tumors outstrip their blood supply and as a consequence of aberrant tumor angiogenesis. As a result, O2 gradients develop throughout the growing tumor. Tumor hypoxia promotes chemoresistance and radiation resistance, primarily due to limited perfusion and reduced generation of reactive oxygen species (ROS), respectively (11). Moreover, the stabilization and activation of hypoxia-inducible factor (HIF) transcriptional regulators promote adaptation to hypoxic stress by modulating tumor cell metabolism, survival, angiogenesis, migration, invasion, and metastasis. Elevated HIF expression has been associated with poor prognosis in many cancers (12) and correlates with reduced survival for patients with sarcoma. Recent transcriptome analyses have identified HIFs and HIF target genes as independent prognostic indicators (13) of clinical outcomes. Finally, high levels of intratumoral hypoxia and HIF-1α accumulation are among the most important predictors of metastatic potential in patients with sarcoma (14), although the underlying mechanisms for this correlation remain incompletely characterized. Importantly, although the effect of overall reduced O2 on sarcoma cell responses has been studied, these cells are actually subjected to O2 gradients. Currently, the impact of specific O2 gradients on sarcoma cell migration is unclear.
In previous studies, we found that deposition of immature collagen networks facilitated tumor cell metastasis to the lung in an HIF-1α–dependent manner (15). We also demonstrated that the HIF-1α regulated sarcoma metastasis through up-regulation of procollagen-lysine, 2-oxoglutarate 5-dioxygenase (PLOD2), and the resulting increase in lysine hydroxylation of collagen molecules (15). We have shown that PLOD2 expression promotes metastasis in a hypoxia- and HIF-1α–dependent manner in a genetic in vivo model of UPS (15). However, we do not yet know how sarcoma cell migration/invasion is altered in the presence of the O2 gradients that develop in tumors.
Using in situ O2 measurements, we found that hypoxia gradients exist in small primary mouse sarcoma tumors, whereas large primary mouse sarcoma tumors contain severe hypoxic cores (≤0.1% pO2). To model intratumoral O2 gradients, we used novel O2-controlling hydrogels that can serve as 3D hypoxic microenvironments (16). In these hypoxia-inducible (HI) hydrogels, O2 is consumed while polymerization occurs, resulting in spatial O2 gradients. Thus, with these hydrogels, we can mimic physiopathological O2 gradients. By encapsulating small tumor grafts in the hydrogels, we found that hypoxic gradients promoted cell invasion with faster speeds and longer distances, compared with nonhypoxic gradients. We next demonstrate that the HI hydrogel culture system replicates HIF-1α–dependent collagen remodeling by sarcoma cells. Using this system, we then show that the hypoxic gradients guide the speed, distance, and direction of sarcoma cell motility compared with nonhypoxic hydrogels. Finally, we show that treatment of the encapsulated sarcoma cells with minoxidil abrogates cell migration and matrix remodeling in the O2 gradient.
Results and Discussion
Primary Sarcoma Grafts Invade Hypoxic Hydrogels.
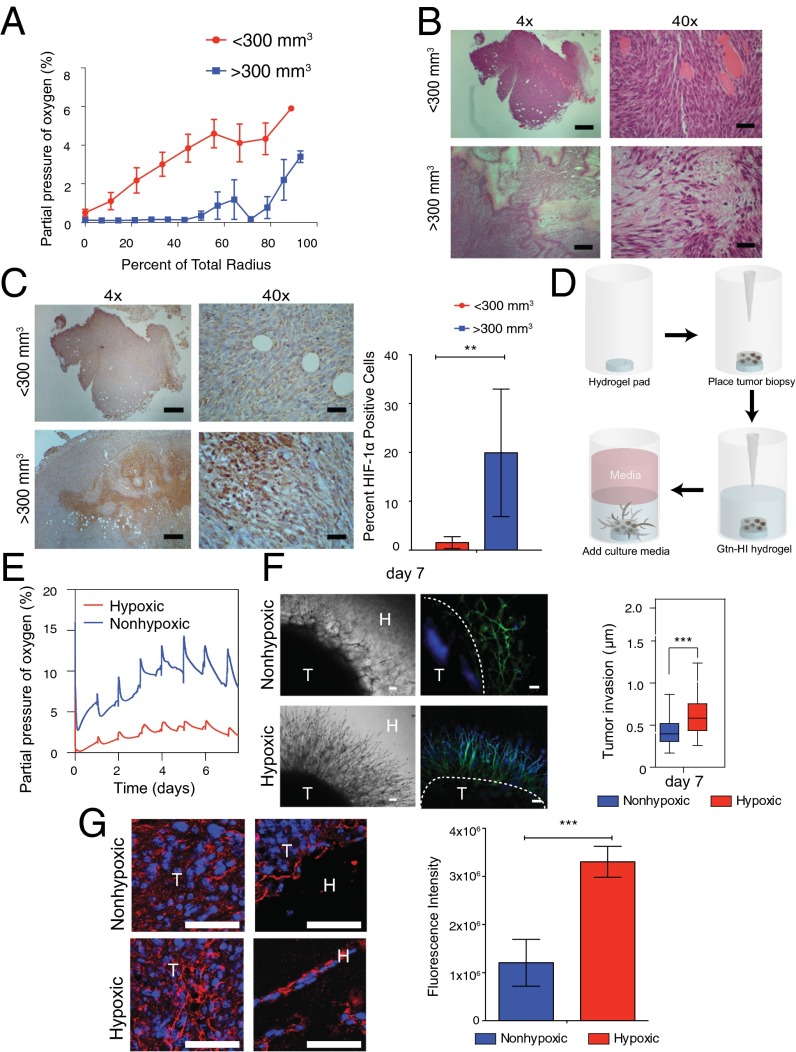
To ascertain the physiological range of O2 gradients in the developing sarcoma tumor, we began by measuring dissolved O2 (DO) levels during the growth of primary mouse sarcoma tumors. The primary sarcoma tumors were generated in nude mice using murine sarcoma cells derived from KrasG12D/+; Ink4a/Arffl/fl (KIA) tumors (17) as described in previous studies (15). O2 gradient measurements during growth of s.c. primary sarcomas showed that in large tumors (>300 mm3), about 50% of the tumor mass is hypoxic (≤0.1% pO2). Smaller tumors exhibit hypoxic gradients throughout the tumor mass, ranging from 0.1% pO2 at the center to >6% pO2 in the outer layer bordering the edge of the tumor (Fig. 1A). Histological analysis further revealed the severe hypoxic tumor core with cells expressing HIF-1α localized to the nuclei in the larger tumors, whereas weaker and more diffused HIF-1α signal was observed throughout the entire smaller tumors (Fig. 1 B and C and Fig. S1). Previously, we have established O2-controlling hydrogels and found that after hydrogel formation, the DO levels at the bottom of hydrogels decreased as gel thickness increased due to O2 diffusion limitation, resulting in a broad range of O2 tensions within the gel matrices (16). Based on the O2 gradient found in the xenograft tumors, we sought to use the O2-controllable hydrogel system to provide a more physiologically relevant 3D microenvironment to study cell migration. Using the hypoxic hydrogel system, we recreated the hypoxic DO conditions found in the s.c. in vivo tumors and evaluated the role of O2 in 3D tumor cell migration assay. Tumor biopsy punches from smaller tumors were cut into 8-mm sections and grafted into the hypoxic and nonhypoxic hydrogels (Fig. 1D). Using noninvasive DO measurements at the bottom of the hydrogels, we found that DO levels in the hypoxic hydrogels reached <5% pO2 within the initial 30 min and remained there during the entire week of measurements. Nonhypoxic hydrogels exhibited a higher level of O2 (>5% pO2) during this culture period (Fig. 1E). The tumor engrafted within hypoxic matrix demonstrated increased invasion compared with tumors engrafted within nonhypoxic matrix. Specifically, tumors in hypoxic matrix invaded further into the hydrogel and away from the primary graft (after 1 wk, 610 ± 210 μm) compared with those tumors encapsulated in nonhypoxic gels (after 1 wk, 410 ± 130 μm) (Fig. 1F). Moreover, migrating cells exiting tumor grafts in the hypoxic hydrogel deposited new collagen compared with nonhypoxic hydrogels (Fig. 1G), consistent with our previous findings (15).
Fig. 1.
Enhanced invasion of sarcoma tumor grafts in hypoxic hydrogels. (A) In situ DO measurements in KIA tumors. H&E stains (B) and HIF1-α stains (C, Left) and quantification (C, Right) of small and large tumors are shown. (Scale bars: 4× images, 200 μm; 40× images, 20 μm.) (D) Schematic illustration of tumor encapsulation within HI hydrogel matrix. (E) DO levels of HI hydrogels encapsulated with tumor biopsy in hypoxic and nonhypoxic matrices up to day 7 in culture. (F, Left) Light microscope (Left) and fluorescence microscope (Right) images of sarcoma tumors encapsulated within nonhypoxic and hypoxic matrices (phalloidin in green, nuclei in blue). H, hydrogels; T, tumors. (Scale bars: 100 μm.) (F, Right) Quantitative analysis of the sarcoma tumor invasion into hydrogel matrix. (G) Immunofluorescence staining and quantification of collagen deposition by tumor grafts cultured for 7 d (collagen in red, nuclei in blue). (Scale bars: 25 μm.) Significance levels: **P < 0.01; ***P < 0.001.
Fig. S1.
Primary mouse sarcoma tumors. The whole tumor is shown, using tiled micrographs of H&E stains (Left) and HIF-1α stains (Right) of small and large tumors. (Scale bars: 1 mm.)
Cell Migration from Sarcoma Grafts Is Regulated by O2 Gradients.
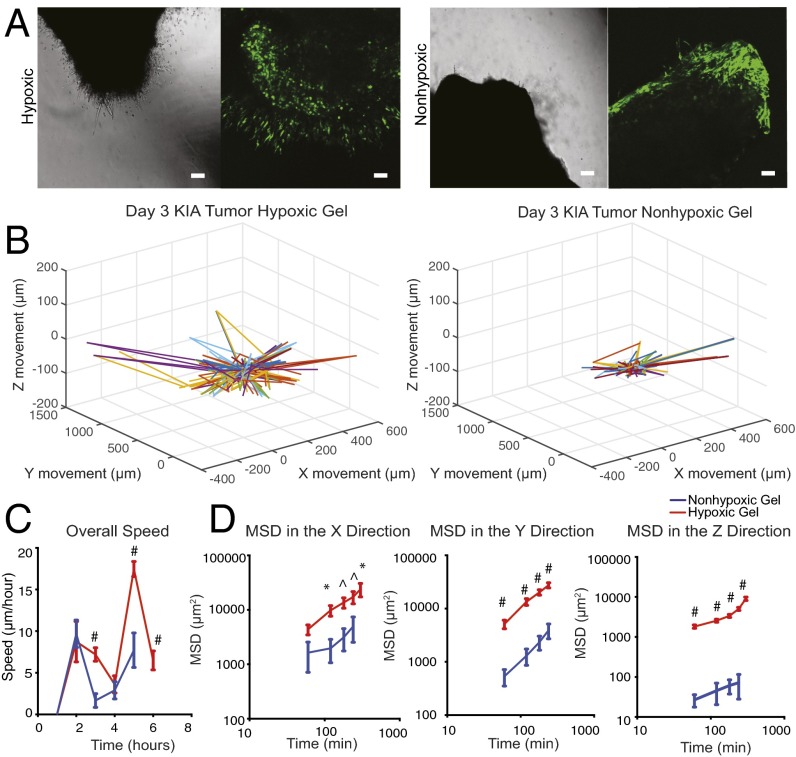
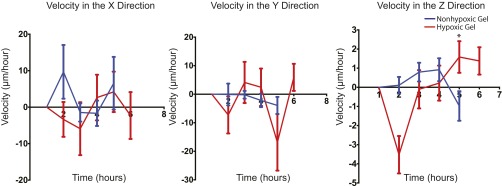
To investigate further the effect of O2 gradients on sarcoma tumor migration, we performed real-time confocal analysis. Tumors generated from green fluorescent protein (GFP)-positive KIA cells were engrafted in hypoxic and nonhypoxic hydrogels and imaged on day 3 when we first detected cell invasion into the hydrogel (Fig. 2A). We then analyzed cell migration on day 3, when we could first detect cell invasion from the tumor to the hydrogel. We observed dynamic cell movement in the hypoxic constructs compared with the nonhypoxic constructs, with more cells migrating out of the grafts under hypoxic conditions (Fig. 2B and Fig. S2). Cell velocity analysis did not indicate specific directionality of migration, with most cells moving in the x and y planes, suggesting a random migration path independent of O2 tension (Fig. S3). However, we found a higher migration speed in hypoxic grafts compared with nonhypoxic grafts (Fig. 2C). Examining mean square displacement (MSD) in the three planes, we found that cells migrating in the hypoxic gradients move larger distances compared with the nonhypoxic gradients, with a significantly longer distance in the z direction (Fig. 2D) suggesting that although cells typically migrated in the x and y directions, those cells that migrated in the z direction exhibited higher persistence. Overall, these data show that hypoxic gradient promotes tumor cell migration.
Fig. 2.
Hypoxia promotes primary sarcoma migration. (A) Light microscope (Left) and fluorescence microscope (Right) images of day 3 images of KIA-GFP sarcoma tumors encapsulated within nonhypoxic and hypoxic matrices. Migrating GFP cells were tracked to determine 3D trajectories of tracked cells (representative trajectories) (scale bars: 100 μm) (B); overall speed (C); and MSD in the x, y, and z directions (D). Plots were created using the position of KIA-GFP cells in the hydrogels. Significance levels: *P < 0.05; ^P < 0.01; #P < 0.001.
Fig. S2.
Primary sarcoma tumor migration velocity. KIA-GFP sarcoma tumors were encapsulated within nonhypoxic and hypoxic matrices. Day 3 migrating GFP cells were tracked to determine velocity in the x, y, and z directions.
Fig. S3.
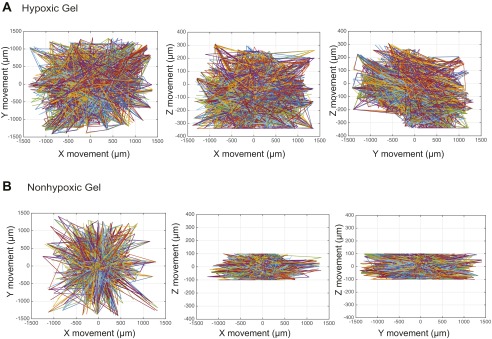
Primary sarcoma migration trajectories. Two-dimensional trajectories of tracked cells in hypoxic (A) and nonhypoxic (B) hydrogels are shown.
Sarcoma Cells Remodel Collagen in Hypoxic Hydrogels.
Although the tumor graft model provides vital information, the inherited heterogeneity of the system limited the mechanistic insights that such systems can provide. To model the effect of DO gradients on sarcoma cell invasion/migration within a complex tumor microenvironment more accurately, we next examined individual sarcoma cells embedded in the HI hydrogels (16). Noninvasive measurements of DO at the bottom of the hydrogel confirmed that the hypoxic matrix maintains low O2 levels during the 7 d of culture compared with nonhypoxic matrix (Fig. 3A). Notably, by day 7 in culture, O2 levels have decreased to ∼0.5%, likely to due to expansion of the cell number over the longer culture period and the associated cellular O2 consumption (18). An important feature of this culture system is the ability to maintain the hypoxic gradient environment without exposure to high O2 levels, thus minimizing the introduction of ROS. This hydrogel allows for the ability to perform live imaging of the cells while monitoring DO levels, presents a unique opportunity to link cellular responses to DO gradients. Growing evidence suggests that ECM remodeling is critical in sarcoma migration and metastasis. In particular, proteolytic degradation and abnormal collagen deposition and modification within hypoxic tumor microenvironments have been implicated as important parameters that enhance tumor invasion and metastasis (19–21). The gelatin (Gtn)-based HI hydrogels provide matrix adhesion and degradation sites similar to those sites in the tumor microenvironment, yet are collagen-free to prevent confounding results. We first tested whether sarcoma cells embedded in hypoxic hydrogel remodel the matrix material. We examined the proteolytic degradation of the HI Gtn matrices using DQ Gtn (Invitrogen), which emits green fluorescence when degraded by a protease secreted by the cells (22, 23). Interestingly, we observed higher fluorescence intensity in the cells cultured within the hypoxic microenvironments [480 relative fluorescent units (RFU)] compared with the nonhypoxic matrix (50 RFU) (Fig. 3B). Rheological analysis further confirmed the softening of the hypoxic matrix (Young’s modulus of 20 Pa) compared with nonhypoxic matrix (Young’s modulus of 45 Pa) within 3 d of culture (Fig. 3C). The Gtn-based HI hydrogels further enabled us to examine whether sarcoma cells modify collagen in the hypoxic matrix. We next examined the upstream effect of HIF-1α activation on relevant genes on days 3 and 7. Although no change in gene expression was detected on day 3 of culture, we observed an up-regulation of collagen 1 A1 (COL1A1), lysl oxidase (LOX), and PLOD2 expression after 7 d of culture in the hypoxic hydrogel compared with the nonhypoxic hydrogel (Fig. 3D). Moreover, at this time point, we detected collagen expression and deposition (Fig. 3E), as well as HIF-1α expression (Fig. S4), by the sarcoma cells in the hypoxic hydrogel. To determine whether ECM remodeling is regulated by the HIF-1α in the hypoxic matrix, we used short hairpin RNA. We detected significant down-regulation of the genes that code for collagen-modifying proteins Col1A1, LOX, and PLOD2 when HIF-1α expression was inhibited (Fig. 3F), resulting in less collagen deposition in hypoxic hydrogel-encapsulated cells compared with controls (Fig. 3G). Overall, these results demonstrate that the 3D hypoxic hydrogel regulates sarcoma matrix remodeling through hypoxic induction of HIF-1α expression. These results are consistent with various sarcoma studies in vivo (15, 24, 25), suggesting that the HI hydrogels are an appropriate 3D model with the necessary biological attributes to study sarcoma cell invasion and migration.
Fig. 3.
Sarcoma cells remodel the hypoxic hydrogel. (A) Noninvasive DO readings at the bottom of the hypoxic and nonhypoxic hydrogel sarcoma cell constructs. (B) Sarcoma cells encapsulated within HI hydrogels incorporating DQ Gtn for 3 d. (B, i) Representative fluorescence microscopy images. (Scale bars: 25 μm.) (B, ii) Quantitative analysis of relative fluorescence intensity. (C) Young’s modulus (Pa) of the hypoxic and nonhypoxic hydrogels on day 0 and after 3 d of culture. w/o, without. (D) Real-time RT-PCR analysis of collagen modification genes. (E) Immunofluorescence staining and analysis of collagen deposition by the encapsulated cells (collagen in red, nuclei in blue). (Scale bars: 50 μm.) The effect of HIF-1α suppression in encapsulated sarcoma cells [KIA_scr, a control; KIA_HIF-1α(−), HIF knockdown] after 7 d in culture was analyzed, including collagen modification gene expression (F) and collagen deposition and quantification (G) (collagen in red, nuclei in blue). (Scale bars: 50 μm.) Graphical results are shown as the average value ± SD. Significance levels: *P < 0.05; **P < 0.01; ***P < 0.001. NS, not significant.
Fig. S4.
HIF-1α expression. Representative immunofluorescence staining of HIF-1α expression by the encapsulated cells (HIF-1α in red, nuclei in blue). Note the abundant nuclear staining and cytoplasmic staining as they relate to rapid protein turnover in the hypoxic hydrogels. (Scale bars: 25 μm.)
O2 Gradients Modulate the Speed, Distance, and Directional Bias of Sarcoma Cell Motility.
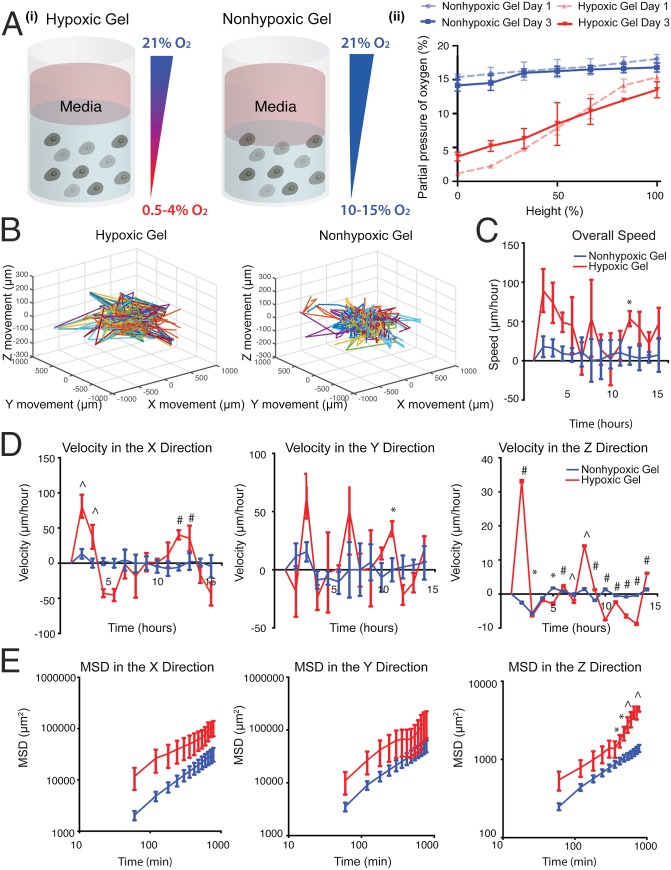
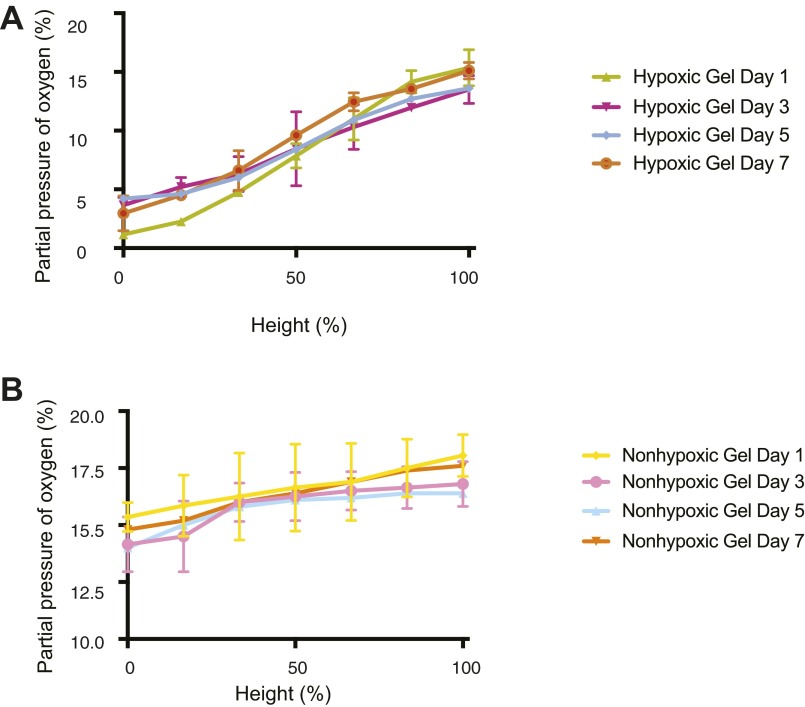
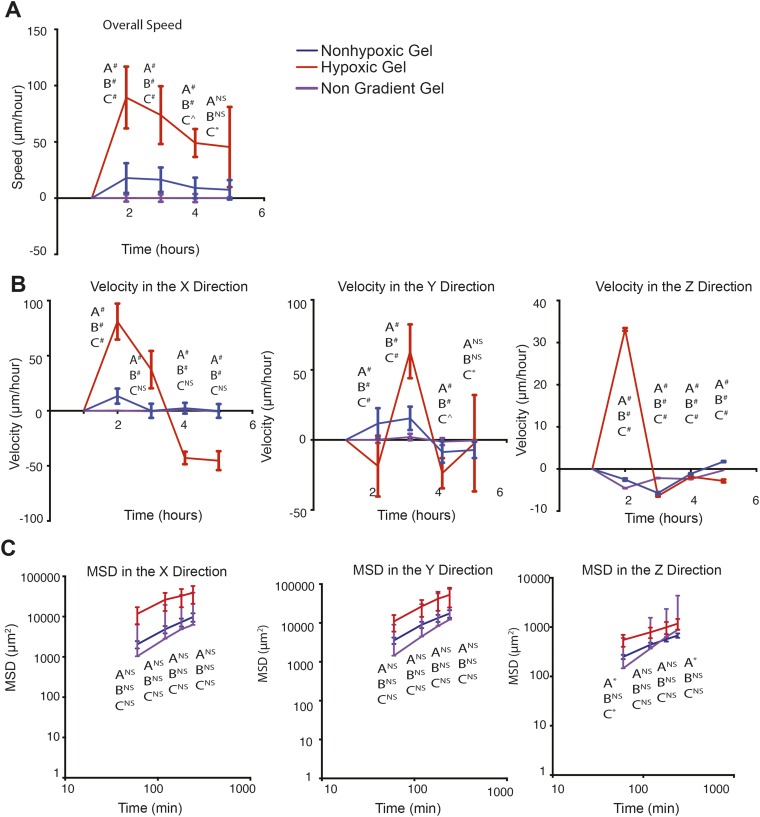
As we have previously shown, the HI hydrogel system is designed to create an O2 upward gradient, wherein DO levels increase toward the interface between the construct and O2-saturated culture media (16). Encapsulation of individual cell suspension would provide us the opportunity to document single-cell movement in relation to the O2 gradient (Fig. 4 A, i). Because these constructs are cultured in air-oxygenated media, hypoxic and nonhypoxic upward gradients are maintained in each of the gel types (16). Invasive DO measurements validated hypoxic and nonhypoxic gradients in the hydrogel cell constructs (Fig. 4 A, ii and Fig. S5). These results confirm that we are able to mimic successfully the gradients seen in the primary tumor in vivo. Thus, we next examined how sarcoma cell motility is regulated by the O2 gradients in the 3D hypoxic and nonhypoxic gradients. We encapsulated KIA-GFP in the HI hydrogels and analyzed movement on day 3 using real-time 3D cell tracking. Upon examining the 3D trajectory profiles of the KIA-GFP–encapsulated cells, we observed greater overall cell movement in the hypoxic gradients compared with the nonhypoxic gels (Fig. 4B and Fig. S6). We also found that cells in the hypoxic gradient gels are moving faster than cells in the nonhypoxic gels. The cells moving through the gel have faster velocity profiles in the x, y, and z directions as well as for the overall speed. (Fig. 4 C and D). Interestingly, we found that cells also moved in the z direction, which has not been reported before. Importantly, cell velocity in the z direction was primarily upward, in the direction of increased O2 tension (Fig. 4D). We further computed and analyzed the MSD in the three planes (Fig. 4E). Here too, O2 gradient seemed to affect cell motility, as indicated by the MSD in the z direction. Cells exposed to the hypoxic gradient are traveling over larger distances compared with cells in the nonhypoxic gradients (Fig. 4E). Interestingly, nongradient hypoxic constructs (i.e., hydrogel constructs cultured in hypoxic conditions) showed slower cell movement and a lower MSD compared with hypoxic gradient constructs (Fig. S7). Overall, these data show that increased DO levels enhance the speed, distance, and direction of sarcoma cell movement.
Fig. 4.
Efficient sarcoma cell migration in hypoxic gradients (A, i) Illustration of hypoxic and nonhypoxic O2 gradients in HI hydrogels. (A, ii) Invasive DO readings showing gradients in the HI hydrogels on days 1 and 3. KIA-GFP cells were tracked on day 3 in hypoxic and nonhypoxic hydrogels to determine 3D trajectories of tracked cells (representative trajectories) (B); overall speed (C); velocity in the x, y, and z directions (D); and MSD in the x, y, and z directions (E). Plots were created using the position of KIA-GFP cells in the hydrogels. Significance levels: *P < 0.05; ^P < 0.01; #P < 0.001.
Fig. S5.
DO gradient measurement. Invasive DO readings in the hypoxic (A) and nonhypoxic (B) hydrogels on days 1, 3, 5, and 7.
Fig. S6.
Sarcoma cell migration trajectories. Two-dimensional trajectories of tracked cells in hypoxic (A) and nonhypoxic (B) hydrogels are shown.
Fig. S7.
Sarcoma migration in nongradient gels. KIA-GFP cells were tracked on day 3 in nongradient hypoxic gels and compared with the cell migration in gradient hypoxic and nonhypoxic gels. Overall speed (A); velocity in the x, y, and z directions (B); and MSD in the x, y, and z directions (C) are shown. Plots were created using the position of KIA-GFP cells in the hydrogels.
Inhibiting 3D Hypoxic Gradient Migration.
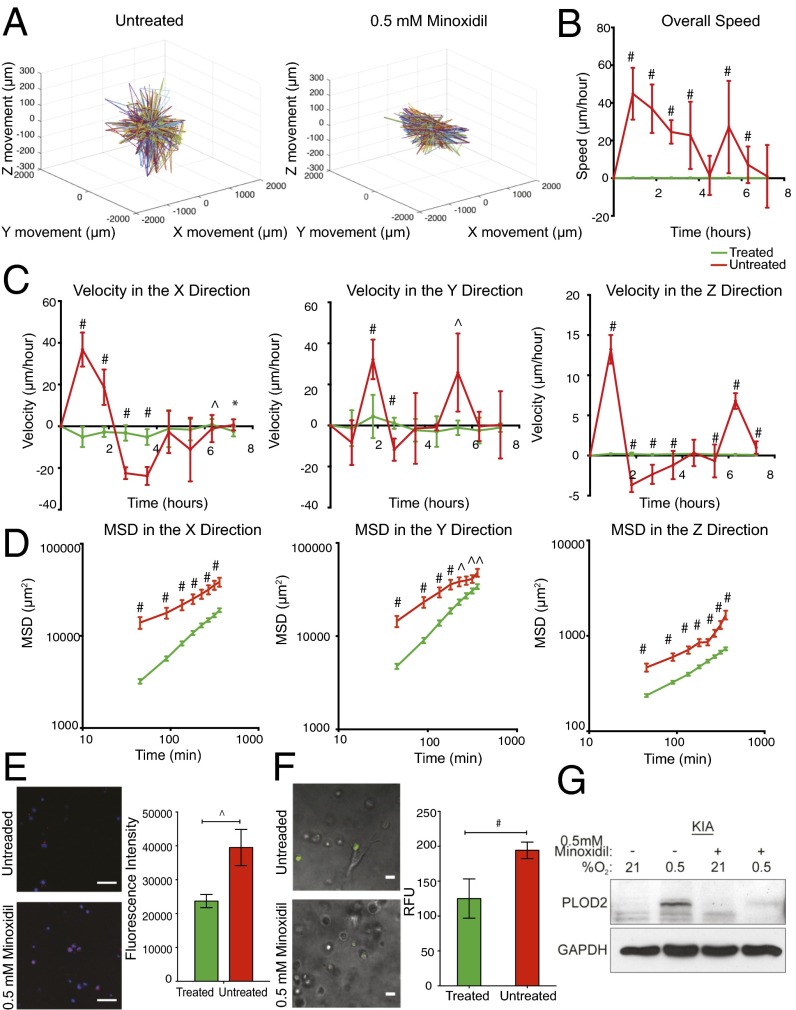
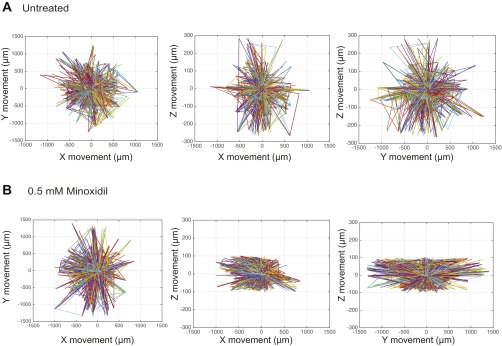
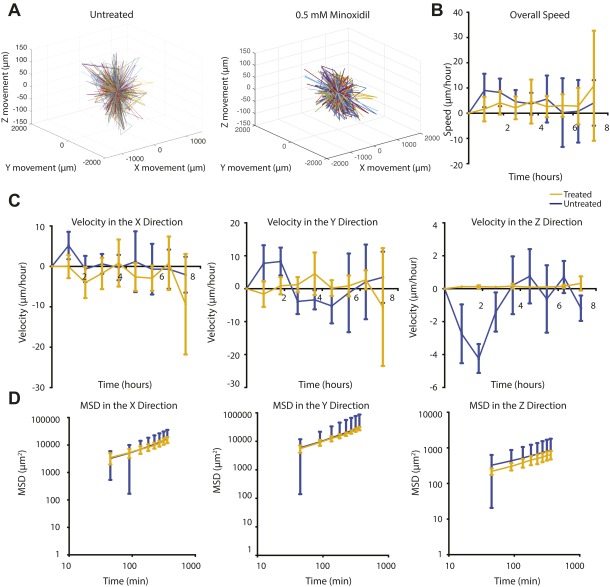
We previously demonstrated that PLOD2 promotes metastasis in a hypoxia- and HIF-1α–dependent manner in an in vivo model of UPS (15). To examine whether the O2-controllable hydrogel faithfully represents the intratumoral hypoxic environment, we examined the effect of minoxidil, a pharmacological inhibitor of PLOD2 expression (26), on sarcoma cell migration. Minoxidil treatment (0.5 mmol/L) for 12 h of sarcoma cells encapsulated in the hypoxic hydrogels significantly reduced KIA cell movement (Fig. 5A and Fig. S8), concomitant with reduced overall cell speed as well as velocity and MSD in the x, y, and z directions (Fig. 5 B–D). Minoxidil treatment of sarcoma cells encapsulated in the nonhypoxic hydrogels did not significantly affect cell migration in the x and y directions, with slight inhibition of migration in the z direction (Fig. S9). Examining matrix remodeling, we found that minoxidil treatment reduced collagen deposition (Fig. 5E) and inhibited the proteolytic degradation of the hypoxic matrices (Fig. 5F). As expected, we found that hypoxia-induced PLOD2 expression is inhibited with minoxidil treatment (Fig. 5G). Together, these data show that hypoxia gradients determine the direction and speed of sarcoma cell migration in an HIF1/PLOD2-dependent manner. Importantly, these findings also highlight the utility of hydrogel encapsulation assays for the identification of novel therapeutic targets and inhibitors for the treatment of metastatic sarcoma and potentially other cancers as well.
Fig. 5.
Minoxidil inhibits sarcoma cell migration and matrix remodeling in hypoxic hydrogel. KIA-GFP cells were tracked on day 3 in hypoxic-treated and untreated hydrogel to determine 3D trajectories of tracked cells (representative trajectories) (A); overall speed (B); velocity in the x, y, and z directions (C); and MSD in the x, y, and z directions (D). Plots were created using the position of KIA-GFP cells in the hydrogels. (E) Collagen deposition and quantification (collagen in red, nuclei in blue). (Scale bars: 50 μm.) (F) Proteolytic degradation of HI hydrogels incorporating DQ Gtn for 3 d. (Left) Representative fluorescence microscopy images. (Scale bars: 20 μm). (Right) Quantitative analysis of relative fluorescence intensity. (G) Western blot analyses for PLOD2 in KIA cells cultured in hypoxic conditions with and without minoxidil treatment. Significance levels: *P < 0.05; ^P < 0.01; #P < 0.001.
Fig. S8.
Minoxidil treatment effect on sarcoma cell migration trajectories. Two-dimensional trajectories of tracked cells in untreated hydrogels (A) and hydrogels treated with 0.5 mM minoxidil (B) are shown.
Fig. S9.
Minoxidil treatment effect on sarcoma cell migration in nonhypoxic hydrogel. KIA-GFP cells were tracked on day 3 in nonhypoxic-treated and untreated hydrogels to determine 3D trajectories of tracked cells (representative trajectories) (A); overall speed (B); velocity in the x, y, and z directions (C); and MSD in the x, y, and z directions (D). Plots were created using the position of KIA-GFP cells in the hydrogels.
Conclusions
Leveraging our O2-controlling hydrogel, we generated a 3D in vitro model that enables us to analyze cancer cell responses to O2 gradients and the effect of small-molecule inhibitors. Using this approach, the current study presents a previously unidentified concept in which O2 acts as a 3D physicotactic agent during early stages of sarcoma tumor invasion. We found that an O2 gradient is present in early stages of sarcoma development and that during this stage, cells respond to the hypoxic gradient by aggressively invading the matrix, followed by fast and long-distance migration. Moreover, we demonstrated that in hypoxic gradients, individual sarcoma cells not only migrate faster and over a longer distance while remodeling the matrix but also migrate in the direction of increased O2 tension. Finally, we showed that treatment with minoxidil inhibits the migration and matrix remodeling in the hypoxic gradient. These findings are important for the understanding of the metastatic process and establishing the 3D in vitro model as a platform for testing therapeutic targets and interventions for the treatment of cancer.
Materials and Methods
Detailed materials and methods are provided in SI Materials and Methods. Briefly, Gtn-based HI hydrogels were synthesized by a carbodiimide-mediated coupling reaction as we previously reported (16). For cancer cell encapsulation, cell pellets of KIA, KIA-GFP, or KIA–HIF-1α, or KIA-Scr [1.0 × 10⁶ cells; derived from a genetic murine model of sarcoma, LSL-KrasG12D/+; Ink4a/Arffl/fl as established previously (15)] were mixed with polymer stock solution followed by addition of laccase. After mixing the enzyme, the solution was incubated at 37 °C for 2 min and then cultured under standard cell culture conditions in cancer cell KIA media.
Primary Tumor Formation, DO Measurements, and Encapsulation.
For primary tumor encapsulation, we generated mouse sarcomas as previously reported (15), which were extracted and sliced on day 10. The tumor specimens were encapsulated within the hydrogels of different thicknesses and cultured under standard cell culture conditions in KIA media. The O2 levels during the culture period were monitored using noninvasive O2 sensors, as described above. To monitor real-time tumor invasion and migration, we encapsulated tumors generated from KIA-GFP cells.
Noninvasive O2 Measurement During Cell and Tumor Graft Culture.
The DO levels were monitored noninvasively at the bottom of hydrogels using commercially available sensor patches (PreSens), as previously established (16, 27). To vary O2 tension, we controlled the thickness of hydrogels in a volume-dependent manner. We generated hydrogels with different minimum DO levels (defined as hypoxic gels and nonhypoxic gels, >8% O2). For example, to generate hypoxic gels, we plated 100 μL (2.5-mm thickness) of a mixture that included polymer, cells, and laccase solutions into a well, whereas 50 μL (1.25-mm thickness) of the mixture was plated into a well for preparing nonhypoxic gels.
Invasive O2 Gradient Measurements.
The O2 levels in vivo were measured using a Needle-Type Housing Fiber-Optic O2 Microsensor (PreSens). These needle sensors were mounted on a micromanipulator with 10-μm precision (PreSens). Hydrogel cell constructs were generated as detailed above. Tumors were generated as previously stated, and DO measurements were performed once tumors were visible. O2 gradient measurements were performed using the needle sensor and a micromanipulator (PreSens). The tumor diameter was measured using a caliper, and the needle was placed at the center of the tumor and moved outward in 0.5-mm increments, recording a DO reading at each distance, until reaching the edge of the tumor. The volume of the tumor was calculated using an established method (28). The tumor O2 measurements were averaged, and the SE of the mean was calculated for each distance from the center of the tumor. This same approach was used to evaluate the O2 gradient in the hydrogel at days 1, 3, 5, and 7 in the KIA-encapsulated samples.
Matrix Degradation, Migration Assays, and Drug Treatment.
To assess the effect of O2 levels on matrix degradation, we incorporated 10 μg/mL DQ Gtn (Invitrogen) into polymer solutions when preparing cell suspensions and then mixed the solutions with the laccase solution as described above. After day 3, the hydrogels with DQ-Gtn were observed by the fluorescence microscopy (BX60; Olympus) and quantified by measuring the fluorescence intensity using a fluorescence spectrophotometer at a wavelength of 495 nm excitation and 515 nm emission (Molecular Devices).
For the 3D cancer cell migration assay, we encapsulated KIA-GFP cells and tumor grafts in hydrogel to generate constructs with different O2 levels as reported previously (16). For nongradient hydrogel controls, constructs were formed and incubated in 1% O2 for 3 d and then tracked in that chamber at day 3. Cells were tracked at day 3 using live-cell 3D confocal microscopy (LSM 780; Carl Zeiss) equipped with a cell incubator (5% CO2 and 37 °C). To optimize the experiment properly, only cells that started in-frame were included, with a shorter time frame used for the tumor-encapsulated samples. The time-lapse and z-stack images (>200-μm thickness) were collected every 30 min up to 24 h at five randomly selected positions. The images were analyzed using Imaris spot analysis software (Imaris 8.1; Bitplane) to track the time-dependent mobility. The 3D migration analysis was performed following the strategy developed by Wirtz and coworkers (29, 30). A minimum of 100 individual cells at each point were tracked to generate x, y, and z coordinates at each time point. These data were then sorted to include only cells that were present at time 0. From these sorted data, the time that the cells were in-frame was calculated, and the most common time was used to pick cells for tracking analysis. By choosing the time frame with the most visible cells we could maximize the sample size of cells that could be analyzed. Finally, velocity and speed profiles, MSDs, and trajectory plots were calculated using code adapted from Wirtz and coworkers (29, 30) for triplicate tracking trials (n = 3). The statistical analysis was performed using MATLAB (Mathworks, Inc.) to calculate the mean, SD, and SE of the mean. A t test was performed where appropriate to determine significance (GraphPad Prism 4.02; GraphPad Software, Inc.). Graphed data are presented as average ± SD. Significance levels were set at *P < 0.05, ^P < 0.01, and #P < 0.001 (29, 30).
For minoxidil treatment, the cells were cultured in hypoxic hydrogels as stated above for 3 d. On the third day, 0.5 mM minoxidil (dissolved in KIA cell culture media) was added to the wells and the cells were tracked for 24 h. Untreated cultures served as controls. Cell tracking and data analysis were performed as described above.
SI Materials and Methods
Materials.
Gtn (type A from porcine skin, less than 300 bloom), laccase [lyophilized powder from mushroom, ≥4.0 units (U)/mg], 3-methoxy-4-hydroxycinnamic acid (ferulic acid; FA), N-(3-dimethylaminopropyl)-N′-ethylcarbodiimide hydrochloride (EDC), N-hydroxysuccinimide (NHS), dimethyl sulfoxide (DMSO), and deuterium oxide (D2O) were supplied from Sigma–Aldrich and used as obtained without purification. Dialysis membrane (molecular cutoff = 3,500 Da) was purchased from Spectrum Laboratories.
Synthesis of Gtn-HI Hydrogels.
Gtn-HI hydrogels were synthesized by a carbodiimide-mediated coupling reaction as we previously reported (16). Before polymer synthesis, we prepared a solvent by mixing DMSO and distilled (DI) water at a 1:1 volume ratio. We dissolved Gtn (1.0 g) in 50 mL of the solvent at 40 °C. FA (0.78 g, 4.0 mmol) was dissolved in 20 mL of the solvent and activated with EDC (0.92 g, 4.8 mmol, 1.2 eq of carboxyl unit of FA) and NHS (0.64 g, 5.6 mmol, 1.4 eq of carboxyl unit of FA) at room temperature for 15 min to give amine-reactive FA molecules. The activated solution was then applied to the Gtn solution, and the conjugative chemical reaction was conducted at 40 °C. After 24 h, the reacted solution was dialyzed against DI water using a dialysis membrane (molecular cutoff = 3,500 Da) for 5 d. After dialysis, we obtained Gtn-FA polymers by freeze-drying and kept the product in a refrigerator (below 4 °C) before use. As reported previously (16), the chemical structure was confirmed using a 1H NMR spectrometer (AMX-300 NMR spectrometer; Bruker) and the degree of substitution of FA molecules was measured using an UV/Vis spectrometer (SpectraMax; Molecular Devices).
Cancer Cell Expansion and Culture Within Gtn-HI Hydrogels.
KIA [derived from a genetic murine model of sarcoma, LSL-KrasG12D/+; Ink4a/Arffl/fl as established previously (15)], KIA-GFP, KIA-HIF-1α(−), or KIA-Scr was expended under standard culture conditions (37 °C and 5% CO2) in high-glucose DMEM with 10% FBS, 1% penicillin/streptomycin (PS; Invitrogen), and 1% l-glutamine (Invitrogen). For cancer cell encapsulation, all solutions were prepared using Dulbecco’s phosphate-buffered saline (Invitrogen) and filtered for sterilization using a syringe filter with a pore size of 0.2 μm. First, we prepared cell pellets of KIA, KIA-GFP, KIA-HIF-1α(−), or KIA-Scr (1.0 × 10⁶ cells) in 1.5-mL Eppendorf tubes. We then mixed the pellets with 375 μL of polymer stock solution (4% Gtn-FA solution) by gentle pipetting to give homogeneous cell suspensions and added 125 μL of laccase stock solution (100 U/mL). After mixing the enzyme, the solution was incubated at 37 °C for 2 min and then transferred to a 96-well plate (BD Bioscience). The cells were cultured within the hydrogel matrices under standard culture conditions in KIA media. The final concentration of cells, polymers, and laccase were 1.0–2.0 × 10⁶ cells per milliliter, 3%, and 25 U/mL, respectively. The cancer cell morphology was observed by light microscopy (in phase-contrast mode) and fluorescence microscopy (BX60; Olympus).
Primary Tumor Formation, DO Measurements, and Encapsulation.
For primary tumor encapsulation, we generated mouse sarcomas through s.c. injection of 1.0 × 10⁶ cells per milliliter of KIA into nude mice. After day 10, we isolated tumors and prepared tumor disks (diameter, 3.0 mm; thickness, 0.4 mm) by biopsy punching. The tumor specimens were encapsulated within the hydrogels of difference thicknesses (hypoxic, 2.5-mm thickness; nonhypoxic, 1.25-mm thickness). For tumor encapsulation, we first prepared 5 μL of the hydrogel pad [3% Gtn-HI (wt/vol)] on a 96-well plate and then placed the tumor specimens on the pad. The mixture of polymer and laccase solutions was applied to the wells, and entire hydrogel construct was cultured under standard cell culture conditions (37 °C and 5% CO2) in KIA media (high-glucose DMEM with 10% FBS, 1% PS, and 1% l-glutamine) for up to a week. The O2 levels during the culture period were monitored using noninvasive O2 sensors as described above. For quantification of 3D tumor invasion, we took three to five images of different regions within the hydrogels using confocal z-stack analysis (>200-μm thickness) and measured the distance from the edge of tumor to the end of the tumor invading the hydrogel matrices using ImageJ software (NIH). To monitor real-time tumor invasion and migration, we encapsulated tumors generated from KIA-GFP cells. All experimental animal protocols were approved by the Institutional Animal Care and Use Committee at Johns Hopkins Medical School.
Noninvasive O2 Measurement During Cell and Tumor Graft Culture.
The DO levels were monitored noninvasively at the bottom of hydrogels using commercially available sensor patches (PreSens), as previously established (16, 27). For DO measurement, the cell suspension (75 μL of polymer and cell suspension) and laccase solution (25 μL of 100 U/mL laccase stock solution) were mixed and incubated for 2 min, and then plated on the O2 sensor attached to a 96-well plate (BD Bioscience). All measurements were performed under standard cell culture conditions (37 °C and 5% CO2) in the culture media. To vary O2 tension, we controlled the thickness of hydrogels in a volume-dependent manner. We generated hydrogels with different minimum DO levels (defined as hypoxic and nonhypoxic gels). For example, to generate hypoxic gels, we plated 100 μL (2.5-mm thickness) of a mixture that included polymer, cells, and laccase solutions into a well, whereas 50 μL (1.25-mm thickness) of the mixture was plated into the well for preparing nonhypoxic gels.
Invasive O2 Gradient Measurements.
The O2 levels in vivo were measured using a Needle-Type Housing Fiber-Optic O2 Microsensor (PreSens). These needle sensors were mounted on a micromanipulator with 10-μm precision (PreSens). Hydrogel cell constructs were generated as detailed above. Tumors were generated as previously stated, and DO measurements were performed once tumors were visible. O2 gradient measurements were performed using the needle sensor and a micromanipulator (PreSens). The tumor diameter was measured using a caliper, and the needle was placed at the center of the tumor and moved outward in 0.5-mm increments, recording a DO reading at each distance, until reaching the edge of the tumor. The volume of the tumor was calculated using the following equation:
where V is the volume of the tumor, L is the major axis of the tumor, and W is the minor axis of the tumor (28). The tumor O2 measurements were averaged, and the SE of the mean was calculated for each distance from the center of the tumor.
This same approach was used to evaluate the O2 gradient in the hydrogel at days 1, 3, 5, and 7 in the KIA-encapsulated samples. It should be noted that in vitro invasive measurements might deviate a little from noninvasive measurements because insertion of the needle can result in uncontrolled O2 penetration into the hydrogel.
Matrix Degradation, Migration Assays, and Drug Treatment.
To assess the effect of O2 levels on matrix degradation, we incorporated 10 μg/mL DQ Gtn (Invitrogen) into polymer solutions when preparing cell suspensions and then mixed the solutions with the laccase solution as described above. After day 3, the hydrogels with DQ-Gtn were observed by the fluorescence microscopy (BX60) and quantified by measuring the fluorescence intensity using a fluorescence spectrophotometer at wavelength of 495 nm excitation and 515 nm emission (Molecular Devices).
For the 3D cancer cell migration assay, we encapsulated KIA-GFP cells and tumor grafts in hydrogel to generate constructs with different O2 levels as reported previously (16). For nongradient hydrogel controls, constructs were formed and incubated in 1% O2 for 3 d and then tracked in that chamber at day 3. Cells were tracked at day 3 using live-cell 3D confocal microscopy (LSM 780; Carl Zeiss) equipped with a cell incubator (5% CO2 and 37 °C). To optimize the experiment properly, only cells that started in-frame were included, with a shorter time frame used for the tumor-encapsulated samples. The time-lapse and z-stack images (>200-μm thickness) were collected every 30 min up to 24 h at five randomly selected positions. The images were analyzed using Imaris spot analysis software (Imaris 8.1; Bitplane) to track the time-dependent mobility. The 3D migration analysis was performed following the strategy developed by Wirtz and coworkers (29, 30). A minimum of 100 individual cells at each point were tracked to generate x, y, and z coordinates at each time point. These data were then sorted to include only cells that were present at time 0. From these sorted data, the time that the cells were in-frame was calculated, and the most common time was used to pick cells for tracking analysis. By choosing the time frame with the most visible cells we could maximize the sample size of cells that could be analyzed. Finally, velocity and speed profiles, MSDs, and trajectory plots were calculated using code adapted from Wirtz and coworkers (29, 30) for triplicate tracking trials (n = 3). The statistical analysis was performed using MATLAB (Mathworks, Inc.) to calculate the mean, SD, and SE of the mean. A t test was performed where appropriate to determine significance (GraphPad Prism 4.02; GraphPad Software, Inc.). Graphed data are presented as the average ± SD. Significance levels were set at *P < 0.05, ^P < 0.01, and #P < 0.001 (29, 30).
For minoxidil treatment, the cells were cultured in hypoxic hydrogels as stated above for 3 d. On the third day, 0.5 mM minoxidil (dissolved in KIA cell culture media) was added to the wells and the cells were tracked for 24 h. Untreated cultures served as controls. Cell tracking and data analysis were performed as described above.
PLOD2 Western Blot.
Low-O2 conditions were maintained in a Ruskinn Invivo2 400 Hypoxia Work Station. Simultaneously, KIA cells were treated with vehicle or 0.5 mM minoxidil diluted in DMEM culture media (Sigma–Aldrich) for 16 h. Whole-cell lysates were prepared in SDS/Tris (pH 7.6) lysis buffer. Proteins were electrophoresed and separated by SDS/PAGE, and then transferred to nitrocellulose membranes and probed with the following antibodies: rabbit anti-GAPDH (Cell Signaling, Inc.) and rabbit anti-PLOD2 (Proteintech).
Rheological Analysis.
To analyze matrix stiffness, we performed rheological analysis of the HI hydrogels using a rheometric fluid spectrometer (RFS3; TA Instruments) as we previously reported (16). In the rheological experiments, tumor constructs cultured within HI hydrogels were plated in the instrument. We performed a dynamic time sweep on the samples after day 3 in culture. We monitored the elastic modulus (G′) and viscous modulus (G′′) at 10% of strain and a frequency of 0.1 Hz at 37 °C. A solvent trap wetted with deionized water was used to prevent sample evaporation.
Gene Expression.
To assess gene expression, we performed a quantitative real-time RT-PCR assay as described previously. Total RNA was extracted from cancer cells encapsulated in hydrogels using TRIzol (Invitrogen), according to the manufacturer’s instructions. In brief, we placed the hydrogel constructs into 500 μL of TRIzol and homogenized them using a microhomogenizer. The suspension was centrifuged at 12,000 × g for 15 min, and the supernatant was separated. We then added 100 μL of chloroform to the solution and mixed the solution manually for 20 s. The mixture was centrifuged at 12,000 × g for 10 min, and the supernatant was isolated. The solution was mixed with 250 μL of isopropyl alcohol and kept at −4 °C for 1 h. The precipitates were separated by centrifugation at 7,500 × g for 5 min and then washed using 70% ethyl alcohol (EtOH). Total RNA was quantified using an UV spectrometer and validated by lack of DNA contamination. One microgram of RNA was transcribed using reverse-transcriptase M-MLV and oligo(dT) primers (both from Promega), according to the manufacturer’s instructions. We used TaqMan Universal PCR MasterMix and Gene Expression Assay (Applied Biosystems), according to the manufacturer’s instructions for LOX, PLOD2, col1A1, and β-actin.
Histological Analysis.
For histological analysis, hydrogel constructs or tumors were harvested and fixed using 3.7% paraformaldehyde and then dehydrated in graded EtOH (80–100%). We then embedded the samples in paraffin blocks and serially sectioned them using a microtome (5 μm). The slides were stained with hematoxylin and eosin (H&E) or underwent immunohistochemistry for HIF-1α as previously described (15). For quantification of HIF-1α–positive cells in tumor sections, cells expressing nuclear HIF-1α were counted manually from 40× images (n = 8). The total number of cells in the images was counted, and the percentage of positive cells was calculated. The SD was determined and a t test was performed on the data to determine significance (GraphPad Prism 4.02). Graphed data are presented as average ± SD. Significance levels were set at P < 0.05, **P < 0.01, and ***P < 0.001.
Immunoflorescence Analysis.
Hydrogels were fixed using 3.7% paraformaldehyde and incubated at room temperature for 1 h. For staining, the cells were permeabilized with 0.05% Triton-X for 30 min, washed with PBS, and incubated with primary antibodies overnight. The primary antibody used was for collagen 1 or HIF-1α (Novus Biologicals). Certain samples were rinsed with PBS and incubated with Alexa Fluor 546 (1:500; Invitrogen) for 1 h, followed by incubation with Alexa Fluor 488 Phalloidin (1:40; Invitrogen) for 30 min, and with 4-6-diamidino-2-phenylindole (DAPI; 1:1,000; Roche Diagnostics) for 10 min. The labeled cells were examined using fluorescence microscopy (LSM 780). Collagen fluorescence intensity was analyzed using ImageJ.
Statistical Analysis.
All experiments were performed in triplicate for at least three biological replicates. We performed RT-PCR analysis in triplicate with duplicate readings. We performed statistical analysis using GraphPad Prism 4.02. For all analyses other than the live migration (the statistics of which are detailed above), the SD was determined and a t test was performed on the data to determine significance (GraphPad Prism 4.02). Graphed data are presented as average ± SD. Significance levels were set at P < 0.05, **P < 0.01, and ***P < 0.001. All graphical data were reported.
Acknowledgments
We thank Dr. Denis Wirtz for critically reviewing this manuscript and Dr. Pei-Hsun Wu for invaluable input on computing cell migration. We also thank the following investigators for generously providing mouse strains and tumor-derived cells: LSL-KrasG12D/+ (T. Jacks, MIT), Ink4a/Arffl/fl (R. DePinho, M. D. Anderson Cancer Center), and LSL-KrasG12D/+; Ink4a/Arffl/fl cells (D. Kirsch, Duke University and S. Yoon, Memorial Sloan Kettering Cancer Center). This work was supported by American Heart Association Grant 15EIA22530000 (to D.M.L.); Grant R01 CA158301 (to M.C.S.); and American Heart Association Grant 15EIA22530000, National Science Foundation Grant 1054415, and the President’s Frontier Award from Johns Hopkins University (to S.G.).
Footnotes
The authors declare no conflict of interest.
This article is a PNAS Direct Submission.
This article contains supporting information online at www.pnas.org/lookup/suppl/doi:10.1073/pnas.1605317113/-/DCSupplemental.
References
- 1.Yoon SS, et al. Angiogenic profile of soft tissue sarcomas based on analysis of circulating factors and microarray gene expression. J Surg Res. 2006;135(2):282–290. doi: 10.1016/j.jss.2006.01.023. [DOI] [PubMed] [Google Scholar]
- 2.Singer S, Demetri GD, Baldini EH, Fletcher CD. Management of soft-tissue sarcomas: An overview and update. Lancet Oncol. 2000;1:75–85. doi: 10.1016/s1470-2045(00)00016-4. [DOI] [PubMed] [Google Scholar]
- 3.Jemal A, Siegel R, Xu J, Ward E. Cancer statistics, 2010. CA Cancer J Clin. 2010;60(5):277–300. doi: 10.3322/caac.20073. [DOI] [PubMed] [Google Scholar]
- 4.Wasif N, et al. Influence of specialty and clinical experience on treatment sequencing in the multimodal management of soft tissue extremity sarcoma. Ann Surg Oncol. 2012;19(2):504–510. doi: 10.1245/s10434-011-1923-9. [DOI] [PubMed] [Google Scholar]
- 5.Italiano A, et al. Trends in survival for patients with metastatic soft-tissue sarcoma. Cancer. 2011;117(5):1049–1054. doi: 10.1002/cncr.25538. [DOI] [PubMed] [Google Scholar]
- 6.Junttila MR, de Sauvage FJ. Influence of tumour micro-environment heterogeneity on therapeutic response. Nature. 2013;501(7467):346–354. doi: 10.1038/nature12626. [DOI] [PubMed] [Google Scholar]
- 7.Quail DF, Joyce JA. Microenvironmental regulation of tumor progression and metastasis. Nat Med. 2013;19(11):1423–1437. doi: 10.1038/nm.3394. [DOI] [PMC free article] [PubMed] [Google Scholar]
- 8.Fukumura D, Jain RK. Tumor microenvironment abnormalities: Causes, consequences, and strategies to normalize. J Cell Biochem. 2007;101(4):937–949. doi: 10.1002/jcb.21187. [DOI] [PubMed] [Google Scholar]
- 9.Francis P, et al. Diagnostic and prognostic gene expression signatures in 177 soft tissue sarcomas: Hypoxia-induced transcription profile signifies metastatic potential. BMC Genomics. 2007;8:73. doi: 10.1186/1471-2164-8-73. [DOI] [PMC free article] [PubMed] [Google Scholar]
- 10.Brizel DM, et al. Tumor oxygenation predicts for the likelihood of distant metastases in human soft tissue sarcoma. Cancer Res. 1996;56(5):941–943. [PubMed] [Google Scholar]
- 11.Bertout JA, Patel SA, Simon MC. The impact of O2 availability on human cancer. Nat Rev Cancer. 2008;8(12):967–975. doi: 10.1038/nrc2540. [DOI] [PMC free article] [PubMed] [Google Scholar]
- 12.Keith B, Johnson RS, Simon MC. HIF1α and HIF2α: Sibling rivalry in hypoxic tumour growth and progression. Nat Rev Cancer. 2011;12(1):9–22. doi: 10.1038/nrc3183. [DOI] [PMC free article] [PubMed] [Google Scholar]
- 13.Smeland E, et al. Prognostic impacts of hypoxic markers in soft tissue sarcoma. Sarcoma. 2012;2012:541650. doi: 10.1155/2012/541650. [DOI] [PMC free article] [PubMed] [Google Scholar]
- 14.Shintani K, et al. Expression of hypoxia-inducible factor (HIF)-1alpha as a biomarker of outcome in soft-tissue sarcomas. Virchows Archiv. 2006;449(6):673–681. doi: 10.1007/s00428-006-0304-4. [DOI] [PubMed] [Google Scholar]
- 15.Eisinger-Mathason TS, et al. Hypoxia-dependent modification of collagen networks promotes sarcoma metastasis. Cancer Discov. 2013;3(10):1190–1205. doi: 10.1158/2159-8290.CD-13-0118. [DOI] [PMC free article] [PubMed] [Google Scholar]
- 16.Park KM, Gerecht S. Hypoxia-inducible hydrogels. Nat Commun. 2014;5:4075. doi: 10.1038/ncomms5075. [DOI] [PMC free article] [PubMed] [Google Scholar]
- 17.Kirsch DG, et al. A spatially and temporally restricted mouse model of soft tissue sarcoma. Nat Med. 2007;13(8):992–997. doi: 10.1038/nm1602. [DOI] [PubMed] [Google Scholar]
- 18.Eisinger-Mathason TS, et al. Deregulation of the Hippo pathway in soft-tissue sarcoma promotes FOXM1 expression and tumorigenesis. Proc Natl Acad Sci USA. 2015;112(26):E3402–E3411. doi: 10.1073/pnas.1420005112. [DOI] [PMC free article] [PubMed] [Google Scholar]
- 19.Makareeva E, et al. Carcinomas contain a matrix metalloproteinase-resistant isoform of type I collagen exerting selective support to invasion. Cancer Res. 2010;70(11):4366–4374. doi: 10.1158/0008-5472.CAN-09-4057. [DOI] [PMC free article] [PubMed] [Google Scholar]
- 20.Egeblad M, Rasch MG, Weaver VM. Dynamic interplay between the collagen scaffold and tumor evolution. Curr Opin Cell Biol. 2010;22(5):697–706. doi: 10.1016/j.ceb.2010.08.015. [DOI] [PMC free article] [PubMed] [Google Scholar]
- 21.Zaman MH, et al. Migration of tumor cells in 3D matrices is governed by matrix stiffness along with cell-matrix adhesion and proteolysis. Proc Natl Acad Sci USA. 2006;103(29):10889–10894. doi: 10.1073/pnas.0604460103. [DOI] [PMC free article] [PubMed] [Google Scholar]
- 22.Vandooren J, et al. Gelatin degradation assay reveals MMP-9 inhibitors and function of O-glycosylated domain. World J Biol Chem. 2011;2(1):14–24. doi: 10.4331/wjbc.v2.i1.14. [DOI] [PMC free article] [PubMed] [Google Scholar]
- 23.Lee SH, Moon JJ, Miller JS, West JL. Poly(ethylene glycol) hydrogels conjugated with a collagenase-sensitive fluorogenic substrate to visualize collagenase activity during three-dimensional cell migration. Biomaterials. 2007;28(20):3163–3170. doi: 10.1016/j.biomaterials.2007.03.004. [DOI] [PubMed] [Google Scholar]
- 24.El-Naggar AM, et al. Translational activation of HIF1α by YB-1 promotes sarcoma metastasis. Cancer Cell. 2015;27(5):682–697. doi: 10.1016/j.ccell.2015.04.003. [DOI] [PubMed] [Google Scholar]
- 25.Gilkes DM, Semenza GL, Wirtz D. Hypoxia and the extracellular matrix: Drivers of tumour metastasis. Nat Rev Cancer. 2014;14(6):430–439. doi: 10.1038/nrc3726. [DOI] [PMC free article] [PubMed] [Google Scholar]
- 26.Zuurmond AM, van der Slot-Verhoeven AJ, van Dura EA, De Groot J, Bank RA. Minoxidil exerts different inhibitory effects on gene expression of lysyl hydroxylase 1, 2, and 3: Implications for collagen cross-linking and treatment of fibrosis. Matrix Biol. 2005;24(4):261–270. doi: 10.1016/j.matbio.2005.04.002. [DOI] [PubMed] [Google Scholar]
- 27.Abaci HE, Truitt R, Tan S, Gerecht S. Unforeseen decreases in dissolved oxygen levels affect tube formation kinetics in collagen gels. Am J Physiol Cell Physiol. 2011;301(2):C431–C440. doi: 10.1152/ajpcell.00074.2011. [DOI] [PMC free article] [PubMed] [Google Scholar]
- 28.Tomayko MM, Reynolds CP. Determination of subcutaneous tumor size in athymic (nude) mice. Cancer Chemother Pharmacol. 1989;24(3):148–154. doi: 10.1007/BF00300234. [DOI] [PubMed] [Google Scholar]
- 29.Wu P-H, Giri A, Wirtz D. Statistical analysis of cell migration in 3D using the anisotropic persistent random walk model. Nat Protoc. 2015;10(3):517–527. doi: 10.1038/nprot.2015.030. [DOI] [PMC free article] [PubMed] [Google Scholar]
- 30.Wu P-H, Giri A, Sun SX, Wirtz D. Three-dimensional cell migration does not follow a random walk. Proc Natl Acad Sci USA. 2014;111(11):3949–3954. doi: 10.1073/pnas.1318967111. [DOI] [PMC free article] [PubMed] [Google Scholar]


