

This work describes a monolayer system to differentiate human pluripotent stem cells (hPSCs) into skeletal muscle cells (SkMCs) and demonstrates disease-specific phenotypes in SkMCs derived from hPSCs affected with facioscapulohumeral muscular dystrophy. This is the first human stem cell-based cellular model for a muscular dystrophy suitable for high-throughput screening and drug development.
Keywords: Embryonic stem cells, Muscular dystrophy, Pluripotent stem cells, Skeletal muscle, Induced pluripotent stem cells
Abstract
Facioscapulohumeral muscular dystrophy (FSHD) represents a major unmet clinical need arising from the progressive weakness and atrophy of skeletal muscles. The dearth of adequate experimental models has severely hampered our understanding of the disease. To date, no treatment is available for FSHD. Human embryonic stem cells (hESCs) potentially represent a renewable source of skeletal muscle cells (SkMCs) and provide an alternative to invasive patient biopsies. We developed a scalable monolayer system to differentiate hESCs into mature SkMCs within 26 days, without cell sorting or genetic manipulation. Here we show that SkMCs derived from FSHD1-affected hESC lines exclusively express the FSHD pathogenic marker double homeobox 4 and exhibit some of the defects reported in FSHD. FSHD1 myotubes are thinner when compared with unaffected and Becker muscular dystrophy myotubes, and differentially regulate genes involved in cell cycle control, oxidative stress response, and cell adhesion. This cellular model will be a powerful tool for studying FSHD and will ultimately assist in the development of effective treatments for muscular dystrophies.
Significance
This work describes an efficient and highly scalable monolayer system to differentiate human pluripotent stem cells (hPSCs) into skeletal muscle cells (SkMCs) and demonstrates disease-specific phenotypes in SkMCs derived from both embryonic and induced hPSCs affected with facioscapulohumeral muscular dystrophy. This study represents the first human stem cell-based cellular model for a muscular dystrophy that is suitable for high-throughput screening and drug development.
Introduction
Facioscapulohumeral muscular dystrophy (FSHD) is one of the most common and devastating forms of muscular dystrophy, affecting 1 in 8,000 people [1]. The pathology is initially and often asymmetrically limited to a small set of skeletal muscles and is characterized by progressive weakness and atrophy of facial, shoulder, and upper arm muscles, eventually affecting the trunk and lower extremities [2, 3].
FSHD is caused by complex genetic and epigenetic defects [2, 4]. In the vast majority of cases (95%), referred to as FSHD1, the disease is associated with an autosomal dominant contraction of the D4Z4 repeat array in the 4q35 subtelomeric region. In nonaffected individuals, this array comprises 11–100 tandem copies of the 3.3-kb D4Z4 element, whereas patients with FSHD1 only have 1–10 D4Z4 copies. However, in approximately 5% of patients, termed FSHD2, the contraction of the D4Z4 array is not observed. Although FSHD1 and 2 appear to be clinically indistinguishable, FSHD2 patients are genetically distinct, with a more complex digenic inheritance pattern [5]. The D4Z4 contraction is thought to alter chromatin structure and subsequently lead to the aberrant de-repression of several 4q35 genes, among which the retrogene double homeobox 4 (DUX4) is believed to be the main pathogenic candidate [6–8]. Although key progress in understanding the disease has been made in the last decade and a generally accepted model has emerged [9], the molecular mechanisms underlying FSHD are not fully understood and often debated. To date, no treatment is available specifically for FSHD.
One of the most challenging aspects of studying FSHD and a major limitation in drug development is the ability to model the disease in cultured cells or animal models. Because only primates have the retrogene DUX4 embedded in the D4Z4 region, the generation of animal models that recapitulate the disease has proven difficult. Several approaches have been developed to establish FSHD mouse models, mostly based on overexpression of FSHD candidate genes [10–13]. Although these mice exhibit some aspects of FSHD, none of them accurately portrays the human condition [14]. Primary myoblasts from human biopsies and ectopic DUX4 expression in mouse myogenic cells have served as cellular models for FSHD [15–18]. Although these cells have been useful for demonstrating the regulation of DUX4 and its implication in FSHD, such models are not suitable for intensive studies or high-throughput screening required for drug development. Genetically affected human embryonic stem cells (hESCs) offer a major advantage for modeling human muscular diseases. In addition to their unmodified genome, hESCs have proliferation and differentiation properties that make them an excellent source of skeletal muscle cells (SkMCs). Furthermore, hESCs provide the opportunity to investigate the early stages of pathogenesis and allow the identification of primary causes of genetic disease rather than downstream physiological effects. Until very recently, SkMC derivation from hESCs remained a challenge and often required the forced expression of myogenic factors [19–21], the generation of three-dimensional (3D) embryoid bodies/spheres [22–24], or extensive cell sorting [25]—three techniques limiting the quantity or consistency of SkMCs produced and their applications such as drug screening [26]. Differentiation methodologies have subsequently improved, and recent protocols were derived by recapitulating skeletal muscle embryonic development using small molecules [27–29]. Generally, previously published protocols necessitate a prolonged time in culture and generate SkMCs with variable efficiency.
We have developed a monolayer protocol for the differentiation of human pluripotent stem cells (hPSCs) into 70% skeletal myosin heavy chain (SkMHC)-positive skeletal muscle cells within 26 days without cell sorting or genetic manipulation. In this study, we generated mature SkMCs from three FSHD1-affected hESC lines and compared them to three unaffected hESC lines for their capacity to differentiate and cellular phenotype. One Becker muscular dystrophy (BMD)-affected hESC line was used as a disease control. We demonstrated FSHD-specific changes in FSHD1-affected hESC-SkMCs, including DUX4 expression, thinner myotubes, and genetic dysregulation. We confirmed FSHD1-specific phenotypes in SkMCs derived from two FSHD1-affected induced pluripotent stem cell (iPSC) lines. This study reveals a novel and renewable method for the study of muscular diseases and uncovers phenotypes of FSHD1-affected myotubes suitable for therapeutic screening applications.
Materials and Methods
Ethics Statement
All relevant procedures and protocols were carried out in compliance with international Guidelines for Human Embryonic Stem Cell Research (including Australian Guidelines on the use of assisted reproductive technology in clinical practice and research, the U.S. National Academies’ guidelines for hESC research 2008, and guidelines of the Steering Committee for the United Kingdom Stem Cell Bank). The project and research conducted were approved by the Genea Human Ethics Committee, a predominantly independent committee constituted according to the requirements of Australia’s National Health and Medical Research Council.
Cell Lines
Unaffected hESCs (GENEA002, GENEA015, and GENEA019), FSHD1 hESCs (GENEA049, GENEA050, and GENEA096), and BMD hESCs (GENEA058) were derived from donated embryos. Details of the derivation are presented in the supplemental online data. Patient-specific iPSCs generated from a healthy individual (line HFF) and patients with FSHD1 (lines 43.1 and 83.6) were obtained from D.G.M.’s laboratory and are described in Snider et al. [30]. All cell line details are listed in supplemental online Table 1.
Human Embryonic Stem Cell Maintenance and Differentiation
Undifferentiated hESC lines were maintained and expanded feeder-free on collagen I-coated plates (Biocoat, BD Biosciences, San Jose, CA, http://www.bdbiosciences.com) and in serum-free M2 medium (Genea Biocells, Sydney, Australia, http://www.geneabiocells.com). hESC skeletal muscle differentiation experiments were performed in a 5% O2/5% CO2 incubator, by using the commercially available Genea Biocells skeletal muscle differentiation medium. Cells were plated at 2,500 cells per cm2 onto collagen I-coated plates and maintained for 10 days in skeletal muscle induction medium containing 5% horse serum (Thermo Fisher Scientific Life Sciences, Oakwood Village, OH, https://www.thermofisher.com), 3 μM CHIR99021 (LC Laboratories, Woburn, MA, http://www.lclabs.com), 2 μM Alk5 Inhibitor (Sapphire Bioscience, Redfern, Australia, http://www.sapphirebioscience.com), 10 ng/ml human recombinant epidermal growth factor (hr-EGF) (Miltenyi Biotec, San Diego, CA, http://www.miltenyibiotec.com), 10 μg/ml insulin (Sigma-Aldrich, St. Louis, MO, http://www.sigmaaldrich.com), 0.4 μg/ml dexamethasone (Sigma-Aldrich), and 200 μM ascorbic acid (Sigma-Aldrich). At day 10, cells were dissociated with 0.05% trypsin, plated at 2,500 cells per cm2 onto collagen I-coated plates, and maintained for 8 days in skeletal myoblast medium containing 5% horse serum, 10 μg/ml insulin, 10 ng/ml hr-EGF, 20 ng/ml hr-HGF (Peprotech, Rocky Hill, NJ, http://www.peprotech.com), 10 ng/ml hr-PDGF (Peprotech), 20 ng/ml hr-bFGF (Miltenyi Biotec), 20 ug/ml oncostatin (Miltenyi Biotec), 10 ng/ml insulin-like growth factor 1 (Miltenyi Biotec), 2 μM SB431542 (Miltenyi Biotec), and 200 μM ascorbic acid. After 18 days of differentiation, cells were attained and incubated in myotube medium, containing 10 μg/ml insulin, 20 μg/ml oncostatin, 50 nM necrosulfonamide (Cellagen Technology, San Diego, CA, http://www.cellagentech.com), and 200 μM ascorbic acid. Cells were then maintained for 7 days in myotube medium.
Immunofluorescence Analysis
Cells were fixed with 10% formalin (Sigma-Aldrich, HT5011) for 15 min at room temperature and were stained for specific skeletal muscle markers using the following antibodies and dilutions. For myogenic precursors: conjugated PE-CD56 (1/200; clone B159, BD Bioscience catalog no. 561903), Pax3 (1/100; clone 274212, catalog no. MAB2457, R&D Systems, Minneapolis, MN, https://www.rndsystems.com), and Pax7 (1/100; R&D Systems, catalog no. MAB1675). For myoblasts: myogenic differentiation 1 (MyoD1; 1/200; clone 5.8A, BD Biosciences, catalog no. 554130) and Desmin (1/200; clone RD301, BD Biosciences, catalog no. 550626). For myotubes: Myogenin (1/200; clone F5D, BD Biosciences, catalog no. 556358), α-dystrophin (1/50; Developmental Studies Hybridoma Bank [DSHB], Iowa City, IA, http://dshb.biology.uiowa.edu; MANDRA-1), MF20 (1/400; DSHB MF20.c), and skMHC (1/200; DSHB A4.1025). In order to validate our analysis method, two myosin heavy chain (MHC) antibodies were used to ensure that similar results were obtained from the image analysis based on either stain. Ki67 antibody (1/400; D3B5, Cell Signaling, Beverly, MA, http://www.cellsignal.com) was used to detect proliferating cells. For pluripotency markers, Oct4 (1/200; BD Biosciences, catalog no. 560217), TRA-1-60 (1/150; BD Bioscience, catalog no. 560121), and Nanog (1/150; BD Biosciences, catalog no. 560483) antibodies were used. Appropriate Alexa Fluor secondary antibodies (Thermo Fisher Scientific Life Sciences; 1:500) were used, and nuclei were visualized with Hoechst 33342 (1/5,000; Thermo Fisher Scientific Life Sciences catalog no. H3570). For reactive oxygen species (ROS) detection, CellROX Oxidative Stress Reagents (Thermo Fisher Scientific Life Sciences, catalog no. C10444) were used. Cells were incubated for 30 minutes with CellROX Green Reagent, a probe that upon oxidation binds to DNA and exhibits fluorogenic signal in the nucleus and mitochondria of live cells. For 5-ethynyl-2′-deoxyuridine (EdU) staining, cells were treated with 1:1,000 EdU (10 mM stock in dimethyl sulfoxide) in differentiation medium for 1 hour at 37°C. Cells were fixed with 10% formalin and then treated with Click-iT Plus EdU Alexa Fluor 647 Imaging Kit (Thermo Fisher Scientific Life Sciences catalog no. 10640) as per manufacturer’s instructions. Cells were imaged by using an IN Cell Analyzer 6000 (GE Healthcare Life Sciences, Piscataway, NJ, http://www.gelifesciences.com) high-content analysis system. Developer Toolbox Version 1.9. was utilized for image analysis to determine the percentage of positively stained cells.
Myotube Morphology Analysis
Myotubes were stained by immunofluorescence with MF20 antibody as described above. Cells were imaged with the IN Cell Analyzer 6000, and myotube morphology was analyzed with Developer Toolbox Version 1.9. Briefly, myotubes were identified by drawing a circular mask determined by MF20 staining that could be analyzed to define the fiber length and the average, median, and maximal diameters. For the number of nuclei per myotube, nuclei were identified by drawing a circular mask determined by Hoechst staining. Developer Toolbox Version 1.9 software was used to define when an identified nucleus was present within a MF20 stained cell. Myotubes were counted from at least 12 random fields in three independent experiments, and the data were collated. The results are expressed as mean values ± 99% confidence. Myotubes with a width <5 µm were considered “thin myotubes.” The ratio of thin versus total myotubes is expressed in percent as mean ± SEM.
siRNA Transfections
DUX4 siRNA (siDUX4: 5′-r[GAUGAUUAGUUCAGAGA UA]d[TT]-3′) used in this study were custom synthesized (Silencer Select, Thermo Fisher Scientific Life Sciences) by using previously published sequences [16]. For a nontargeting control, we used the nontargeting Silencer Select Negative Control 1 (Thermo Fisher Scientific Life Sciences). For 1 well of a 12-well plate, 2 μl of 10 μM stock was resuspended in 100 μl of Opti-Mem (Thermo Fisher Scientific Life Sciences) and incubated for 5 min with 3 μl of Lipofectamine RNAiMax (Thermo Fisher Scientific Life Sciences). The same conditions were scaled down for transfection in 96-well plates. The mixture was added to myoblasts at day 18, when the cells were switched to myotube medium version 1.0 for terminal differentiation. Medium was changed every 2 days, and 7 days later, RNA was harvested to assess DUX4 expression by quantitative polymerase chain reaction (qPCR), and myotubes were fixed with formalin to assess their morphology.
Total RNA Extraction and Quantitative Reverse-Transcription Polymerase Chain Reaction Analysis
Total RNA was harvested from myotube cultures by using the Axyprep Multisource total RNA kit (Corning, Corning, NY, http://www.corning.com). Quality and quantity of RNA were assessed by absorbance spectroscopy (Nanodrop, Thermo Fisher Scientific Life Sciences). For DUX4 quantitative reverse-transcription polymerase chain reaction (qRT-PCR), RNA was treated with DNase in solution using Turbo DNase (Thermo Fisher Scientific Life Sciences). After quantification, 1 μg of RNA was retrotranscribed with Superscript III First-Strand Synthesis SuperMix for qRT-PCR (Thermo Fisher Scientific Life Sciences). A total of 2 μl of cDNA was used for qPCR using the SYBR GreenER qPCR SuperMix Universal kit. Real-Time PCR was run on a CFX96 Bio-Rad Real-Time PCR Detection System (Bio-Rad, Hercules, CA, http://www.bio-rad.com). Details of the reactions, cycle program, and primer sequences are described in the supplemental online data.
Whole Transcriptome Gene Expression Analysis
Total RNA samples were collected from three biological replicates of unaffected-, FSHD1-, and BMD-hESC-derived myotubes as described above. The total RNA was reverse-transcribed to cDNA and in vitro-transcribed to biotin-labeled cRNA by using the Illumina TotalPrep RNA Amplification kit (Ambion, Thermo Fisher Scientific Life Sciences). The cRNA was hybridized to Illumina HumanHT-12 v4 Expression BeadChip transcriptome-wide arrays. Probe intensities were background subtracted by using Beadstudio (Illumina, San Diego, CA, http://www.illumina.com) and normalized by using the cross-correlation method [31] on MATLAB. Gene probe sets with minimum 1.5-fold change (on a log 2 scale) and t test significance p < .05 on the average of FSHD1 or BMD samples over the average of the unaffected controls were isolated. Heatmaps of normalized fold change in gene expression on a log 2 scale were generated by using Cluster and Treeview [32], and while diagrams were produced by using Venny (http://bioinfogp.cnb.csic.es/tools/venny/index.html). Gene ontology was performed by using Ingenuity Pathway Analysis (Qiagen, Hilden, Germany, http://www.qiagen.com), and significant disease functions were identified with p < .05 by using Fisher’s exact test. The microarray data were deposited into the National Center for Biotechnology Information (NCBI) Gene Expression Omnibus (GEO) database with accession no. GSE64003. For comparison against other FSHD1 datasets, raw RNA-sequencing (RNA-seq) data were obtained for FSHD1/control biopsies and myotube samples from the NCBI GEO dataset GSE56787 [6], and sequence counts were normalized by using the total numbers of mappable reads across all samples. Affymetrix microarray data analysis [33] was conducted on of FSHD1/control myotube samples from the dataset GSE26145 and normalized by using the Cross-Correlation method [31] posterior probe set intensity summarization (Affymetrix, Santa Clara, CA, http://www.affymetrix.com). Cross-platform comparisons were carried out by matching Entrez Gene IDs, and common target genes that showed >1.5-fold change between the average of the FSHD1 versus control samples in the RNA-Seq and/or Affymetrix datasets in agreement with the Illumina data described in this study were identified.
Statistical Analysis
All experiments were performed at least three times. All values are presented as mean ± SEM, unless otherwise specified. The significance of the difference between two independent samples was evaluated by two-tailed Student’s t test. p values of .05, .01, and .001 were considered significant.
Results
Efficient Generation of Mature Skeletal Muscle Cells From hESCs
The generation of SkMCs from hPSCs in high yields and within a reasonable time frame has been challenging. In order to develop an efficient protocol for the differentiation of hPSCs into SkMCs, we used high-throughput screening and tested combinations of small molecules and growth factors for their potential to initiate and promote myogenic differentiation. To demonstrate the efficiency of our newly established monolayer system, three hESC lines were initially tested. The workflow of skeletal muscle differentiation highlighting the key factors used is shown in Figure 1A. The detailed protocol is described in Materials and Methods. Briefly, hESCs (GENEA002, GENEA019, and GENEA020) were plated at low density and with no cell-cell contact onto collagen I-coated plates, and they were exposed to a series of skeletal muscle media following a three-step process. To confirm their muscle identity, differentiating cells were stained with stage-specific muscle markers at the three steps of the differentiation process. Results from the best experiments are presented in Figure 1. After 10 days in skeletal muscle induction medium, immunofluorescence experiments with myogenic progenitor markers revealed that 80% of the cells were PAX3+, 20% were PAX7+, and 30%–40% were CD56+, indicating muscle lineage commitment (Fig. 1B, 1E). At day 18, after the second step of differentiation, 50%–60% of the cells stained positive for MYOD1, a key regulator of myogenesis, and 20% were Desmin+ (DES; muscle-specific intermediate filament), showing that the myogenic precursors developed into skeletal myoblasts (Fig. 1C, 1F). At day 26, after the third and final stage of the process, the cells differentiated further, and 50%–80% formed elongated and multinucleated myotubes that stained positive for the skeletal muscle markers myogenin, MF20 (sarcomeric myosin), dystrophin, and α-Actinin (Fig. 1D, 1G). Time-lapse recording showed hESC myoblast proliferation and differentiation into myotubes (supplemental online Movie 1). Mature myotubes were generated reproducibly and consistently from 20 different hESC lines, indicating that this method of SkMC derivation is fast, efficient, and robust. In fact, all cell lines (hESC and human induced pluripotent stem cell [hiPSC]) tested by us as well as collaborators (C.P. Emerson, Jr., personal communication) could be efficiently differentiated by this method. Another key advantage is the high yield of SkMC production. On average, from 13 experiments across 10 lines, 1 hESC resulted in approximately 2,000 myoblasts at day 18. During the fusion process, increased cell death was observed, and approximately 70% of the final population formed myotubes. This translates to 1,000–1,200 mature SkMCs arising from 1 hESC. Furthermore, cells can be passaged at the myogenic progenitor or myoblast stages, which could increase the number of myotubes generated from each hESC. However, the number of passages is limited, or cells stop proliferating. Myogenic progenitors and myoblasts can be banked, and this does not affect their differentiation capacities. HESC myotubes were also mature and functional. Twitching fibers could be observed in culture and are shown in supplemental online Movie 2.
Figure 1.

Differentiation of human embryonic stem cells (hESCs) into skeletal muscle cells. (A): Workflow of skeletal muscle differentiation of hESCs. Key factors applied are indicated for every step of the differentiation. (B–D): Bright field and immunofluorescence images of PAX3+ or PAX7+ and CD56+ myogenic precursors at day 10 (B), MYOD1+/desmin+ myoblasts at day 18 (C), and myogenin+/dystrophin+ myotubes at day 26 (D). Scale bars = 100 μm. (E–G): Quantitative analysis of PAX3+ or PAX7+ nuclei and CD56+ cells at day 10 (E), MYOD1+ nuclei and desmin+ myoblasts at day 18 (F), and myogenin+ nuclei and MF20+/dystropohin+/α-actinin+ myotubes at day 26 (G). For myotubes, results are presented as the percentage of nuclei in positive cells over total number of nuclei. Error bars represent SEM. Abbreviations: AA, ascorbic acid; Ai, Alk5 inhibitor; BF, bright field; C, CHIR99021; d0, day 0; Dex, dexamethasone; E, epidermal growth factor; F, basic fibroblast growth factor; GEN002, GENEA002; HS, horse serum; I, insulin; IG, insulin-like growth factor 1; MyoD1, myogenic differentiation 1; N, necrosulfonamide; O, oncostatin; P, platelet-derived growth factor; SB, SB431542.
Derivation of FSHD1 and BMD Affected hESC Lines
In order to develop a cellular model for FSHD, three FSHD1-affected hESC lines, (siblings GENEA049 and 050 and GENEA096) were derived from independent embryos after preimplantation genetic diagnosis. These lines carry the deletion responsible for FSHD and contain a D4Z4 array size of 22.6 kb (GENEA049 and GENEA050) and 24 kb (GENEA096), corresponding to 5 and 6 copies of the D4Z4 unit, respectively. The size of the D4Z4 repeats remained stable during culture (data not shown). In addition, we derived one hESC line affected by BMD that was used as a disease control. Three nonaffected hESC lines were also used as controls (GENEA002, GENEA015, and GENEA019). There is no familial relationship between the control and diseased lines. Their details are shown in supplemental online Table 1.
FSHD1-hESCs Efficiently Differentiate Into Skeletal Muscle Cells
To assess whether FSHD1 or BMD mutations affect the generation of SkMCs, we tested the ability of three independent FSHD1 hESC lines to differentiate into mature SkMCs and compared the outcomes to unaffected and one BMD-affected control lines. After 10 days in induction medium, no significant difference in PAX3 or PAX7 expression was observed between unaffected and FSHD1 myogenic precursor (Fig. 2A). However, a consistent 40% decrease in the number of myoblasts expressing MYOD1 was observed in FSHD myoblasts at day 18 of the differentiation (Fig. 2B). This suggests that DUX4 expression repressed MYOD1 expression in the early stage of skeletal muscle differentiation and is in agreement with numerous studies [15, 34, 35]. However, in our model, this does not affect the capacity of FSHD1 myoblasts to differentiate. After 26 days of in vitro differentiation, FSHD1-hESCs formed a well-organized network of multinucleated myotubes staining positive for MF20, dystrophin, and SkMHC (50%–70%), similarly to unaffected control cells (Fig. 2C–2F). Identical to the unaffected SkMCs, 40% of the nuclei within FSHD1 myotubes expressed myogenin (Fig. 2C–2F). Interestingly, BMD-affected hESCs showed impaired skeletal muscle differentiation, with only 30% of MF20- and SkMHC-expressing myotubes (Fig. 2D, 2E). As expected, only a small number (15%) of BMD-affected myotubes stained positive for dystrophin (Fig. 2D, 2E), consistent with the BMD-associated mutation/deletion in the dystrophin gene, causing a reduced expression of the protein [36]. These results demonstrate that FSHD1 hESCs can differentiate into skeletal muscle cells with the same efficiency as unaffected cell lines. Unlike a previous report on myotubes derived from primary FSHD1 myoblasts [37], we never observed a disorganized myotube morphology from FSHD1- hESC lines.
Figure 2.

Differentiation of FSHD1-affected hESCs into SkMCs. (A): Immunofluorescence images of PAX3 and PAX7 staining in FSHD1 myogenic precursors and quantitative image analysis of the staining in two control and two FSHD1 cell lines. (B): Immunofluorescence images of MYOD1 staining in FSHD1 myoblasts and quantitative image analysis of the staining in three controls and three FSHD1 cell lines. (C, D): Bright field and immunofluorescence images of MF20+/dystrophin+/SkMHC+ and myogenin+ hESC-derived myotubes at day 26 (d26) of the skeletal muscle differentiation process. Scale bars = 100 μm. (E, F): Quantitative image analysis of MF20+/Dysrophin+/SkMHC+ myotubes at d26 in three unaffected, three FSHD1, and one BMD hESC lines (E). Values are presented as the percentage of nuclei in positive cells over total nuclei. (F): Myogenin+ nuclei in d26 myotubes. The graphs show the mean ± SEM of the three independent experiments. (G): Skeletal muscle-specific gene expression obtained from microarray analysis of hESC myotubes at d26. Diagrams represent the normalized expression level of specific mRNA in three unaffected, three FSHD1, and one BMD hESC lines. Error bars represent the SEM of three biological replicates. See also supplemental online Figure 1. Abbreviations: BF, bright field; BMD, Becker muscular dystrophy; FSHD1, facioscapulohumeral muscular dystrophy 1; GEN050, GENEA050; hESC, human embryonic stem cell; MD, muscular dystrophy; MHC, myosin heavy chain; MyoD1, myogenic differentiation 1; NEB, nebulin; SkMCs, skeletal muscle cells; SkMHC, skeletal myosin heavy chain; TNNC1, troponin C1; TNNT3, troponin T3; TTN, titin.
Despite variability between cell lines, FSHD1-affected and unaffected lines did not show significant differences in patterns of proliferation, as demonstrated by the resulting cell numbers after each proliferative stage, in myogenic progenitors and myoblasts (supplemental online Fig. 2A). Cell-cycle kinetics were also analyzed by immunostaining against the proliferation-specific proteins Ki67 in day 10 (d10) myogenic precursors and d18 myoblasts. The vast majority of healthy and FSHD1-affected cells (90%) were positive for Ki67 and therefore actively proliferating at both stages (supplemental online Fig. 2B).
hESC-SkMCs Show Characteristics of Functional Fetal Skeletal Muscle Cells
To further validate our differentiation protocol and assess the expression profile of a larger panel of skeletal muscle markers, we performed DNA microarray analysis on undifferentiated hESCs and myotubes derived from the seven hESC lines, using Illumina HumanHT-12v4 arrays. Normalized microarray expression data are shown in Figure 2G and supplemental online Figure 1. All affected and unaffected hESC-SkMCs expressed high and comparable levels of skeletal muscle-specific genes, including the myogenesis differentiation factor myogenin (supplemental online Fig. 1), the skeletal muscle contractility genes (Fig. 2G), NEB (nebulin), TTN N2A (titin), TNNT (TroponinT), TNNI (troponinI), TNNC (troponinC), MYOM1 (myomesin; supplemental online Fig. 1), and the skeletal muscle-specific enzyme CKM (muscle specific creatine kinase; supplemental online Fig. 1). In accordance with our dystrophin immunofluorescence data (Fig. 2D, 2E), the microarray confirmed reduced expression of dystrophin in BMD myotubes (supplemental online Fig. 1). The presence of both fast-twitch (TNNI2, TNNT3, and TNNC2) and slow-twitch (TNNC1 and TNNT1) fiber-specific genes was also detected (Fig. 2C and supplemental online Fig. 1). MYH3 and MYH8 (myosin heavy chain isoforms), which are typical of fetal development and muscle regeneration, were highly expressed in all hESC-SkMC samples (supplemental online Fig. 1), suggesting that, in our system, hESCs generate early stage fetal-like muscle cells. As expected, TTN N2B (a cardiac-specific isoform of TTN) was not expressed in our skeletal muscle cells (data not shown), demonstrating the specificity of our system.
To ensure that no residual pluripotent cells remained in culture upon differentiation, we analyzed the expression of pluripotency markers Nanog, Oct4, and TRA-1-60 by immunofluorescence in hESC myoblasts, at d17 of the differentiation process before fusion into myotubes. Although the three markers were present in the vast majority of pluripotent hESCs, they were not detected in differentiating myoblasts from healthy and FSHD1 cell lines (supplemental online Fig. 3A). This was further confirmed by the microarray data in hESC myotubes. Pluripotency markers Nanog, Oct4, and Sox2 were highly expressed in all undifferentiated hESCs and completely downregulated in hESC-SkMC cultures, regardless of disease status (supplemental online Fig. 3B).
FSHD Myotubes Are Thinner and Shorter Than Controls
The morphology of both FSHD and unaffected myotubes displayed a broad range of lengths and diameters, and no obvious defects were initially observed in FSHD1 myotubes. Because several studies reported reduced diameters in FSHD muscle cells [37–39], we performed a detailed morphological analysis of hESC-SkMCs. Myotubes were stained with a MF20-specific antibody, and the width, length, and number of nuclei per myotube were analyzed by using automated high-content analysis technology. To prevent bias from any one particular experiment, we show here the mean value of the pooled data from three independent experiments. Highly consistent results from individual experiments are also presented in supplemental online Fig. 4. FSHD1 myotubes were generally thinner than the control and BMD-affected lines, with an average and median diameter of 5.5–5.8 and 5.2–5.4 μm, respectively, versus 6–6.2 and 5.6–5.8 μm for control myotubes (Fig. 3A, 3B). The maximal diameter showed a greater difference, with 10.8–12.7 μm for FSHD myotubes and 13.3–13.4 μm for control myotubes (Fig. 3C). To quantify the reduced thickness in our FSHD-SkMCs, we counted the number of myotubes with an average diameter of <5 μm that we defined as thin myotubes. Reanalysis of our data with this diameter threshold showed that 12%–23% of the FSHD myotubes were thin as compared with only 5%–8% in unaffected and 3% in BMD-affected SkMC cultures (Fig. 3D). Like BMD myotubes (324 μm), FSHD myotubes were shorter (183–377 μm) than unaffected controls (438–536 μm) (Fig. 3E). Counting the number of nuclei per myotube also showed that FSHD and BMD myotubes contained a lower number of nuclei (Fig. 3F). These data suggest that our FSHD myotubes already demonstrate cell-autonomous thin phenotypes at the fetal-like stage.
Figure 3.

FSHD-specific phenotypic changes in hESC myotubes. (A–F): hESC myotube morphology analysis. Skeletal muscle cells (SkMCs) derived from three unaffected, three FSHD1, and one BMD-affected hESC lines were stained with MF20 antibody, and myotubes were analyzed for their average (A), median (B), and maximal diameters (C) (μm). Diagrams represent the mean values of three pooled experiments ± 99% confidence. (D): Ratio of atrophic (<5 μm) versus total myotubes in hESC-SkMCs. The graph represents the mean ± SEM of three independent experiments. (E, F): Graphs showing the length of hESC myotubes (E) and the number of nuclei/myotubes (F) in the seven cell lines. Diagrams represent the mean values of three pooled experiments ± 99% confidence. Statistical analysis was performed between the mean values of each experiments to take into account the three experimental replicates. ∗∗, p < .01; ∗∗∗, p < .001. (G): Quantitative polymerase chain reaction (qPCR) analysis of DUX4 expression during differentiation of hESCs into SkMCs. RNA was harvested from three unaffected and three FSHD1-affected hESC lines at day 10 (d10), d18, and d26, the three stages of skeletal muscle differentiation. (H): qPCR analysis of ZSCAN4 and MBD3L2 expression in hESC myotubes. (I): qPCR analysis of DUX4 expression in d26 hESC myotubes transfected with DUX4 siRNA or scramble siRNA. (G–I): Ct values for DUX4, ZSCAN4, and MBD3L2 expression were normalized to Ct values for the reference gene GAPDH. (J): MF20 expression in myotubes transfected with DUX4 siRNA or scramble. (K): Myotube morphology analysis of two unaffected and two FSHD-affected cell lines transfected with DUX4 siRNA or scramble. Diagrams represent the mean values ± SEM. Statistical analysis was performed between scramble and siDUX4 values. ∗∗, p < .01; ∗∗∗, p < .001. Abbreviations: BMD, Becker muscular dystrophy; Dux4, double homeobox 4; FSHD1, facioscapulohumeral muscular dystrophy 1; GEN015, GENEA015; hESC, human embryonic stem cell; MBD3L2, methyl-CpG binding domain protein 3-like 2; siDUX4, double homeobox 4 siRNA; ZSCAN4, zinc finger and SCAN domain-containing protein 4.
Microarray Analysis Demonstrates FSHD-Specific Regulation of the D4Z4 Locus
Many expression arrays and some protein expression studies have been performed on control and FSHD muscle biopsies, but a strong molecular signature for FSHD remains to be determined [33, 40–42]. In order to identify genes and/or pathways differentially regulated in our hESC-FSHD1 myotubes, we performed DNA microarray analysis on coding and noncoding RNA from hESC myotubes as mentioned above. A total of 47,231 probes were investigated on Illumina HumanHT-12 v4 arrays. Three biological replicates, corresponding to SkMCs derived from three independent differentiation experiments, were used for each of the seven hESC lines. By using the criteria described in Materials and Methods (minimum 1.5-fold change and statistically significant at p < .05), a total of 746 genes were dysregulated in FSHD myotubes, representing 1.6% of the transcripts arrayed. As shown on the Venn diagram and the heatmap (supplemental online Fig. 5A, 5B), the majority of genes with altered expression in FSHD are not dysregulated in BMD. We observed 215 upregulated probes and 531 downregulated probes specifically in FSHD. We saw very little evidence (less than 10 genes up and down) of overlapping patterns of altered expression between the two diseases. Only 59 genes were coregulated and moving in the same directions in both FSHD1 and BMD, demonstrating that these two muscle pathologies are fundamentally different. The full list of FSHD-associated dysregulated genes is available in supplemental online Table 2.
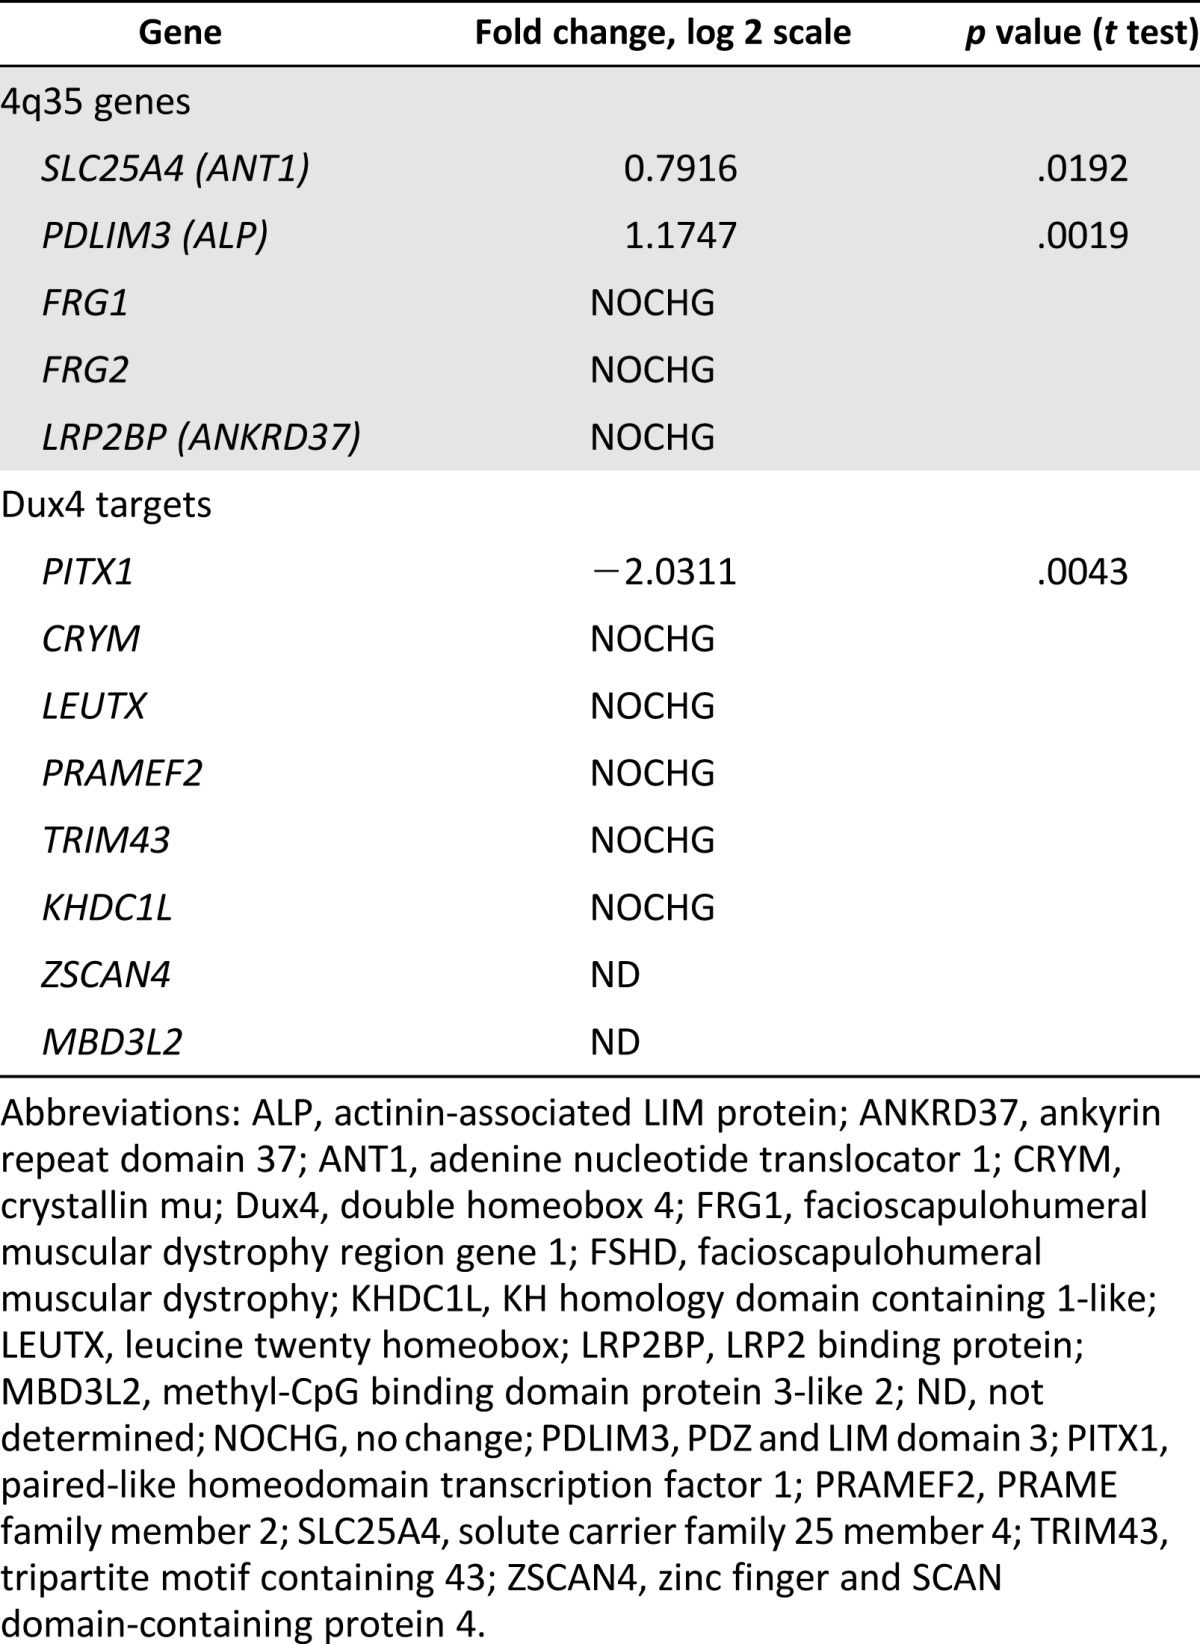
Several studies support the position-effect hypothesis in FSHD, by claiming that several genes located close to the D4Z4 locus on 4q35 are upregulated in FSHD muscle [8, 10, 43]. In our microarray study, we found that two of the genes in the 4q35 region, SLC25A4 (ANT1) and PDLIM3 (ALP), are significantly upregulated in FSHD1 myotubes (Table 1). DUX4 mRNA expression was not detected in any of the skeletal muscle samples (data not shown). This may be because of its low level of expression below the detection limit of the method [30]. However, the first identified DUX4 target, PITX1, was downregulated, as observed in one type of muscle biopsy [44]. A summary of the changes in gene expression reported to be dysregulated in FSHD is shown in Table 2. Dysregulation of the D4Z4 locus and its downstream targets is a hallmark of FSHD and validates the use of our hESC-SkMC model for the study of FSHD.
Table 1.
Example of FSHD-associated deregulated genes
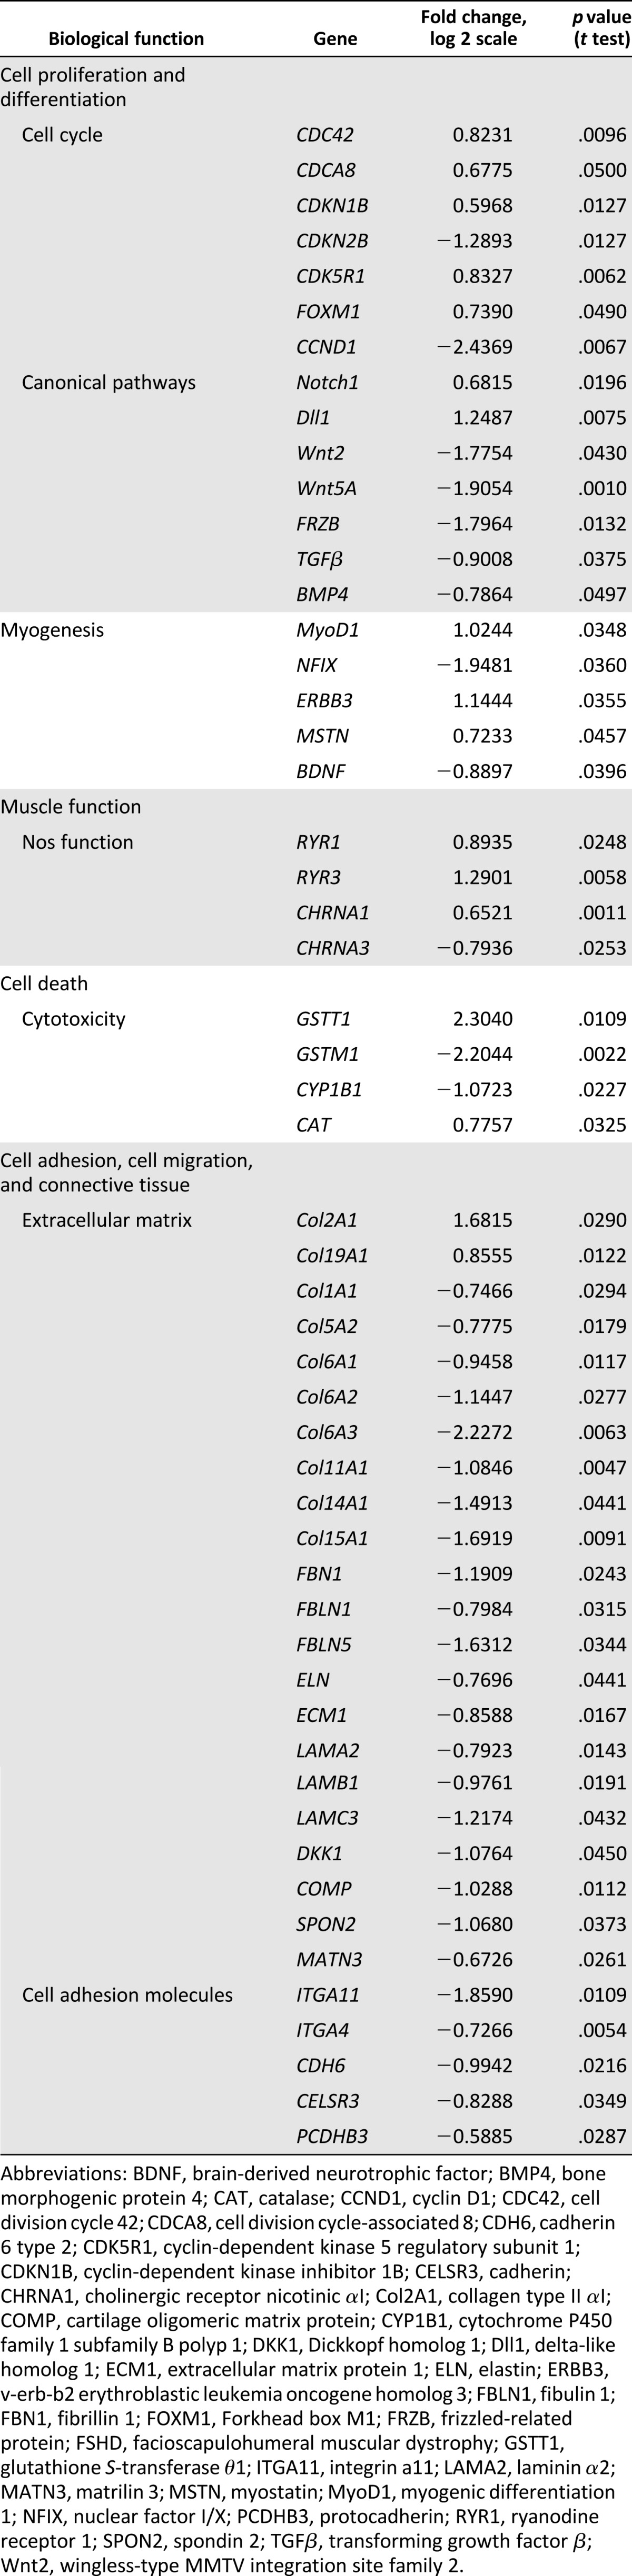
Table 2.
FSHD candidate gene expression
DUX4 Is Exclusively Expressed in FSHD1-Affected SkMCs
In healthy individuals, DUX4 expression is epigenetically suppressed in differentiated tissues [30]. Although DUX4 mechanisms of action and downstream targets are not entirely elucidated, aberrant upregulation of DUX4 in muscle is believed to be the main molecular signature of FSHD [6]. Detection of the DUX4 protein proved technically challenging because of its particularly low abundance in only a very small number of nuclei in FSHD myoblasts (1 in 1,000) and myotubes (1 in 200) [45]. We have analyzed DUX4 expression by RT-qPCR at the different stages of hESC differentiation into SkMCs (myogenic precursors, myoblasts, and myotubes). Results confirmed exclusive DUX4 expression in the three FSHD lines, with higher DUX4 expression levels in myotubes than in myoblasts, consistent with a study by Tassin et al. [45]. Interestingly, we also found a high level of DUX4 expression in FSHD1 myogenic precursors (Fig. 3G). DUX4 qPCR product was sequenced to confirm that the correct DUX4 sequence was amplified (data not shown). We also analyzed the expression of zinc finger and SCAN domain-containing protein 4 (ZSCAN4) and methyl-CpG binding domain protein 3-like 2 (MBD3L2) in hESC myotubes, two previously identified DUX4 targets [6] that were not detected in our microarray because of their low level of expression (Table 2). We confirmed the expression of ZSCAN4 and MBD3L2 exclusively in FSHD1-affected myotubes (Fig. 3H). These findings are consistent with a recent study showing that, although FSHD clinical manifestations are generally not present until midlife, molecular markers of FSHD are already expressed at the fetal stages [18]. These data further validate our hESC-SkMC system as a cellular model for FSHD.
DUX4 Expression Is Responsible for the Thin Diameters of FSHD1 Myotubes
To demonstrate that the morphological changes we observed in FSHD1 myotubes are caused by DUX4 expression, we attempted a rescue by DUX4 knockdown in FSHD1 myotubes. Myoblasts derived from two FSHD-hESC lines (GENEA049 and GENEA050) and two control lines (GENEA015 and GENEA019) were transfected with DUX4 siRNA at d18 and further differentiated into myotubes until d26. Although siRNA transfections did not affect skeletal muscle differentiation of any cell lines (Fig. 3J), a clear reduction of DUX4 transcript levels was observed in FSHD myotubes transfected with siDUX4, but not with the scrambled control (Fig. 3I). Interestingly, after differentiation, thin diameters observed in FSHD myotubes were rescued in siDUX4-transfected cells (Fig. 3K), demonstrating a correlation between DUX4 expression level and myotube diameter in the FSHD1 lines. In contrast, we did not observe a rescue of the FSHD myotube length (data not shown).
Biological Pathways Disrupted in FSHD1-hESC Myotubes
To explore which biological pathways are disrupted in FSHD1, we performed Ingenuity Pathway Analysis (IPA) of the genes that are differentially expressed by more than 1.5-fold (p < .05) between affected and unaffected myotubes. A summary of the most significantly altered biological functions and examples of dysregulated genes are represented in Table 1. Of the FSHD-specific dysregulated genes, many play a critical role in cell cycle (Cdc42, CDKN1B, CDKN2B, CDC8, and Cyclin D1) and cell proliferation/differentiation (MYOD1), with only a small minority being implicated in myogenesis. As shown in Table 1, the components of three canonical signaling pathways involved in proliferation and/or differentiation of many cell types (Notch1/Dll1, Wnt2/Wnt5A, and TGFb2/BMP4) were also found to be dysregulated in FSHD1 muscles. Several studies have demonstrated the hypersensitivity of FSHD myoblasts to oxidative stress [38, 46]. Interestingly, our microarray data showed that four genes involved in oxidative stress response were dysregulated in FSHD myotubes. The expression of the antioxidant enzymes CAT (catalase) and GSTT1 (Glutathione S Transferase 1), which has been shown to be upregulated by oxidative stress [47] and induced by DUX4 expression [6], were found to be highly increased in FSHD versus control myotubes. Finally, a large number of the significantly altered genes in FSHD muscle are components of the extracellular matrix (ECM) and cell adhesion molecules, involved in cell adhesion/migration. The list is summarized in Table 1 and includes genes encoding for collagen, laminin (LAMA2, LAMC3, and LAMB1), fibrinillin, and other ECM proteins, integrins, and cadherins. Interestingly, gene pathways involved in cell adhesion, cell migration, and ECM signaling have recently been shown to be downregulated in DUX4-expressing cells [48].
FSHD1-hESC Myotubes Have Common and Distinct Gene Dysregulation Profiles With FSHD1-Muscle Biopsy-Derived Myotubes
We compared the list of FSHD1-dysregulated genes identified in our microarray study with those previously reported to be dysregulated in FSHD1 biopsy-derived myotubes in the RNA-seq analysis performed by Yao et al. [6] and in the microarray analysis from Tsumagari et al. [33]. The latter was chosen over other FSHD1 microarray datasets because only isolated cells (myoblasts/differentiated myotubes) were analyzed and are more reflective of our cellular model than full skeletal muscle biopsies containing a mixture of nonmuscle cells. The Cheli et al. microarray study was omitted because the majority of FSHD1 dysregulated genes were found to be in myoblasts and only a small number were in myotubes [40]. Of the 746 FSHD1-dysregulated probes in our microarray data, 137 genes were also found to be dysregulated in FSHD1-biopsy-derived myotubes from the Tsumagari et al. microarray and/or Yao et al. RNA-seq datasets (supplemental online Fig. 6). Among them, GSTT1 is common to all three studies, indicating that it is a canonical target of FSHD1. PKP2 (Plakophilin 2), encoding for a protein that links cadherins to intermediate filaments in the cytoskeleton, is also common to all three studies and could suggest a dysregulation of cell adhesion/migration in FSHD1. In total, 85 genes identified in our microarray study were in agreement with the FSHD1 myotube samples of Yao et al., including 2 of the myogenesis factors (NFIX and MSTN) and 3 of the ECM genes (COL19A1, ECM1, and DKK1), whereas a smaller number of genes [21] showed agreement with the FSHD1 muscle biopsy samples. The smaller number of reproducible targets in the biopsy samples compared with the myotubes may be because of the presence of nonmuscle cells in the biopsies. A total of 49 genes from our microarray dataset were found to be in common with the microarray targets of Tsumagari et al. The remaining 609 probes identified in our study, but not reflected in the Yao et al. and Tsumagari et al. datasets, may be due to differences between the cellular models used. Although the skeletal muscle biopsies/myotubes used in the other two studies consisted of adult cells, the hESC-myotube model we developed is embryonic in nature. Consequently, the dysregulated genes identified here are distinct from those previously reported in biopsies or primary myoblast derivatives. Our stem cell-based model may better recapitulate the early stages of the disease and could be more useful in identifying consistent gene dysregulations that are important for the onset or predisposition of the disease. In adult biopsies/myotubes, the original FSHD1 phenotypes may be obscured by adaptive or epigenetic changes that occur over time in the later-stage development of the disease. Some of the lack of consistency between our data and the RNA-seq study from Yao et al. may be further explained by the comparison of our microarray data to the more sensitive RNA-seq method that can detect lower levels of gene expression and dysregulation (e.g., in the case of ZSCAN4 and MBD3L2).
Validation of FSHD1 Microarray Target Genes
To confirm the FSHD1 microarray data, we performed RT-qPCR on myotubes derived from two FSHD1 hESC lines (GENEA049 and GENEA050) and compared them against two unaffected control lines (GENEA015 and GENEA019). We focused on the 4q35 locus genes ANT1 and PDLIM3, DUX4 target PITX1, and genes representative of three biological functions and signaling pathways identified by IPA: GSTT1, Notch1, Dll1, and MSTN. Using only independent cDNAs not subjected to the microarray experiments, we validated seven sets of microarray-determined FSHD1-associated differences in gene expression. As shown in Figure 4A, all genes tested by RT-qPCR showed reproducible upregulation and downregulation consistent with the microarray findings.
Figure 4.

Validation of microarray. (A): qPCR analysis of seven FSHD1-deregulated genes identified by the microarray in two unaffected and two FSHD myotubes. Ct values for PDLIM3, ANT1, PITX1, GSTT1, Notch1, Dll1, and MSTN expression were normalized to Ct values for the reference gene GAPDH. (B): Endogenous ROS levels in hESC myotubes from two unaffected and two FSHD1 cell lines. Myotubes were incubated with CellRox Green reagent for 30 minutes. Under identical imaging conditions, green fluorescence was increased in FSHD1 myotubes as confirmed by quantification of the staining (right). Values represent the number of fluorescent cells in culture, and data correspond to the mean values ± SEM. Statistical analysis was performed between the mean values of three independent replicates. ∗∗∗, p < .001. Scale bars = 100 μm. (C): Cell proliferation assay in hESC-derived skeletal muscle cells (SkMCs). Quantitative analysis of EdU-positive cells in myotube cultures derived from three unaffected, three FSHD1, and one BMD-affected hESC lines. Diagram represents mean values ± SEM of three experiments. Statistical analysis was performed between the mean values of three independent replicates. ∗∗, p < .01. Immunofluorescence images of EdU staining are presented in supplemental online Figure 6B. (D): Immunofluorescent images of MYOD1, PAX3, and PAX7 staining in hESC-myotube cultures. Scale bars = 100 μm. (E): Immunofluorescent image of Ki67 staining in hESC-myotube cultures. Scale bar = 100 μm. (F): Quantitative analysis of MYOD1-, PAX3-, and PAX7-positive nuclei over the total number of nuclei. (G): Quantitative analysis of Ki67-positive nuclei over the total number of nuclei. Statistical analysis was performed between the mean values of three independent replicates. ∗∗∗, p < .001. (H): Quantitative analysis of Ki67+ nuclei over the total number of MYOD1+, PAX3+, or PAX7+ nuclei. Diagrams represent mean values ± SEM. Abbreviations: ANT1, adenine nucleotide translocator 1; BMD, Becker muscular dystrophy; Dll1, delta-like homolog 1; EDU, 5-ethynyl-2′-deoxyuridine; FSHD1, facioscapulohumeral muscular dystrophy 1; GSTT1, glutathione S-transferase θ1; hESC, human embryonic stem cell; MHC, myosin heavy chain; MSTN, myostatin; MyoD1, myogenic differentiation 1; PDLIM3, PDZ and LIM domain 3; PITX1, paired-like homeodomain transcription factor 1; ROS, reactive oxygen species.
Because several genes involved in oxidative stress response were dysregulated in our model, we performed a ROS detection assay on healthy and FSHD1 myotubes using a specific fluorogenic probe (Materials and Methods). Under the same imaging conditions, we detected a higher level of endogenous ROS in FSHD1 myotubes (27%–40% fluorescence-positive cells) than in control cells (16%–18%; Fig. 4B) that could be correlated with the increase of ROS detoxification enzymes GSTT1 and CAT and is consistent with the higher level of oxidative stress observed in skeletal muscles of FSHD patients [49]. The specificity of the staining was confirmed by the increased number of fluorescence-positive cells observed in both healthy and FSHD1 myotubes after 30 minutes of exposure to 25 μM pyocyanin (supplemental online Fig. 7A).
To investigate the biological relevance of the FSHD-associated dysregulation of cell-cycle genes observed on the microarray, we performed a cell proliferation assay on myotube cultures, using EdU staining. As shown in Figure 4C and supplemental online Figure 7B, only 3%–6% of cells stained positive for EdU in nonaffected and BMD control myotube cultures. However, FSHD myotube cultures presented a higher number of proliferating cells, with 10%–12% EdU-positive nuclei. Although DUX4 siRNA knockdown had no effect on cell proliferation in unaffected SkMC, the number of proliferating cells was reduced in FSHD1-SkMCs transfected with siDUX4 (supplemental online Fig. 7C), demonstrating a correlation between DUX4 expression level and cell proliferation in the FSHD1 lines. This result is consistent with increased expression of Notch signaling components (Notch1 and DLL1) observed in FSHD1-SkMCs (Table 1) and suggests the dysregulation of cell proliferation as an early phenotype in FSHD.
In order to identify the nature of the proliferative cells in myotube cultures, we investigated the identity of the unfused cells in culture at d26. Because myotubes are usually surrounded by undifferentiated myogenic cells in culture, we analyzed the expression of the early myogenic markers PAX3, PAX 7, and MYOD1 in two controls and two FSHD1 lines. Results showed that in unaffected cell lines, 15% of the nuclei were MYOD1+, whereas 5%–20% were PAX3+ and only 4%–10% were PAX7+. In FSHD1 myotube cultures, 27%–35% of the nuclei were MYOD1+, whereas only 8% were PAX3+ and 5%–7% were PAX7+ (Fig. 4D, 4F). These results show that, although differentiation efficiency is similar in all cell lines (65%–70% MHC+ nuclei), the number of MYOD1-expressing cells is increased in FSHD1 myotube cultures and correlates with the FSHD1-specific upregulation of MYOD1 mRNA detected in our microarray analysis (Table 1). PAX3 and PAX7 were exclusively detected in the nuclei of mononucleated unfused cells (Fig. 4D). However, as indicated by the white arrow in Figure 4D, a small proportion of MYOD1+ nuclei were found within myotubes and are not exclusive to the unfused population. To identify and determine the proportion of proliferating cells in each population (MYOD1+, PAX3+, and PAX7+), we performed coimmunostaining with a Ki67 antibody. As expected, Ki67+ nuclei were only detected in unfused cells, and not in MHC+ myotubes (Fig. 4E). The number of Ki67+ cells was increased in the two FSHD1 myotube cultures, with 3%–6% of the cells being proliferative in control lines versus 11%–13% in FSHD1 lines, confirming the EdU results (Fig. 4G). Quantification of the coimmunostaining revealed that in healthy lines, 5% of MYOD1+ cells, 2%–5% of PAX3+, and 2%–5% of PAX7+ cells were Ki67+, indicating that only a small proportion of the myogenic undifferentiated cells were proliferating. In FSHD1-myotube cultures, the percentages of Ki67+ cells were increased to 10%–12% for MYOD1+, 7% for PAX3+, and 10%–13% for PAX7+ cells, demonstrating an increase of proliferation in each population of unfused cells (Fig. 4H; supplemental online Fig. 7D). A fraction of proliferative cells remains unidentified in our study, but they are in all likelihood myogenic cells at an intermediate stage and expressing myogenic markers that we have not tested.
FSHD-hiPSC-SkMCs Share Similar Phenotypes With FSHD-hESC-SkMCs
Induced pluripotent stem cells represent an alternative patient-specific source of SkMCs that share common characteristics with hESCs and may be exploited for clinical applications. We assessed whether three independent patient-specific iPSC lines, including one control (HFF) and two affected with FSHD1 (FSHD-43.1 and FSHD-83.6) [30], could be differentiated into SkMCs using our established skeletal muscle differentiation protocol. As for hESC lines, there is no familial relationship between the control and the disease lines. Details of the hiPSC lines are presented supplemental online Table 1. Cells were exposed to the series of skeletal muscle media as described in Materials and Methods. After 26 days of differentiation, we found 40%–60% MF20+, Dystrophin+, and SkMHC+ multinucleated myotubes in differentiated cultures derived from the three hiPSC lines (Fig. 5A). As in hESC, FSHD-hiPSCs differentiated into SkMCs with the same efficiency as the unaffected control line (Fig. 5A), and FSHD myotubes exclusively expressed DUX4, ZSCAN4, and MBD3L2 mRNAs (supplemental online Fig. 8A). The two 4q35 genes ANT1 and ALP were also upregulated in FSHD1-hiPSC myotubes (supplemental online Fig. 8B). In order to characterize the FSHD-hiPSC-derived SkMCs and determine whether they exhibit the same FSHD-specific changes as FSHD-hESC-derived SkMCs, we performed a detailed analysis of hiPSC myotube morphology, as described above. As observed in hESCs, FSHD-hiPSC myotubes were thinner than unaffected myotubes, with smaller average, median, and maximal diameters (Fig. 5B). Our data showed that 8%–12% of FSHD-hiPSC myotubes appeared thin (<5 μm), compared with only 4% of control myotubes (Fig. 5C). FSHD-hiPSC myotubes were also shorter than unaffected ones, with an average length of 415–421 μm versus 566 μm, respectively (Fig. 5D), and showed a smaller number of nuclei per myotube (Fig. 5E). Results of individual experiments are also shown in supplemental online Figure 7C. Lastly, to assess the cell-cycle dysregulation in FSHD-hiPSC lines, we performed a cell proliferation assay on hiPSC-SkMCs. As observed in hESCs, EdU staining revealed a higher number of proliferating cells in FSHD-hiPSC-SkMCs (18%) than unaffected hiPSC-SkMCs (8%) (Fig. 5F, 5G). Together, these results show that hiPSCs can be efficiently differentiated into SkMCs by using our monolayer culture system. Reassuringly, FSHD-hiPSC-SkMCs also share similar disease-specific phenotypes with FSHD-hESC-SkMCs.
Figure 5.

Differentiation of FSHD1-human induced pluripotent stem cells (hiPSCs) into skeletal muscle cells (SkMCs). (A): Bright field and immunofluorescence images of hiPSC myotubes stained with MF20, dystrophin, and SkMHC antibodies at day 26 (d26) of skeletal muscle differentiation. Scale bars = 100 μm. The graph represents the quantitative analysis of the immunostaining and shows the marker positive cells as the percentage of total cells. Diagram represents the mean ± SEM of three independent experiments. (B–E): hiPSC-myotube morphology analysis. SkMCs derived from one unaffected and two FSHD1 hiPSC lines were stained with MF20 antibody, and myotubes were analyzed for their average, median, and maximal diameters (μm) (B). Diagrams represent the mean values of three pooled experiments ± 99% confidence. (C): Ratio of atrophic (<5 μm) versus total myotubes in hiPSC-SkMCs. The graph represents the mean ± SEM of three independent experiments. (D, E): Graphs showing the length of hiPSC myotubes (D) and the number of nuclei/myotubes in the three cell lines (E). Diagrams represent the mean values of three pooled experiments ± 99% confidence. Statistical analysis was performed between the mean values of each experiments to take into account the three experimental replicates. ∗∗, p < .01; ∗∗∗, p < .001. (F): Immunofluorescence images of EdU staining in myotube cultures derived from one unaffected and FSHD1-affected hiPSC line. Scale bars = 100 μm. (G): Quantitative analysis of EdU-positive cells. Diagram represents mean values ± SEM of three experiments. Abbreviations: BF, bright field; EdU, 5-ethynyl-2′-deoxyuridine; FSHD1, facioscapulohumeral muscular dystrophy 1; HFF, control cell line HFF; SkMHC, skeletal myosin heavy chain.
Discussion
In the last decade, there has been remarkable progress in the field of hPSC research. Their unlimited self-renewal and differentiation capacity has brought considerable attention and opportunities to use hPSCs as a cellular source for regenerative medicine, disease modeling, and drug screening platforms. Although patient-specific hiPSCs have been prepared from FSHD patients, skeletal muscle differentiation has not been reported [30]. Although disease-specific iPSCs and hESCs should have very similar properties, a recent publication indicates that hESCs are superior to hiPSCs and represent the “gold standard” [50]. Furthermore, FSHD is modulated by epigenetic changes. It is not clear yet whether FSHD-related epigenetic signatures are effectively erased during cellular reprogramming and how that might affect disease phenotypes during development. Therefore, hESCs seem a better choice to model FSHD and should at least be used side-by-side with hiPSCs. Here we report a hESC-based cellular model for FSHD. We show, for the first time, that SkMCs derived from FSHD-affected hESCs undergo changes reflective of FSHD pathology and therefore constitute useful tools in both basic research and novel drug discovery. We further demonstrate similar disease-specific phenotypes in two FSHD-affected hiPSC lines.
Although some insights into FSHD have been generated in murine models, it is becoming increasingly clear that there are important differences between the two species in regard to principles and pathways of myogenesis, and that no mouse model accurately reflects the human condition [14]. The development of a human stem cell model offers a new approach for the primary study of FSHD and human muscular disorders in general and could have an important impact on the development of new therapies. Efforts to generate human cellular models for FSHD have suffered from an absence of a renewable source of SkMCs and an inability to generate SkMCs in vitro. Although a number of protocols are now available for the generation of SkMCs from hPSCs, most of these methods involve an intermediate stage of a 3D embryoid body or sphere formation [22–24] and/or cell sorting [25], two approaches that are labor-intensive and offer limited scalability. Although each of these methods represents a significant advance in the field, none are easily scalable to the extent required for disease modeling, high-throughput screening, or cell therapy. Here we report a simple, but highly efficient, three-step process for the differentiation of hPSCs into mature SkMCs. One major advantage of our monolayer system is that a large quantity of SkMCs can be prepared without additional manipulations, such as forced expression of myogenic genes or cell sorting. Because they are highly proliferative, myogenic progenitors and myoblasts can be expanded on a large scale through commonly used passaging methods and provide a large amount of differentiated myotubes. The simplicity and high efficiency of our method lends itself to automation and large-scale production. We typically produce more than 75 million SkMCs, starting from 6 × 10⁴ hPSCs, demonstrating the efficiency and scalability of our system. Skerjanc and colleagues first published an embryoid body (EB)-based protocol that demonstrated the capacity of hESCs to differentiate into SkMCs in vitro, but resulted in a poor myogenic induction and low numbers of myogenic precursors (7%) and SkMCs (4%) [24]. A promising chemically defined monolayer approach was later reported by Borchin et al., but still produced a low yield of myogenic cells and required the purification of PAX3+/PAX7+ myogenic precursors (18%) or AchR+ myocytes (8%) from a heterogeneous cell population [25]. As an alternative to EB formation, Hosoyama et al. presented a new suspension-culture technique, called “EZ sphere,” to direct skeletal myogenesis in hESCs. Although this technique improved the myogenic induction and differentiation (30% MHC+ cells after 8 weeks), it also resulted in a mixed population of myogenic (20%) and neuronal precursors (30%) in the EZ sphere [23]. A different method was established by Maffioletti et al. for the derivation and inducible differentiation of myogenic cells from hPSCs. Despite its high efficiency (up to 90% MHC+ cells), this lengthy protocol requires the use of an integrating lentiviral vector encoding for MyoD1 to induce myogenic differentiation, which represents a major limitation for SkM production [21]. Recently, Shelton et al. reported a scalable protocol that generates 50% SkMCs without EB formation, cell sorting, or genetic manipulations. Nonetheless, myotubes appear only after 50 days of differentiation [28, 29],s whereas mature myotubes are formed within less than 26 days in our system. Besides, it is not clear whether this method is adaptable to all hPSCs because others have failed to reproduce their results using hiPSCs [27]. While we were preparing this study for publication, a monolayer and serum-free skeletal muscle differentiation protocol for mouse and human PSC was published by Chal et al. [27]. Although their method seems highly efficient in terms of percentage of muscle fibers produced, it is not scalable because a yield of only 50,000–70,000 SkMCs can be obtained from seeding 75,000 hPSCs. At present, we can only speculate on the reasons for this because the two methods share some similarities. However, we do find the use of Dulbecco’s modified Eagle’s medium with knockout serum replacement (as used by Chal et al.) to be antagonistic to high yields of SkMCs in our protocol (unpublished data). Furthermore, the authors report differentiation to human myotubes from only three iPSC lines [27]. In contrast, we and other groups have successfully differentiated more than 20 hPSC lines using our method. The relatively short time of our skeletal muscle differentiation process and its high yield of SkMC production represent a significant advance in the field. Furthermore, our system is robust, applicable to a variety of hESCs and hiPSCs. It is highly reproducible, with small variability between cell lines and experiments, as demonstrated by the consistency of marker expression and microarray results. Our skeletal muscle differentiation protocol is therefore suitable for high-throughput screening and drug development.
Using our system, we have developed a cellular model for FSHD and show, for the first time, disease-specific phenotypes in hPSC-SkMCs affected with FSHD. Many studies have addressed the dysregulation of 4q35 genes, proximally located to the D4Z4 region, with inconclusive results. In our study, three of the 4q35 FSHD locus genes (DUX4, ANT1, and PDLIM3) were dysregulated. Interestingly, upregulation of PDLIM3 was observed in fetal FSHD biopsies [51], but no noticeable changes were reported in adults [52, 53], correlating with the embryonic nature of our model. Consistent with other studies [42, 44, 52], no significant elevation of FRG1, FRG2, and LRP2BP expression was detected in FSHD myotubes. However, we cannot exclude low levels of dysregulation that are beyond the sensitivity of our microarrays. Also, we cannot exclude the possibility that some of the 4q35 genes (i.e., FRG1) may be transiently dysregulated during intermediate steps of the differentiation process that we have not tested [54].
It has been previously claimed that in FSHD muscles, DUX4 initiates a gene dysregulation cascade, causing muscle atrophy and oxidative stress [38, 39], and in some cases, differentiation defects [52]. In our FSHD model, despite a clear reduction of MYOD1-expressing cells at the myoblast stage, we did not observe any differentiation defect, but noticed an alteration of the fusion process, resulting in shorter myotubes and a smaller number of nuclei per myotube. We confirmed FSHD-specific DUX4 expression, thinner myotubes, and dysregulation of genes related to oxidative stress response, three key FSHD features. A higher level of endogenous ROS was also detected in FSHD1 myotubes, supporting the idea that oxidative stress caused by ROS imbalance might play a role in FSHD pathophysiological mechanisms [34, 49, 55]. Although we did not detect any significant cell proliferation changes during the FSHD1-hESC differentiation process, we did find a higher number of proliferative cells in FSHD1-hESC myotube cultures. This finding appear to be in contradiction with the blockage of cell cycle progression observed in FSHD1 patient myoblasts [40]. The different cellular models (adult vs. embryonic) and/or myogenic stages (myoblasts vs. myotubes) tested could explain this discrepancy. Nonetheless, our study supports the growing idea of cell cycle dysregulation in FSHD1 [40, 56]. Also, the lower number of MYOD1+ cells at the myoblast stage followed by the higher number of MYOD+ cells observed at a later stage in FSHD1-myotube cultures could suggest a slight delay in the differentiation process of FSHD1-hESCs. This hypothesis should be investigated in future studies. Lastly, in a recent publication, Banerji et al. identified Wnt signaling, via β-catenin, as one of the key pathways disturbed in FSH, as well as actin cytoskeleton signaling and ROS. Our study revealed the same important pathways, although a direct side-by-side comparison of the data is not possible because of the different methodology [57]. Together, our results recapitulate some of the previously reported defects of FSHD1 and could provide new insights into the early events of the disease.
We noted similar effects in our three FSHD hESC lines and two hiPSC lines, although GEN096 showed a milder phenotype. The five FSHD-hPSC lines reported here have low D4Z4 copy number (5–6 repeats). It has been suggested that patients with high copy number (7–10 repeats) show much greater clinical variability in severity of phenotype. It would be interesting to see whether cell lines with higher D4Z4 copy number display a greater variability of phenotypes. Unfortunately, such cell lines were not available and, to our knowledge, have not been reported in the literature. Moreover, an isogenic correction of one of the FSHD-hPSC lines would be the best control to demonstrate the correlation between DUX4 expression and morphological changes in FSHD myotubes. However, in the case of FSHD, gene editing to modulate the number of D4Z4 repeats would be difficult because of the presence of repeat sequences in the D4Z4 array chromosome 4 and its duplication on chromosome 10.
Conclusion
We have developed an efficient and robust monolayer culture system that enables the scalable production of skeletal muscle cells from hPSCs in a reasonable time frame and without genetic manipulation. This method, when combined with our bank of disease-affected hESC lines (http://www.geneastemcells.com.au), allows us to produce disease-specific human SkMCs with broad applications in modeling muscular diseases. Using this strategy, we have demonstrated, for the first time, FSHD-specific molecular and morphological phenotypes in hPSC-derived SkMCs. Those data are the basis for the development of high-content phenotypic assays and promise great potential for cell-based drug screening. This unique cellular model will be a useful resource for FSHD research, help to better understand the disease mechanism, and ultimately assist in the development of effective treatments.
Supplementary Material
Acknowledgments
We thank the couples who consented to donate their embryos to research for the derivation of hESC lines; Dr. Alan Colman for critical review of the manuscript; Dr. Mauricio Cabral-da-Silva for assistance with formatting the manuscript; and FSHD Global Research Foundation for their financial support. K.L.L., H.Y., J.L., and L.P. are supported by the National Research Foundation Singapore, the Singapore Ministry of Education under the Research Centres of Excellence initiative, and the Swedish Research Council (L.P.). L.C. received a Bill Moss AM fellowship (FSHD Global Research Foundation Grant 13).
Author Contributions
L.C.: conception and design, collection and/or assembly of data, data analysis and interpretation, manuscript writing, final approval of manuscript; D.K.: collection and/or assembly of data, data analysis and interpretation; K.L.L., J.L., H.Y., and D.G.: data analysis and interpretation; R.M., B.D., A.H., H.M., G.F., and L.M.P.: collection and/or assembly of data; L.P. and D.G.M.: provision of study material or patients; U.S.: conception and design, data analysis and interpretation, final approval of manuscript.
Disclosure of Potential Conflicts of Interest
L.C. and U.S. are employees of Genea Biocells and have uncompensated intellectual property rights. D.K., R.M., B.D., A.H., and H.M. are employees of Genea Biocells. The other authors indicated no potential conflicts of interest.
References
- 1.Deenen JC, Arnts H, van der Maarel SM, et al. Population-based incidence and prevalence of facioscapulohumeral dystrophy. Neurology. 2014;83:1056–1059. doi: 10.1212/WNL.0000000000000797. [DOI] [PMC free article] [PubMed] [Google Scholar]
- 2.Cabianca DS, Gabellini D. The cell biology of disease: FSHD: Copy number variations on the theme of muscular dystrophy. J Cell Biol. 2010;191:1049–1060. doi: 10.1083/jcb.201007028. [DOI] [PMC free article] [PubMed] [Google Scholar]
- 3.Pandya S, King WM, Tawil R. Facioscapulohumeral dystrophy. Phys Ther. 2008;88:105–113. doi: 10.2522/ptj.20070104. [DOI] [PubMed] [Google Scholar]
- 4.Neguembor MV, Gabellini D. In junk we trust: Repetitive DNA, epigenetics and facioscapulohumeral muscular dystrophy. Epigenomics. 2010;2:271–287. doi: 10.2217/epi.10.8. [DOI] [PubMed] [Google Scholar]
- 5.Lemmers RJ, Tawil R, Petek LM, et al. Digenic inheritance of an SMCHD1 mutation and an FSHD-permissive D4Z4 allele causes facioscapulohumeral muscular dystrophy type 2. Nat Genet. 2012;44:1370–1374. doi: 10.1038/ng.2454. [DOI] [PMC free article] [PubMed] [Google Scholar]
- 6.Yao Z, Snider L, Balog J, et al. DUX4-induced gene expression is the major molecular signature in FSHD skeletal muscle. Hum Mol Genet. 2014;23:5342–5352. doi: 10.1093/hmg/ddu251. [DOI] [PMC free article] [PubMed] [Google Scholar]
- 7.Lemmers RJ, van der Vliet PJ, Klooster R, et al. A unifying genetic model for facioscapulohumeral muscular dystrophy. Science. 2010;329:1650–1653. doi: 10.1126/science.1189044. [DOI] [PMC free article] [PubMed] [Google Scholar]
- 8.Gabellini D, Green MR, Tupler R. Inappropriate gene activation in FSHD: A repressor complex binds a chromosomal repeat deleted in dystrophic muscle. Cell. 2002;110:339–348. doi: 10.1016/s0092-8674(02)00826-7. [DOI] [PubMed] [Google Scholar]
- 9.Tawil R, van der Maarel SM, Tapscott SJ. Facioscapulohumeral dystrophy: The path to consensus on pathophysiology. Skelet Muscle. 2014;4:12. doi: 10.1186/2044-5040-4-12. [DOI] [PMC free article] [PubMed] [Google Scholar]
- 10.Gabellini D, D’Antona G, Moggio M, et al. Facioscapulohumeral muscular dystrophy in mice overexpressing FRG1. Nature. 2006;439:973–977. doi: 10.1038/nature04422. [DOI] [PubMed] [Google Scholar]
- 11.Krom YD, Thijssen PE, Young JM, et al. Intrinsic epigenetic regulation of the D4Z4 macrosatellite repeat in a transgenic mouse model for FSHD. PLoS Genet. 2013;9:e1003415. doi: 10.1371/journal.pgen.1003415. [DOI] [PMC free article] [PubMed] [Google Scholar]
- 12.Pandey SN, Cabotage J, Shi R, et al. Conditional over-expression of PITX1 causes skeletal muscle dystrophy in mice. Biol Open. 2012;1:629–639. doi: 10.1242/bio.20121305. [DOI] [PMC free article] [PubMed] [Google Scholar]
- 13.Dandapat A, Bosnakovski D, Hartweck LM, et al. Dominant lethal pathologies in male mice engineered to contain an X-linked DUX4 transgene. Cell Reports. 2014;8:1484–1496. doi: 10.1016/j.celrep.2014.07.056. [DOI] [PMC free article] [PubMed] [Google Scholar]
- 14.Lek A, Rahimov F, Jones PL, et al. Emerging preclinical animal models for FSHD. Trends Mol Med. 2015;21:295–306. doi: 10.1016/j.molmed.2015.02.011. [DOI] [PMC free article] [PubMed] [Google Scholar]
- 15.Bosnakovski D, Xu Z, Gang EJ, et al. An isogenetic myoblast expression screen identifies DUX4-mediated FSHD-associated molecular pathologies. EMBO J. 2008;27:2766–2779. doi: 10.1038/emboj.2008.201. [DOI] [PMC free article] [PubMed] [Google Scholar]
- 16.Block GJ, Narayanan D, Amell AM, et al. Wnt/β-catenin signaling suppresses DUX4 expression and prevents apoptosis of FSHD muscle cells. Hum Mol Genet. 2013;22:4661–4672. doi: 10.1093/hmg/ddt314. [DOI] [PMC free article] [PubMed] [Google Scholar]
- 17.Sharma V, Harafuji N, Belayew A, et al. DUX4 differentially regulates transcriptomes of human rhabdomyosarcoma and mouse C2C12 cells. PLoS One. 2013;8:e64691. doi: 10.1371/journal.pone.0064691. [DOI] [PMC free article] [PubMed] [Google Scholar]
- 18.Ferreboeuf M, Mariot V, Bessières B, et al. DUX4 and DUX4 downstream target genes are expressed in fetal FSHD muscles. Hum Mol Genet. 2014;23:171–181. doi: 10.1093/hmg/ddt409. [DOI] [PubMed] [Google Scholar]
- 19.Darabi R, Arpke RW, Irion S, et al. Human ES- and iPS-derived myogenic progenitors restore DYSTROPHIN and improve contractility upon transplantation in dystrophic mice. Cell Stem Cell. 2012;10:610–619. doi: 10.1016/j.stem.2012.02.015. [DOI] [PMC free article] [PubMed] [Google Scholar]
- 20.Rao L, Tang W, Wei Y, et al. Highly efficient derivation of skeletal myotubes from human embryonic stem cells. Stem Cell Rev. 2012;8:1109–1119. doi: 10.1007/s12015-012-9413-4. [DOI] [PubMed] [Google Scholar]
- 21.Maffioletti SM, Gerli MF, Ragazzi M, et al. Efficient derivation and inducible differentiation of expandable skeletal myogenic cells from human ES and patient-specific iPS cells. Nat Protoc. 2015;10:941–958. doi: 10.1038/nprot.2015.057. [DOI] [PubMed] [Google Scholar]
- 22.Hwang Y, Suk S, Lin S, et al. Directed in vitro myogenesis of human embryonic stem cells and their in vivo engraftment [published correction appears in PLoS One 2013;8:10.1371/annotation/b02313dc-840f-4f03-91a2-77cb55a3a4c9] PLoS One. 2013;8:e72023. doi: 10.1371/journal.pone.0072023. [DOI] [PMC free article] [PubMed] [Google Scholar]
- 23.Hosoyama T, McGivern JV, Van Dyke JM, et al. Derivation of myogenic progenitors directly from human pluripotent stem cells using a sphere-based culture. Stem Cells Translational Medicine. 2014;3:564–574. doi: 10.5966/sctm.2013-0143. [DOI] [PMC free article] [PubMed] [Google Scholar]
- 24.Ryan T, Liu J, Chu A, et al. Retinoic acid enhances skeletal myogenesis in human embryonic stem cells by expanding the premyogenic progenitor population. Stem Cell Rev. 2012;8:482–493. doi: 10.1007/s12015-011-9284-0. [DOI] [PubMed] [Google Scholar]
- 25.Borchin B, Chen J, Barberi T. Derivation and FACS-mediated purification of PAX3+/PAX7+ skeletal muscle precursors from human pluripotent stem cells. Stem Cell Rep. 2013;1:620–631. doi: 10.1016/j.stemcr.2013.10.007. [DOI] [PMC free article] [PubMed] [Google Scholar]
- 26.Loperfido M, Steele-Stallard HB, Tedesco FS, et al. Pluripotent stem cells for gene therapy of degenerative muscle diseases. Curr Gene Ther. 2015;15:364–380. doi: 10.2174/1566523215666150630121207. [DOI] [PubMed] [Google Scholar]
- 27.Chal J, Oginuma M, Al Tanoury Z, et al. Differentiation of pluripotent stem cells to muscle fiber to model Duchenne muscular dystrophy. Nat Biotechnol. 2015;33:962–969. doi: 10.1038/nbt.3297. [DOI] [PubMed] [Google Scholar]
- 28.Shelton M, Metz J, Liu J, et al. Derivation and expansion of PAX7-positive muscle progenitors from human and mouse embryonic stem cells [published correction appears in Stem Cell Rep 2014;3:1159] Stem Cell Rep. 2014;3:516–529. doi: 10.1016/j.stemcr.2014.07.001. [DOI] [PMC free article] [PubMed] [Google Scholar]
- 29.Shelton M, Kocharyan A, Liu J, et al. Robust generation and expansion of skeletal muscle progenitors and myocytes from human pluripotent stem cells. Methods. 2015;101:73–84. doi: 10.1016/j.ymeth.2015.09.019. [DOI] [PubMed] [Google Scholar]
- 30.Snider L, Geng LN, Lemmers RJ, et al. Facioscapulohumeral dystrophy: Incomplete suppression of a retrotransposed gene. PLoS Genet. 2010;6:e1001181. doi: 10.1371/journal.pgen.1001181. [DOI] [PMC free article] [PubMed] [Google Scholar]
- 31.Chua SW, Vijayakumar P, Nissom PM, et al. A novel normalization method for effective removal of systematic variation in microarray data. Nucleic Acids Res. 2006;34:e38. doi: 10.1093/nar/gkl024. [DOI] [PMC free article] [PubMed] [Google Scholar]
- 32.Eisen MB, Spellman PT, Brown PO, et al. Cluster analysis and display of genome-wide expression patterns. Proc Natl Acad Sci USA. 1998;95:14863–14868. doi: 10.1073/pnas.95.25.14863. [DOI] [PMC free article] [PubMed] [Google Scholar]
- 33.Tsumagari K, Chang SC, Lacey M, et al. Gene expression during normal and FSHD myogenesis. BMC Med Genomics. 2011;4:67. doi: 10.1186/1755-8794-4-67. [DOI] [PMC free article] [PubMed] [Google Scholar]
- 34.Celegato B, Capitanio D, Pescatori M, et al. Parallel protein and transcript profiles of FSHD patient muscles correlate to the D4Z4 arrangement and reveal a common impairment of slow to fast fibre differentiation and a general deregulation of MyoD-dependent genes. Proteomics. 2006;6:5303–5321. doi: 10.1002/pmic.200600056. [DOI] [PubMed] [Google Scholar]
- 35.Richards M, Coppée F, Thomas N, et al. Facioscapulohumeral muscular dystrophy (FSHD): An enigma unravelled? Hum Genet. 2012;131:325–340. doi: 10.1007/s00439-011-1100-z. [DOI] [PubMed] [Google Scholar]
- 36.Monaco AP, Bertelson CJ, Liechti-Gallati S, et al. An explanation for the phenotypic differences between patients bearing partial deletions of the DMD locus. Genomics. 1988;2:90–95. doi: 10.1016/0888-7543(88)90113-9. [DOI] [PubMed] [Google Scholar]
- 37.Tassin A, Leroy B, Laoudj-Chenivesse D, et al. FSHD myotubes with different phenotypes exhibit distinct proteomes. PLoS One. 2012;7:e51865. doi: 10.1371/journal.pone.0051865. [DOI] [PMC free article] [PubMed] [Google Scholar]
- 38.Barro M, Carnac G, Flavier S, et al. Myoblasts from affected and non-affected FSHD muscles exhibit morphological differentiation defects. J Cell Mol Med. 2010;14:275–289. doi: 10.1111/j.1582-4934.2008.00368.x. [DOI] [PMC free article] [PubMed] [Google Scholar]
- 39.Vanderplanck C, Ansseau E, Charron S, et al. The FSHD atrophic myotube phenotype is caused by DUX4 expression. PLoS One. 2011;6:e26820. doi: 10.1371/journal.pone.0026820. [DOI] [PMC free article] [PubMed] [Google Scholar]
- 40.Cheli S, François S, Bodega B, et al. Expression profiling of FSHD-1 and FSHD-2 cells during myogenic differentiation evidences common and distinctive gene dysregulation patterns. PLoS One. 2011;6:e20966. doi: 10.1371/journal.pone.0020966. [DOI] [PMC free article] [PubMed] [Google Scholar]
- 41.Osborne RJ, Welle S, Venance SL, et al. Expression profile of FSHD supports a link between retinal vasculopathy and muscular dystrophy. Neurology. 2007;68:569–577. doi: 10.1212/01.wnl.0000251269.31442.d9. [DOI] [PubMed] [Google Scholar]
- 42.Rahimov F, King OD, Leung DG, et al. Transcriptional profiling in facioscapulohumeral muscular dystrophy to identify candidate biomarkers. Proc Natl Acad Sci USA. 2012;109:16234–16239. doi: 10.1073/pnas.1209508109. [DOI] [PMC free article] [PubMed] [Google Scholar]
- 43.Rijkers T, Deidda G, van Koningsbruggen S, et al. FRG2, an FSHD candidate gene, is transcriptionally upregulated in differentiating primary myoblast cultures of FSHD patients. J Med Genet. 2004;41:826–836. doi: 10.1136/jmg.2004.019364. [DOI] [PMC free article] [PubMed] [Google Scholar]
- 44.Klooster R, Straasheijm K, Shah B, et al. Comprehensive expression analysis of FSHD candidate genes at the mRNA and protein level. Eur J Hum Genet. 2009;17:1615–1624. doi: 10.1038/ejhg.2009.62. [DOI] [PMC free article] [PubMed] [Google Scholar]
- 45.Tassin A, Laoudj-Chenivesse D, Vanderplanck C, et al. DUX4 expression in FSHD muscle cells: How could such a rare protein cause a myopathy? J Cell Mol Med. 2013;17:76–89. doi: 10.1111/j.1582-4934.2012.01647.x. [DOI] [PMC free article] [PubMed] [Google Scholar]
- 46.Winokur ST, Barrett K, Martin JH, et al. Facioscapulohumeral muscular dystrophy (FSHD) myoblasts demonstrate increased susceptibility to oxidative stress. Neuromuscul Disord. 2003;13:322–333. doi: 10.1016/s0960-8966(02)00284-5. [DOI] [PubMed] [Google Scholar]
- 47.Ito M, Imai M, Muraki M, et al. GSTT1 is upregulated by oxidative stress through p38-MK2 signaling pathway in human granulosa cells: Possible association with mitochondrial activity. Aging (Albany, NY) 2011;3:1213–1223. doi: 10.18632/aging.100418. [DOI] [PMC free article] [PubMed] [Google Scholar]
- 48.Rickard AM, Petek LM, Miller DG. Endogenous DUX4 expression in FSHD myotubes is sufficient to cause cell death and disrupts RNA splicing and cell migration pathways. Hum Mol Genet. 2015;24:5901–5914. doi: 10.1093/hmg/ddv315. [DOI] [PMC free article] [PubMed] [Google Scholar]
- 49.Turki A, Hayot M, Carnac G, et al. Functional muscle impairment in facioscapulohumeral muscular dystrophy is correlated with oxidative stress and mitochondrial dysfunction. Free Radic Biol Med. 2012;53:1068–1079. doi: 10.1016/j.freeradbiomed.2012.06.041. [DOI] [PubMed] [Google Scholar]
- 50.Ma H, Morey R, O’Neil RC, et al. Abnormalities in human pluripotent cells due to reprogramming mechanisms. Nature. 2014;511:177–183. doi: 10.1038/nature13551. [DOI] [PMC free article] [PubMed] [Google Scholar]
- 51.Broucqsault N, Morere J, Gaillard MC, et al. Dysregulation of 4q35- and muscle-specific genes in fetuses with a short D4Z4 array linked to facio-scapulo-humeral dystrophy. Hum Mol Genet. 2013;22:4206–4214. doi: 10.1093/hmg/ddt272. [DOI] [PubMed] [Google Scholar]
- 52.Winokur ST, Chen YW, Masny PS, et al. Expression profiling of FSHD muscle supports a defect in specific stages of myogenic differentiation. Hum Mol Genet. 2003;12:2895–2907. doi: 10.1093/hmg/ddg327. [DOI] [PubMed] [Google Scholar]
- 53.Bouju S, Piétu G, Le Cunff M, et al. Exclusion of muscle specific actinin-associated LIM protein (ALP) gene from 4q35 facioscapulohumeral muscular dystrophy (FSHD) candidate genes. Neuromuscul Disord. 1999;9:3–10. doi: 10.1016/s0960-8966(98)00087-x. [DOI] [PubMed] [Google Scholar]
- 54.Bodega B, Ramirez GD, Grasser F, et al. Remodeling of the chromatin structure of the facioscapulohumeral muscular dystrophy (FSHD) locus and upregulation of FSHD-related gene 1 (FRG1) expression during human myogenic differentiation. BMC Biol. 2009;7:41. doi: 10.1186/1741-7007-7-41. [DOI] [PMC free article] [PubMed] [Google Scholar]
- 55.Laoudj-Chenivesse D, Carnac G, Bisbal C, et al. Increased levels of adenine nucleotide translocator 1 protein and response to oxidative stress are early events in facioscapulohumeral muscular dystrophy muscle. J Mol Med (Berl) 2005;83:216–224. doi: 10.1007/s00109-004-0583-7. [DOI] [PubMed] [Google Scholar]
- 56.Pakula A, Schneider J, Janke J, et al. Altered expression of cyclin A 1 in muscle of patients with facioscapulohumeral muscle dystrophy (FSHD-1) PLoS One. 2013;8:e73573. doi: 10.1371/journal.pone.0073573. [DOI] [PMC free article] [PubMed] [Google Scholar]
- 57.Banerji CR, Knopp P, Moyle LA, et al. β-catenin is central to DUX4-driven network rewiring in facioscapulohumeral muscular dystrophy. J R Soc Interface. 2015;12:20140797. doi: 10.1098/rsif.2014.0797. [DOI] [PMC free article] [PubMed] [Google Scholar]
Associated Data
This section collects any data citations, data availability statements, or supplementary materials included in this article.