Abstract
Electronic data resources can enable molecular biologists to query and display many useful features that make benchwork more efficient and drive new discoveries. The UCSC Genome Browser provides a wealth of data and tools that advance one’s understanding of genomic context for many species, enable detailed understanding of data, and provide the ability to interrogate regions of interest. Researchers can also supplement the standard display with their own data to query and share with others. Effective use of these resources has become crucial to biological research today, and this unit describes some practical applications of the UCSC Genome Browser.
Keywords: UCSC Genome Browser, clones, primers, custom tracks, variations, SNP, comparative genomics
INTRODUCTION
Sequence databases and software analysis tools are now crucial reagents for molecular biologists. Increasing volumes of sequence data, paired with diverse annotation types that are necessary to grasp genomic context, need to be organized and presented effectively to imbue a researcher with confidence to understand the features in regions of interest and to leap to further analyses with the data of interest. Genome browsers accomplish this task in a variety of ways. The focus of this unit is the University of California at Santa Cruz (UCSC) Genome Browser’s organization and tools that provide support for molecular biomedical researchers worldwide. Like reagents on a chemical shelf, sequences and associated data need to be obtained, extracted, manipulated, analyzed, and used to further the progress of research.
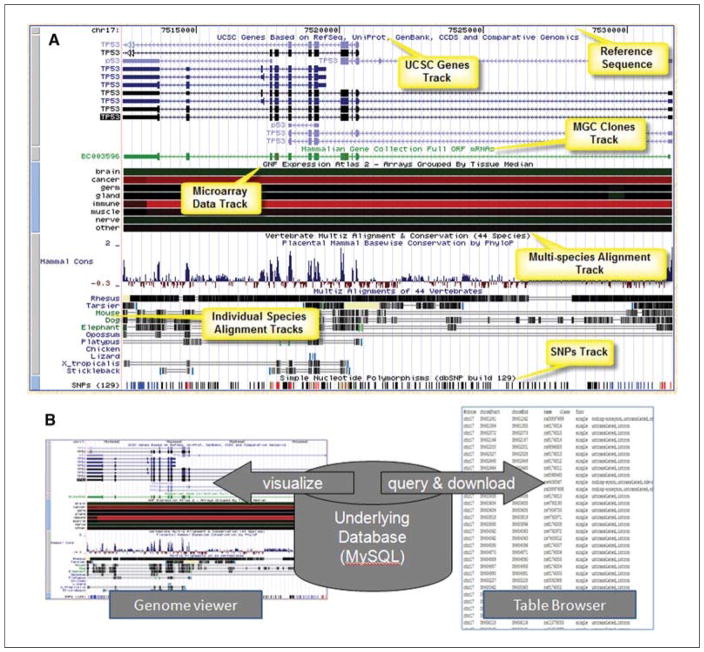
The UCSC Genome Browser (http://genome.ucsc.edu) provides a framework for interpretation of genomic features and elements with a graphical interface and control options for visualization of data and features (Gateway search and Genome viewer), and a more form- and text-based access mechanism for complex queries and batch data retrieval and downloading (Table Browser; Kuhn et al., 2009). Genomic data are visualized on a reference genome sequence framework, with additional data types of interest to researchers laid out in appropriate locations. These data types are called “annotation tracks” and provide context for the genomic regions (Fig. 19.9.1A). The same underlying mySQL database stores the complete data collection, which can be used to visualize the features with a graphical interface (Genome viewer) or can be queried and downloaded with the Table Browser (Fig. 19.9.1B). Additional tools associated and integrated with the UCSC Genome Browser provide access to related specific data types that offer visualization and analysis suitable for special topic areas and investigations (Gene Sorter, Genome Graphs, in silico PCR, VisiGene, Proteome Browser, ENCODE, Cancer Browser, and more). Here, the first three of these tools are explored in some detail, which will allow researchers to begin accessing the data efficiently and capably (Gateway, Table Browser, Gene Sorter). Other tools are touched on briefly to encourage further exploration.
Figure 19.9.1.
(A) The UCSC Genome Browser organizes the display of genomic information with the official or reference genome sequence as the framework, positioning additional data as “annotation tracks” in the appropriate genomic location to provide context for understanding any genomic region. (B) An underlying mySQL database stores genomic sequence data, annotation track details, and auxiliary information which can then be visualized with the graphical Genome viewer interface, or queried and downloaded using the Table Browser interface.
The UCSC Genome Browser provides access to dozens of species’ genomic sequences and other data types at the main site (http://genome.ucsc.edu), and also at several mirrors that may provide faster access for users in other locations (http://genome.brc.mcw.edu/, http://genome-mirror.duhs.duke.edu/, http://genome-mirror.bscb.cornell.edu/, and, most recently, the European mirror http://genome-mirror.binf.ku.dk/ and the Australian mirror http://genome.qfab.org). The focus here is on mammalian data. Other installations of the same software framework have been deployed for other species including archaea (http://archaea.ucsc.edu/), malaria parasites (http://areslab.ucsc.edu/), HIV (http://www.gsid.org/), Arabidopsis (http://epigenomics.mcdb.ucla.edu/), and others. In each case, the data types comprising the site may vary, but the basic functionality of the software features is largely the same. The focus of the protocols below is the UCSC main site in Santa Cruz, but mastery of the concepts should enable use of any of the sites.
BASIC PROTOCOL I. UNDERSTANDING GENOMIC DATA AND FEATURES WITH THE UCSC GENOME BROWSER GATEWAY
To begin to understand the search and display features of the UCSC Genome Browser, access the Gateway. This is the access to the main browser visualization software. Use nearly any of the major Internet browsers to access the site. A fast connection speed is recommended, but should not be required.
-
Access the UCSC Genome Browser at the URL http://genome.ucsc.edu.
This should display the site homepage. Project description information and news will be in the central page area. Navigation bars (blue) on the left and on the top will provide the entry points for the tools featured in this unit. -
In the blue navigation areas, click either the top link for Genomes, or the side link for Genome Browser.
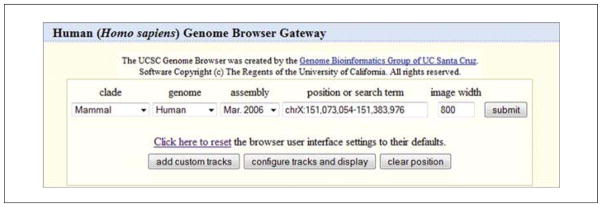
These links provide the same outcome: landing on the Genome Browser Gateway page (Fig. 19.9.2). The Gateway should say Human (Homo sapiens) Genome Browser Gateway by default, with pull-down options for access to other organisms. -
Examine the Gateway page for Human.
A query box area is found at the top. It will contain a default location of sample query text upon arrival.
In the next area there will be information about the version of the genome data for the most current assembly of the sequence information. The source of the data will be provided.
-
A section of “Sample position queries” will help to remind users of the appropriate syntax for an inquiry (Request) and the expected outcome (Genome Browser Response).
For example, entire chromosomes, nucleotide ranges, or many items using names or various identifiers (IDs) provided by many database sources can be employed as query items. The Assembly Details section provides more detailed information about the specific genomic sequence at hand. Links to statistics about the “build” or version are provided. Notable aspects of the data that may affect interpretation of the results are offered.
A link to Summary Statistics including sizes, gaps, assembly clones, and more is provided in the area titled Statistical information.
-
Focus on the query box area at the top. Select options here to define the query. Examine each option from left to right.
clade: In order to reduce the species list size as more and more species were added, the UCSC Genome Browser team has broken the collection into smaller subsets. Though not strictly adhering to the biological meaning of clade, this is a way to bundle the species into useful groups. Access a species of interest by choosing the appropriate item from the clade list.
genome: Select the species to examine. At this time only one genome at a time is searched.
assembly: The date in this box represents the date of the official freeze and deposit into GenBank of the official sequence by the sequencing center. The human sequence through the March 2006 assembly was provided by the International Human Genome Consortium, but as of February 2009, assembly sequence will be obtained from the Genome Reference Consortium. Note that different species have different sources of official sequence data. The official assembly sequence is frozen and will not change during the course of one “assembly” date. By default, the most current version is shown, but access to earlier versions is available as well. Sometimes it is handy to reproduce older queries done on previous versions, or when trying to replicate information found in publications. Generally, several assemblies are available for any species from the menu. For species that have had many assembly releases, the oldest assemblies are available in the archives. These are accessed from the homepage left navigation bar link for Archives.
position or search term: This is where to enter the information to define the region of the genome to examine. Enter gene symbols, names, keywords, authors, genome coordinate nucleotide numbers or ranges, cytological bands, and many types of IDs and accession numbers.
-
image width: The number of pixels used to draw the genome display is provided in this box. The default setting is 800 pixels, which will be used for the images shown here. However, it may be set from 320 up to 5000. This may be helpful for various publications or presentations, or for visualization of specific data types.
The following are some other features of the query box area that may assist interactions with the browser. Click here to reset: This feature will clear any settings in the browser that pertain to the UCSC Genome Browser choices that are made. This may be useful in shared computing environments such as laboratories and libraries when others may have changed features of the display. Occasionally, odd behavior from the software may be encountered and sometimes it will help to reset from this point.
add custom tracks: This button will enable addition of one’s own data to the display (see Basic Protocol 4 for more information on custom tracks).
configure tracks and display: This button enables access to many features of the subsequent display that can be turned on, turned off, or activated. Tracks can be moved around. Change the size of the text in the displays if desired. This button will also be available on the display page later.
clear position: This will quickly empty out the position/search box. By default, the box is always seeded with a sample location to get started, but that may be wiped out, or the button may be used to clear the box.
Now that the options are familiar, perform a sample query to visualize a genomic location to begin to explore the genomic context. The mouse gene Cps1 is of interest for this example. A BAC (bacterial artificial chromosome) clone that covers the Cps1 gene region needs to be obtained to study the promoter region in more detail. A Mammalian Gene Collection clone, to create expression constructs, also needs to be obtained. Find two suitable clones for these purposes.
-
On the Gateway page (see Fig. 19.9.2), make these choices:
clade: Mammal
genome: Mouse
assembly: July 2007
position or search term: cps1
image width: 800 pixels (default setting)
click the “submit” button when the choices are complete.
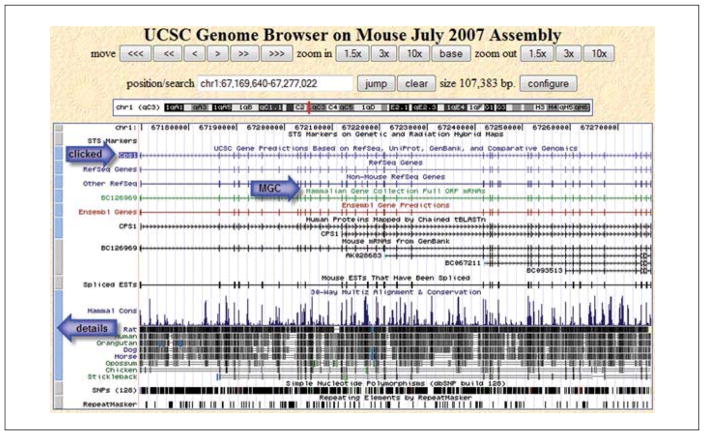
A results page will present a list of all the matches for the text string Cps1 in the mouse data collection. The term will be found in genes, mRNAs, knockout mice, non-mouse aligned sequences, and more categories. The appropriate type of result for the search needs to be selected. In this case the gene is the primary interest. Focus on UCSC Genes, a collection created by UCSC from a variety of data sources of genes that have been aligned to the genomic sequence. At this time, there are two entries for Cps1. The description for one includes the phrase “partial cds”, so that would not be the first choice. Select the other one, Cps1 (uc007biy.1) at chr1:67169640-67277022. Click that link to go to the viewer, which will load that nucleotide range in the view (Fig. 19.9.3). The item clicked from the results list will be indicated by highlighting around the name (see the arrow labeled “clicked” shown on the figure).
-
Examine the Genome Viewer in the Cps1 region that will be displayed. The Viewer will have reference sequence and tracks in the upper portion of the page, and the lower portion of the page will contain track control menu options.
The UCSC Genome Browser employs graphical cues to help users understand features in the view. Some short items will be represented with tick marks (SNPs); gene-structure features such as exons and introns are indicated as boxes and lines. On genes like Cps1, the direction of transcription is indicated with arrowheads. Evolutionary relationships (conservation) are indicated with a histogram display. Any of the display features can be investigated by clicking on the blue and gray bars on the left of the image (indicated by the “details” arrow in Fig. 19.9.3), or by locating the annotation track name in the control area below the viewer and clicking the hyperlink. Description pages will provide information about the graphical cues and color codes. A great deal of information is provided by the default view (Fig. 19.9.3). One thing immediately apparent is that there is a Mammalian Gene Collection (MGC) clone for this gene (Strausberg et al., 1999). This clone is indicated with the “MGC” arrow in Figure 19.9.3. To learn more about this cDNA clone (which may be different from genomic sequence), click on the green track that is the representation of the MGC clone. A page of details will provide information about this clone including links to a variety of additional data, sequence details, and even opportunities to order this clone (note that UCSC does not sell clones; this is a link to external information providers). Click the Back button to return to the main viewer page.
-
The default view does not include BAC clones. They will need to be added to the view to explore those. Examine the track controls section in the lower part of the page (Fig. 19.9.4). The uppermost section is called Mapping and Sequencing Tracks. In that group, there is a track called BAC End Pairs. In this case, it seems apparent that this track will have BAC information, but if that cannot be determined from the short names, or the user would like to confirm the expectations for the data in that set, clicking the hyperlinked title (circled in figure) provides access to a page that describes the data. The data type, source, any associated publications, graphical and color cues, and more will be provided on the track description page.
The pull-down menu is gray upon arrival because it is hidden by default, but it can be turned on by simply selecting an option in the menu. There are different menu choices for different styles of display. Some are more compressed for smaller graphic views (“dense”, “pack”, and “squish”), and one is for full display of all the features. For this example, full visibility will be chosen, but for different data types, the other choices may be helpful. -
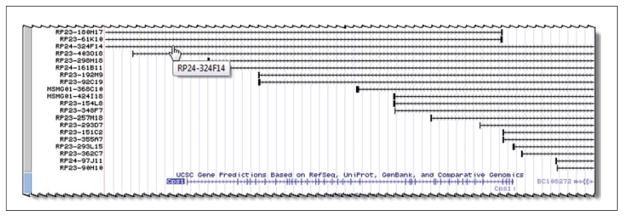
Select “full” from the menu, and then click one of the “refresh” buttons on the page to enforce that and see it in the viewer. The image should now be redrawn in the Viewer. The upper section should display BAC clones that were not visible before. It looks like several of these clones may span the whole Cps1 gene area, but it would help to zoom out a bit to get a better look at the clone ends. At the top of the viewer are controls to navigate around the area or to zoom in or out. Zoom out slowly by clicking the “zoom out 1.5 ×” button. The Viewer will now contain a larger span, and the clone ends should be more apparent (taller black boxes on the BAC clones). However, it is not apparent where all the clone ends are yet. Zoom out another 1.5× to see a bit more. With this setting, a couple of clones that seem to span the region of interest can be seen, such as the one indicated in Figure 19.9.5. Clicking on that BAC clone provides a page that describes the clone in more detail. As before, links to external sources may provide source information for the clone.
Using the described protocol, two clones that may assist work on the Cps1 gene have been identified: an MGC clone to make expression constructs, and a BAC clone for investigating promoter regions.
Figure 19.9.2.
The Gateway query box provides the entry point for basic text queries of the UCSC Genome Browser and offers access to the Genome viewer.
Figure 19.9.3.
Overview of a region of the UCSC Genome Browser viewer. The position of the Cps1 gene that was clicked from the results is indicated with the upper arrow (labeled “clicked”). The browser adds a highlight box around the clicked item to help you identify it on the viewer. A Mammalian Gene Collection clone is indicated with a middle arrow (labeled “MGC”). The bottom arrow (labeled “details”) indicates the bar to click for details about the track data. For the color version of this figure go to http://www.currentprotocols.com/protocol/mb1909.
Figure 19.9.4.
A portion of the track controls menu area is shown. An open menu offers a variety of display visibility choices. “Hide” removes the track from view; “dense” collapses all the data into a single line; “squish” uses half-sized graphics; “pack” efficiently positions each item (several may share a line if room permits); and “full” puts each data item on a separate line. Choices will depend on the data type and one’s needs. An oval indicates a clickable hyperlink that provides details about the data contents of the track.
Figure 19.9.5.
BAC clones displayed in the region of the Cps1 gene.
SUPPORT PROTOCOL 1. REMOVING UNNECESSARY GRAPHICS FROM THE IMAGE AND ADDING RESTRICTION SITE INFORMATION
The MGC clone identified in Basic Protocol 1 could be helpful for generating protein expression products. It might be useful to put parts of the full-length clone into various expression vectors. This protocol focuses on that clone and adds some additional information—restriction enzyme cut sites.
Back on the view created in Basic Protocol 1 (see Fig. 19.9.5), some features will be turned off to simplify the view. It is easiest in this case to turn off everything and then add back the desired pieces. However, the “configure” button could be used to access a page that will quickly allow many opportunities to turn on/off the tracks. The simplest way to accomplish this for this exercise is to just click the “hide all” button first. This button is below the graphical viewer and above the track controls with the menus. Click it.
The view will now contain only the reference sequence track. In this step, the clone track will be added back. In the track controls area, navigate to the Gene and Gene Prediction Tracks group and find the title MGC Genes. To be confident that the data in this track are what the user expects them to be, the hyperlinked title can be clicked to learn more details about this track. Navigate back via the Back button when it has been viewed.
Using the pull-down menu in the MGC Genes track, select “full”. Click one of the “refresh” buttons. At this time, one clone appears. If there were multiple clones (which likely represent splice variants), using the “full” visibility choice would display all of them.
-
The challenge now is to see if there are convenient restriction sites in this clone. For the purpose of this example, the cut sites of two enzymes will be chosen for display. However, all of them could be viewed if desired. Choosing the Restr Enzymes menu for “full” from the Mapping and Sequencing Tracks would show everything—and might be too much information.
In this case a two-step process will be employed. This is because, instead of showing everything, a “filter” step for the restriction enzymes to view only selected enzymes is preferred. Instead of just choosing the menu to show the enzyme, clicking the hyperlink for Restr Enzymes provides access to the information page. The hyperlinked track description page is also the place to find filters for tracks, when filters exist. Not all tracks contain filters, however. It depends on the source data and type of data involved.
When the “Restr Enzymes” link is clicked, information about the track will be found. At the top of the page there are also the options to choose the display mode (this is the same menu as the one on the main page). There is also a text box. In the text box, type these characters: HindIII, EcoRI. Switch the Display mode pull-down menu to select “full”, and click the “submit” button.
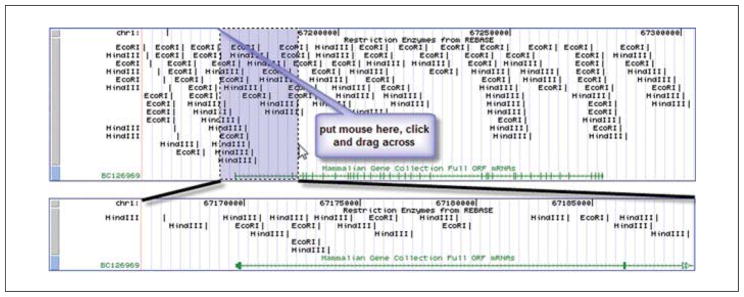
The main viewer page should reload with the cut sites for the two enzymes, displayed in order from the 5′ end to the 3′ end of this genomic segment in the viewer. However, this may not be the best choice for showing this track. Instead, adjust the view. From the Restr Enzyme track control (below the graphic display), select “pack”, and click a “refresh” button. This view (as illustrated in the upper part of Fig. 19.9.6) may be more helpful for planning cloning experiments. Of course, variation between strains could affect results in the laboratory.
-
A more precise look at a given region may be valuable. First, put the first two exons in focus. Put the cursor in the top of the track area in the viewer, hold down the mouse button, and drag across to include the first two exons to highlight that section. Releasing the mouse button will activate the zooming of that section (Fig. 19.9.6 lower portion).
It should be easier to look at the cut sizes that might be helpful—or those that may not help. In this case, there may not be useful sites in the coding regions represented by the exon boxes. The cuts appear to be in the introns. So, other enzymes could be examined, or all of them displayed to start making decisions. It depends on what the researcher wants to accomplish. -
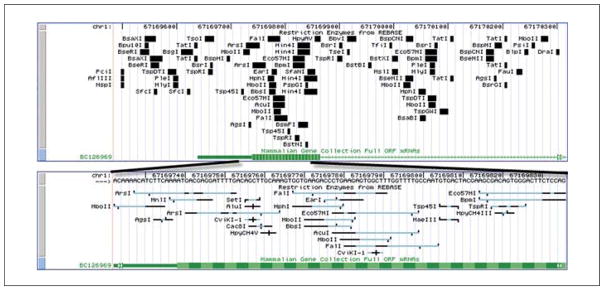
To show enzymes that may be useful that would cut in the first exon area, zoom further on that area. Return to the filter (see step 4) to remove the HindIII and EcoRI filters, then click “submit”. The display should look like the region in Figure 19.9.7. Zooming in even more by using the “base” button will generate additional features such as the cut site pattern in the restriction enzyme tracks, and show the reference nucleotides in the reference genome track.
Reducing the visual field to focus on the items of interest, combined with filtering and zooming, provides a wealth of detail that can assist with planning benchwork studies.
Figure 19.9.6.
A segment of the UCSC Genome Browser viewer to zoom in is highlighted in blue. This is accomplished by dragging the mouse from one side to the other in this area. When the mouse button is released, the redrawn viewer will display the selected region. For the color version of this figure go to http://www.currentprotocols.com/protocol/mb1909.
Figure 19.9.7.
A magnified portion of the UCSC Genome Browser to examine the end of the clone at higher resolutions. Increasing levels of zooming offer additional details about the items, even as far as to illustrate the cutting patterns of individual enzymes (horizontal black = specific bases in cut-site; blue = redundant bases or N; vertical tick marks = cut location on each strand). For the color version of this figure go to http://www.currentprotocols.com/protocol/mb1909.
LOOK FOR SNPs IN A GENE OF INTEREST
This protocol can be used to consider whether expression clones or restriction-site cuts could be affected by SNPs, by visually examining the data. The Cps1 gene’s reference sequence may be sufficient for a researcher’s studies. However, it might also be worthwhile to know if there are variations in the sequence that have been identified. These could vary by mouse strain, and could affect restriction cut sites, among other things. This protocol will allow a closer look at the gene and polymorphisms.
Using the Cps1 MGC gene, look for possible variations from the reference sequence. First, add SNPs to the view. UCSC has borrowed an expanded acronym first used by NCBI (National Center for Biotechnology Information, http://www.ncbi.nlm.nih.gov). SNP stands for Simple Nucleotide Polymorphism because they can be single-nucleotide changes or small insertions and deletions of sequence (indels). Back on the main viewer (see Basic Protocol 1), scroll down to near the bottom of the page to find the Variations and Repeats group. In that group, find the track for “SNPs (128)”. Click the hyperlink title for “SNPs (128)” to access the information page and the SNP filters.
Many options within the SNP data are available to filter and display features of interest. In this case, only one filter will be chosen: the display will be set to show red SNPs if that change would alter the amino acid sequence. That is called a nonsynonymous SNP. Scroll down the page and set the SNP Feature for Color Specification to show SNPs by Function. Set all menus in that section to black EXCEPT Coding - Non-Synonymous, which should be set to red.
Scroll back to the top of the page. To show the SNPs on the viewer, choose “pack” from the “Display mode” pull-down menu and click Submit to make these changes in the viewer.
-
It will depend on the zoom level and chromosomal position of the previous view, but a track of SNPs should be present below the green MGC gene track. To find non-synonymous SNPs, use either of the “move” buttons at the top to work over to the right to see more 3′ sections of the MGC gene. Alternatively, use the small arrowheads on the MGC track to move to the next feature quickly. However, these techniques would require a fair bit of scrolling to find the first red SNP. Zoom back out to a larger section of the Cps1 gene, visually scan for red SNPs, and then zoom back into their approximate region. Figure 19.9.8 shows a zoomed-in view of a non-synonymous SNP that was found close to exon three, at approximately basepair 67,190,500.
Examination of the identified SNP and restriction sites that overlap this SNP might offer insights into cutting patterns that might vary among mutant mice or various mouse strains, which could direct experimental investigations.
Figure 19.9.8.
Examination of the clone of interest and corresponding SNP information may provide useful additional information about restriction sites. It should be kept in mind, however, that the sequence of the reference genome will not match all samples in the laboratory.
USE THE UCSC GENOME BROWSER TO FIND AN EVOLUTIONARILY CONSERVED REGION BETWEEN SEVERAL FISH SPECIES AND HUMAN IN THE 5 UNTRANSLATED REGION OF THE HUMAN HOXA7 GENE AND VIEW THE ALIGNMENT
Cross-species comparative data may provide informative clues about important features in sequences of interest. Conserved segments in non-coding regions between distantly related species often indicate to researchers possible important regulatory features. The UCSC Genome Browser has many annotation tracks for studying genomic conservation and continues to release multiple alignment tracks with more species. This query will demonstrate how to view an upstream region of a gene (HOXA7) and find a conserved segment in selected species and view the alignment.
Access the UCSC Genome Browser at the URL http://genome.ucsc.edu. In the blue navigation areas, click either the top link for Genomes, or the side link for Genome Browser.
The Gateway interface (see Fig. 19.9.2 and Basic Protocol 1) will be presented. If prior queries have already been done, it is wise to fully reset the form. To do this, click the link near the bottom that says: “Click here to reset the browser user interface settings to their defaults.”
-
Make these choices in the Genome Browser and then click “submit”:
clade: Mammal
genome: Human
assembly: Mar. 2006
position or search term: HOXA7
image width: 800
A list of possible records with the term HOXA7 will be shown. Click the first link for the gene with the symbol HOXA7, i.e., “homeoboxA7” (UCSC genes ID uc003sys.1), to go to the region of the homeobox A7 gene in the human genome.
First scroll down to below the graphic and click “hide all” to simplify the graphic, and then turn on the UCSC Genes track in the Genes and Gene Prediction Tracks section in the track controls below the browser graphic. Choose “full” from the pull-down menu and click one of the “refresh” buttons to visualize the data.
To view the conservation track for selected species, in this case fish species, scroll down to the Comparative Genomics tracks section in the annotation tracks controls and open it by clicking the “+” button.
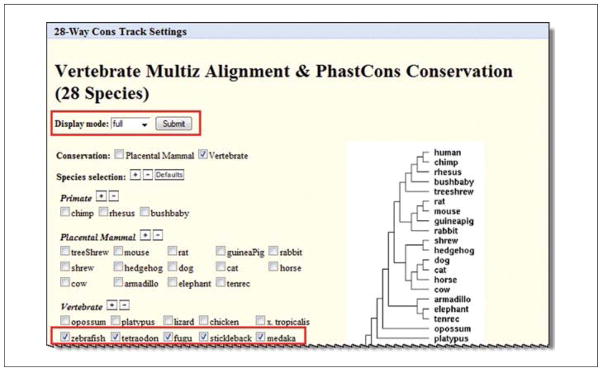
Click on the link for the 28-Way Cons track to access the detailed information page and turn this track on and select which species to view (Fig. 19.9.9).
-
Make the following changes and then click “submit”:
Display mode: full
Conservation: Vertebrate
“Species selection”: Click the checkboxes to deselect all mammals and any non-fish. Select zebrafish, tetraodon, fugu, stickleback, and medaka.
Leave all other parameters as default.
Click Submit.
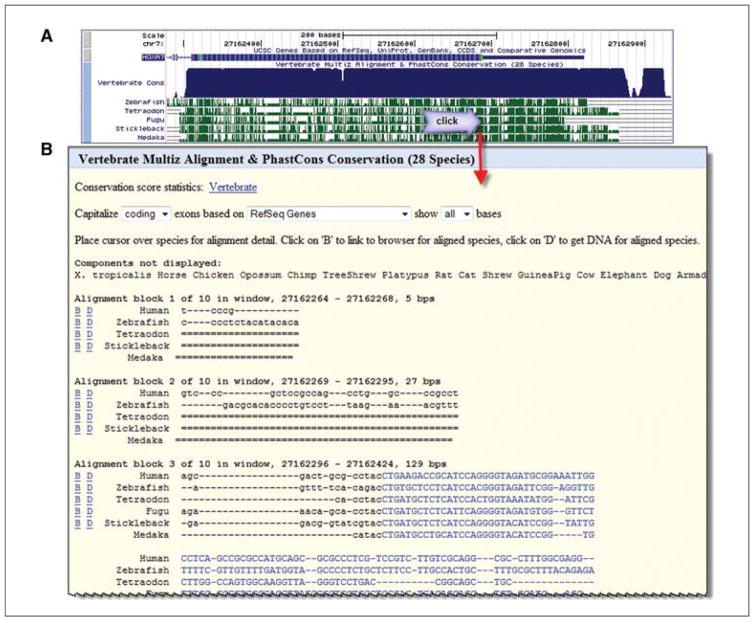
The 28-Way Cons track will be shown in the viewer with the individual fish species in view below the 28 species comparison track (Fig. 19.9.10A). Center and zoom on the 5′ region by clicking and dragging the mouse to cover the half-height box of the 5′ region (on the right for this gene, as it aligns to the “bottom” or reverse strand of the reference assembly). This should be done for two reasons, first to focus on the object of the study, the 5′ untranslated region, and, secondly, to be able to view the alignment at the base level. The alignment details for this track can only be viewed when the region is zoomed to less than 30,000 base pairs. Now nudge the image a little to the right to be sure to have the entire 5′ end. Do this by clicking on the small right arrow (>) labeled “move end” below the browser graphic. The location in the image can be reproduced exactly by typing in these coordinates: chr7:27,162,264-27,162,836 in the Mar. 2006 assembly.
Click any of the fish species conservation track views to see the alignment (Fig. 19.9.10B). Strong conservation in the fish species in the 3′ part of the untranslated region, near the start codon, can be seen in the alignments (reverse complement of ATG here: CAT). Obtain DNA sequence for any of these species in this region by clicking the “D” link before the species name in the alignment.
Figure 19.9.9.
Track description information is available via hyperlinks on the browser main page or via blue and gray vertical bars on the left side of the browser graphic for that track. They may contain configuration options or filters to customize the data for the display. Here, the 28 species comparison track offers choices for which species to display. Additional species comparison sets are available, and new collections are added as new genomes become available for the analyses. For the color version of this figure go to http://www.currentprotocols.com/protocol/mb1909.
Figure 19.9.10.
First exon area of the human HOXA7 gene, with comparative data for several fish indicated. Zoom in to a sufficient level and then click in the fish species region of the Conservation track to view the alignment. Clicking on the conservation area in the display yields the actual alignment data for human and the species that were selected. More details on the display characteristics can be found on the lower portion of the page. Nucleotides of translated codons are in capital letters and colored blue. For the color version of this figure go to http://www.currentprotocols.com/protocol/mb1909.
USE THE UCSC GENOME BROWSER TABLE BROWSER BASICS TO QUERY THE UNDERLYING DATABASE
There may be times when the visual display of a region of interest is sufficient for the work that a researcher needs to accomplish. However, there may be other times or other procedures which require lists of items that could be viewed in spreadsheets, or used in other software tools. The way to access this type of data from the UCSC Genome Browser is to use the Table Browser.
The Table Browser relies on the same data seen in the graphical interface (Fig. 19.9.1B) and it pulls the data from the same underlying SQL database. However, the output can be treated in many more ways. A few of the output options for the list of data obtained will be examined here.
In this section the human genome will be investigated, in particular a large gene of medical interest, the Duchenne Muscular Dystrophy gene, or DMD. A rapid method to extract every SNP in the genomic span of the DMD gene in just a few steps with the simple Table Browser interface is described below.
NOTE: At the time of this writing, SNP assembly 129 was available. Later assemblies may also be used.
Access the UCSC Genome Browser at the URL http://genome.ucsc.edu. Click either the Tables link in the top navigation bar or the Table Browser link on the left navigation bar.
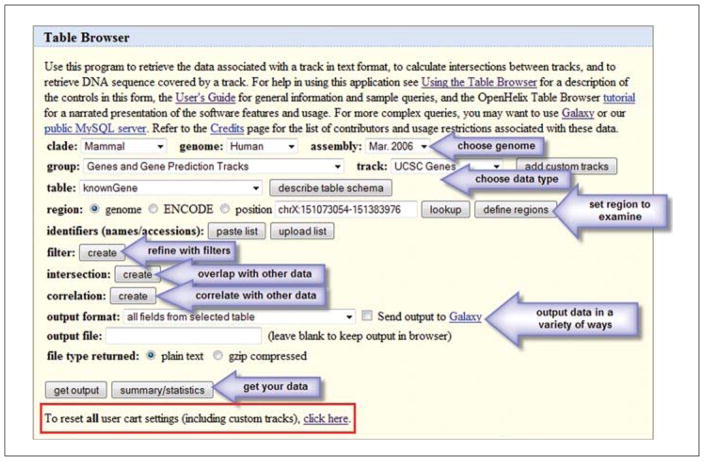
A form interface (Table Browser) will be presented (Fig. 19.9.11). The choices made on this form will create a query of the database that will retrieve the data. Although it may look daunting at first, some orientation will indicate features of the database that may be recognized from the earlier parts of this unit.
The first thing to do is reset the browser. If anyone has been using the software already, the form may not be in its default state. Scroll down the page and click the link that says “To reset all user cart settings (including custom tracks), click here” (Fig. 19.9.10, red boxed area at the bottom). The browser should reset with default settings that include the Human genome.
The first row of choices (“clade”, “genome”, “assembly”) should be familiar from Basic Protocol 1. The meaning is the same, and as before one genome and one assembly at a time will be selected to query. In this case select Human and the Mar. 2006 assembly.
The next section—“group” and “track”—refer to the annotation tracks seen before on the graphical interface. The groups and tracks are shown here by default. Opening the menus will allow other groups to be visible. Open the “group” menu to examine the tracks. For this example, to pull all the SNPs from a genomic region, choose Variation and Repeats in the “group” section.
When the group choices are made, the tracks options will change to reflect the tracks that are available in that group. In the case of the Human genome a number of tracks are available here. In this case, for a list of SNPs, the top SNP choice will be sufficient (SNPS 129 at this time).
In the next row there are table choices. In a database, data are stored in a collection of different tables. Software code can access and assemble data from the different tables in various ways. The code can be used to pull the data for the graphical view seen before, or to extract it as text. For the purposes of this example, it is sufficient to know that SNP data will be pulled from the primary SNP table, snp129. To know what this table contains, the “describe table schema” button can be clicked to understand its structure. However, users not familiar with database tables may not find this informative.
The next item to determine is the region of the genome to examine. The “region” radio button is set for the whole genome, and could yield a huge table of every SNP in the genome if requested (more than 15 million items at this time). However, the search can be limited to a position, and that is what will be illustrated here, with focus on the DMD gene region. If the coordinates are not known, then click the radio button for “position”, enter the text DMD in the adjacent text box, and click the “lookup” button. If there was a list of genes and the user wanted all the SNPs in them, for example, one could create a list of genes or regions and enter those after clicking the “define regions” button, but this example of one gene will be a simple example.
- The “lookup” button will run a query to find that text entered. The result will be a list of results similar to a position query. One of the DMD genes will be selected for this example. There may be a number of possible splice variants in this case. For this example choose the one with the following description:
DMD (uc004ddf.2) at chrX:32444635-33267647 - DMD protein (Dystrophin) (Muscular dystrophy, Duchenne and Becker types) -
When that link is clicked, note that it pastes the genome coordinates into the “position” text box. The Table Browser interface with that position in the text box will be loaded.
Just to summarize what has been done: a species (Human) and the Mar. 2006 assembly was chosen. Data from the snp129 table will be pulled. Only the data found in the DMD genomic span that indicated will be retrieved. At this time all the other buttons that can be used to refine the query will be skipped. Focus on the buttons at the bottom of the form. To quickly get a sense of how many SNPs this might be, the “summary/statistics” button can be clicked to find out how many items this query would produce. At this time over 3000 SNPs are indicated. This would be extremely difficult to access quickly in the graphical viewer.
Return to the main form from the Summary by using the Back button on the browser.
-
Output these data. There are a number of choices for ways to handle it. This can vary based on what the query items were, but for this simple query the menu choices will be similar to those illustrated in Figure 19.9.12.
To become familiar with the options, users are encouraged to select each one, click the “get output” button, and examine the differences. Large swaths of text data can be obtained; specifying selected items from the database is possible; the SNP sequences are available; options for formatted data usable in other tools (GTF and BED format) are provided; data can be viewed as a custom track; or a huge list of hyperlinks back to the browser viewer can be accessed.A separate option is to take this whole data set and send it to the Galaxy interface. Galaxy is a separate analysis tool hosted at Penn State (http://galaxyproject.org/). Even more complex manipulations can be performed on the data with the analytical tools at Galaxy. Queries can be stored and re-run there. For purpose of this protocol, just a few items to view will be selected. From the “output format” pull-down menu, choose “selected fields from primary and related tables” and click “get output” for the field choices.
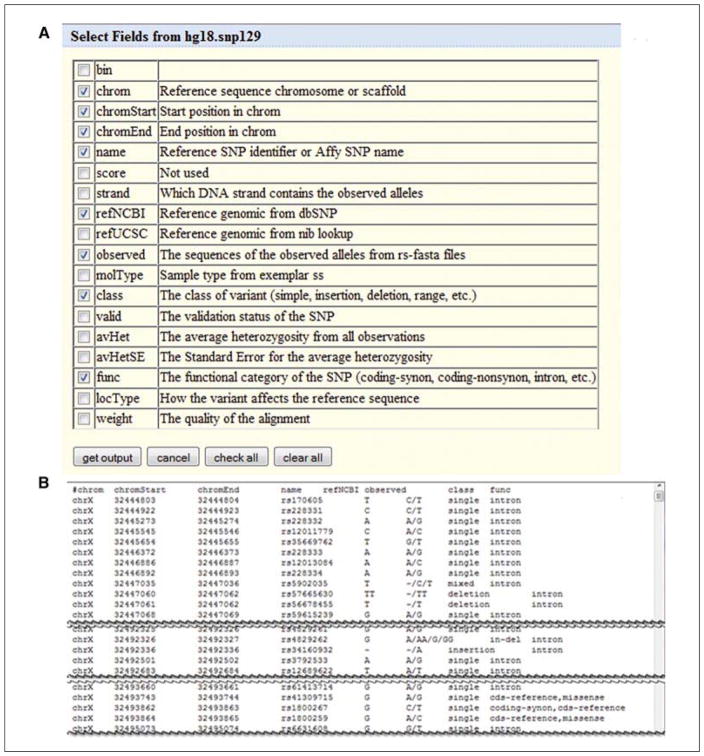
Now get a list of the SNPs, with the location, their name or ID, the reference nucleotide and observed altered sequence data, the class of SNP, and the function of the SNP. To obtain this, click the checkboxes as shown in Figure 19.9.13A: “chrom,” “chromStart,” “chromEnd,” “name,” “refNCBI,” “observed,” “class,” and “func.” Additional data from other tables which are found below this section could be accessed, but that is beyond the scope of this unit. In this case these choices are sufficient, so click the “get output” button.
Just the topmost section and a few other selected sections of the over 3000 SNPs in the results are shown in Figure 19.9.13B. The data can be copied and pasted into a text file, or one could go back and use the form to output to a file for later use.
Figure 19.9.11.
Overview of the Table Browser interface with steps highlighted (arrows). Many choices for data type, genomic regions, operations and output of the data are available. To quickly reset any previous choices, filters, or other aspects, click the reset link near the bottom of the form (red box). For the color version of this figure go to http://www.currentprotocols.com/protocol/mb1909.
Figure 19.9.12.
A variety of output choices are available to obtain results from the Table Browser. Additionally the data can be sent directly to the Galaxy tool for further exploration.
Figure 19.9.13.
(A) The Table Browser interface offers the opportunity to specify data types for the output by selecting fields from the list of available items. (B) Output shows samples of the selected items.
ALTERNATE PROTOCOL 2. START WITH A LIST OF SNPs AND USE THE UCSC GENOME BROWSER TO DETERMINE THE GENES IN WHICH THEY RESIDE
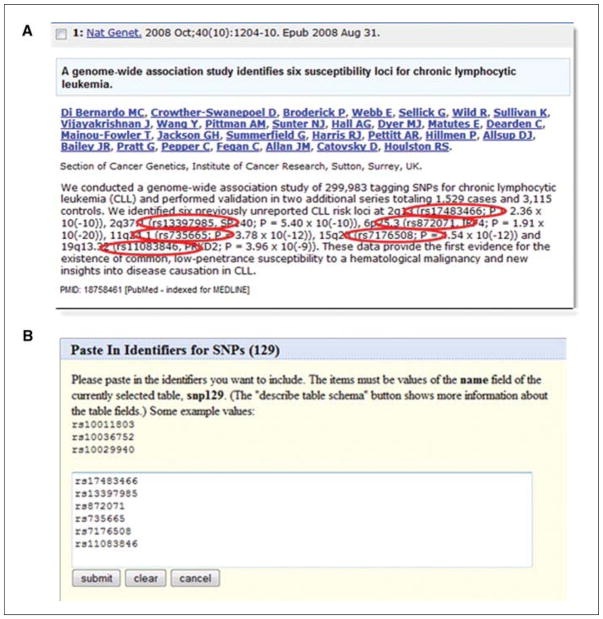
The queries so far have begun with the expectation that there is a region of interest, and that a user wants to know more about the items in there. There may be times where there are some items of interest, and to see where they map and to obtain additional context about them would be the goal. For example, there could be a list of SNPs that seem to be important from a genome-wide association study, and it would be worthwhile to see if they occur in genes of interest to a project. This example will start with a list of items, and the task will be to obtain more genomic data and annotations around them. The publication illustrated in Figure 19.9.14A will be used as the starting point, which is accessible at the URL http://www.ncbi.nlm.nih.gov/pubmed/18758461 (Di Bernardo et al., 2008).
Figure 19.9.14.
The Table Browser will accept lists of identifiers as appropriate for specific tables. Here, rsIDs from dbSNP as gleaned from the literature (A) can be pasted directly into the Table Browser to limit the search (B).
Access the UCSC Genome Browser at the URL http://genome.ucsc.edu. Click either the Tables link in the top navigation bar or the Table Browser link on the left navigation bar.
A form interface will appear as described in Basic Protocol 2. If previous queries have already been done, it is wise to fully reset the form. Click the link near the bottom that says: “To reset all user cart settings (including custom tracks), click here”.
-
When the page reloads, start this fresh query. It begins with SNPs, so set the first fields as follows:
clade: Mammal
genome: Human
assembly: Mar. 2006
group: Variation and Repeats
track: SNPS (129)
table: snp129
-
In this example, the goal is not just to look for one region, but to look for six places to correspond with the six SNPs in the abstract. This list of SNPs will form the basis of the locations to be found, so create a list of identifiers:
   rs17483466
   rs13397985
   rs872071
   rs735665
   rs7176508
   rs11083846
This list could be typed in, or created as a text file on the desktop. The “paste list” option will be shown here (Fig. 19.9.14B). Click the “paste list” button, which can be found in the “identifiers (names/accessions)” row of the table browser interface, and either type or paste in these six items. Click “submit” on the Paste In Identifiers for SNPs screen to store them.
The Table Browser screen will reappear. To obtain just the genomic locations for each of these SNPs, choose the “output format” as “selected fields from primary and related tables”, then click “get output”.
- When asked for fields, select chrom, chromStart, chromEnd, name. Click “get output” at the bottom of this table. The results should look like this:
   #chrom      chromStart      chromEnd      name
   chr2           230799466      230799467     rs13397985
   chr2           111513928      111513929     rs17483466
   chr6           356063            356064           rs872071
   chr11         122866606      122866607     rs735665
   chr15         67806043        67806044       rs7176508
   chr19         51899493        51899494       rs11083846
With each SNP location now determined, this information can be used to ask which genes contain these SNP locations. Copy the data on the Web page. This will form the basis of the query to find the genes.
Return to the Table Browser interface. Reset all user cart settings to clear prior choices (see step 2). The interface should reload with a fresh Table Browser. By default, it will offer Genes and Gene Prediction Tracks, UCSC Genes, and knownGene as the data types to query. In this case, this is what is required, but the goal is to find the genes corresponding to the six SNP locations identified above.
In the “region” row, click the “define regions” button. Paste the results of the SNP query in the text box and click “submit”. This should bring the user back to the Table Browser interface. To ask for the output to contain several items stored in different tables, choose, from the “output format” pull-down menu, “selected fields from primary and related tables”. Click the “get output” button.
Select the check boxes for “name”, “chrom”, “txStart”, and “txEnd” from the upper table. This will give the UCSC Identifier name, the chromosome, and the transcription start and end coordinates for the genes. Specifying the transcription boundary may not capture all possible regulatory elements that may be important, but this example will just use the transcription range.
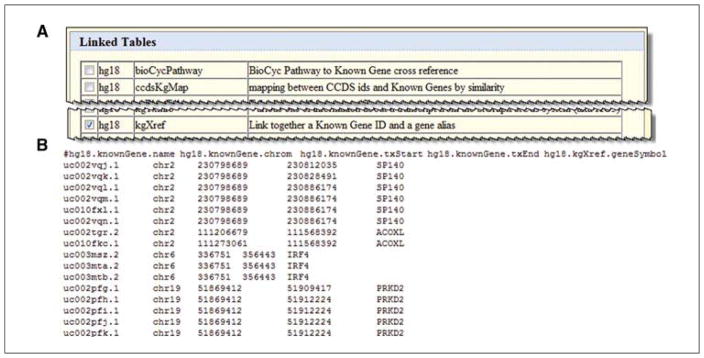
Data from linked tables is needed at this time as well. Linked tables are found below the original table (Fig. 19.9.15A). The gene symbol is found in a table called kgXref (stands for known gene cross-reference). Click the check box next to the “kgXref” row, about halfway down the linked tables area.
At the bottom click the Allow Selection from Checked Tables button to enable the gene symbol data to appear as choices.
In the “hg18.kgXref” fields box, click “geneSymbol”.
Click the “get output” button under the top box. The results should show the table of items as selected (Fig. 19.9.15B).
-
Four genes match the SNPs: SP140, ACOXL, IRF4, and PRKD2. Appropriate SNP matches can be determined by comparing the location data. It is also clear that two of the SNPs are not found within the transcription boundaries of a known gene.
There are multiple ways to continue to examine these data and build more intricate queries, but this should offer a taste of how one can obtain data from a list of items. The Table Browser interface may also be used from within the Galaxy framework for continued analysis of the data using numerous algorithms.
Figure 19.9.15.
(A) Using the “selected fields from primary and related tables” option, the output of the Table Browser can be configured to join data from several tables. This will include tables linked to the first query tables, which are available to add to the query lower on the selection page. (B) Output from main table and linked tables is provided.
ALTERNATE PROTOCOL 3. DISCOVER FUNCTIONAL ANNOTATIONS FOR A LIST OF GENES USING THE TABLE BROWSER OF THE UCSC GENOME BROWSER
There may be times when a researcher has a list of genes and wishes to examine them in more detail. High-throughput studies, database searches, or simply collections from the literature may yield leads of interest for further study. To focus and prioritize, it may be valuable to add information to the lists. A Table Browser query starting with a gene list may accomplish this. This query will begin by collecting all the known genes on human chromosome 21, and then adding Gene Ontology description terms to the list.
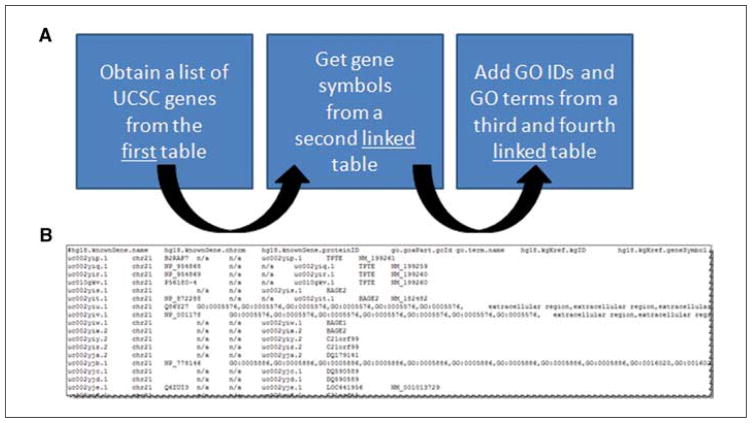
In diagrammatic form, Figure 19.9.16A indicates what will be done. A list of UCSC genes will be obtained from the first table, corresponding gene symbols will be obtained from a second table, and Gene Ontology identifiers and terms will be obtained from additional linked tables.
Figure 19.9.16.
For certain tables (notably those associated with the UCSC Genes track and its main table, knownGene) several layers of linked tables (presented diagrammatically in A) may contain information of interest. They can be joined together with successive steps to provide a table of data from the linked tables (B). Here, the Gene Ontology (GO) data are pulled from a different table, “go”, that is available for linkage from several different assembly-specific databases.
Access the UCSC Genome Browser at the URL http://genome.ucsc.edu. Click either the Tables link in the top navigation bar or the Table Browser link on the left navigation bar.
The form interface (Table Browser) will appear. If prior queries have already been done, it is wise to fully reset the form. Click the link near the bottom that says: “To reset all user cart settings (including custom tracks), click here”.
-
Make these choices on the Table Browser:
clade: Mammal
genome: Human
assembly: Mar. 2006
group: Genes and Gene Prediction Tracks
track: UCSC Genes
table: knownGene
Choose the “position” radio button and type chr21 as the location. Click “lookup” to quickly add the whole nucleotide range.
Leave all other choices as default and choose “selected fields from primary and related tables” in the “output format” menu. Click “get output”.
On the next page choose the items for the output. At the top is the primary table selection area. Select “name” and “chrom” and “proteinID” for the purposes of this query.
Now add data from linked tables. In the lower area (Linked Tables), select one table which provides needed data by clicking the check box for “kgXref” (Fig. 19.9.15A). This is a cross-reference table for various identifiers. Now click Allow Selection from Checked Tables at the bottom of the page to view the choices of data that can be pulled from this table.
In the “hg18.kgXref” fields box, choose “kgID” and “geneSymbol” and “refseq” fields by clicking the check boxes.
By making the kgXref table available, new tables associated with that table become available in the “Linked Tables” area. One of the new choices is “go”. Click the check box next to “go” for the “goaPart” table. Click “Allow Selection from Checked Tables” to view the choices for that table.
In the new table choices for “go.goaPart fields”, select the field “gold” for GO numerical identifiers.
Now add GO terms. In the Linked Tables area, a new “go” option is present. Click the check box next to the “go” term. Click Allow Selection from Checked Tables to view the choices for that table.
In the “go.term fields” table, check the box for “name”.
-
Return to the uppermost box and click “get output” to pull all of the data from this complex query. When the result is returned, the outcome should be a table of data with “knownGene”, “hgXref”, and “go” columns (Fig. 19.9.16B).
It may take a significant amount of time to run this query. Asking for information on all the genes on a whole chromosome (even a small one) can be time-intensive, and joining multiple tables makes this database query very complex.Not all genes will have descriptive annotations. Some will have multiple aspects. Researchers might choose to focus on transmembrane receptors, or kinases, or extracellular region proteins, depending on the goals of the research. One might also choose to start the query from functional annotations and work the other way to get to genomic regions. The main point is that a list of items can be the starting point and value can be added to the list by extracting additional information from the underlying database.
BASIC PROTOCOL 3. USE THE UCSC GENOME BROWSER GENE SORTER TO FIND HIGHLY EXPRESSED GENES IN A GIVEN TISSUE AND OBTAIN 200 BASES UPSTREAM OF THE TRANSCRIPTION START SITE FOR EACH
There may be times when it would be useful to find and manipulate lists of genes based on certain criteria such as expression patterns, protein homology, or various other features. At the UCSC Genome Browser, a tool called Gene Sorter enables users to perform these creative queries easily. This protocol will demonstrate how to obtain a list of genes highly expressed in the heart, and extract the upstream sequences in FASTA format. These data could subsequently be used in another tool to look for interesting motifs in the sequences.
Access the UCSC Genome Browser at the URL http://genome.ucsc.edu. Navigate to the Gene Sorter interface by clicking the link for Gene Sorter from either the top or left-hand navigation bars on the homepage.
-
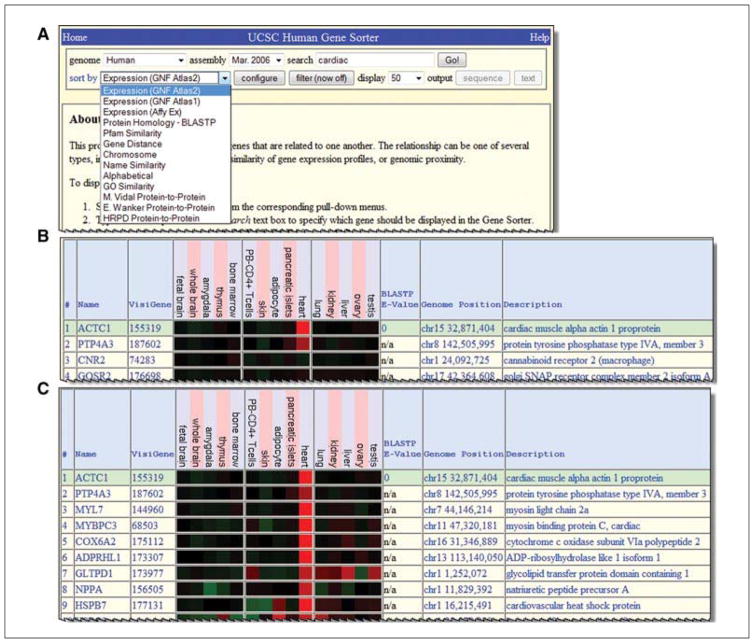
The window will reload with a small form interface as shown in Figure 19.9.17A.
This tool works on a subset of the species available in the full browser. Focus on the default setting of human and the current assembly for this example. Select a gene to get started. This is a rather arbitrary choice, so if there is not a specific gene for the project, just put any gene symbol in to get started, and subsequent sorting and filtering will yield an appropriate list. In this case, just put the word cardiac in the text box, since it would be expected that there are useful genes with that term in their descriptions.
The goal of this example is to examine gene expression, so choose to view one of the expression data sets stored in this collection. Other times, researchers might want to sort by the other criteria, but for now use the default “GNF Atlas2” data set as the “sort by” option.
Click the Go! button to begin.
From the list of results, click the first item, ACTC1, for a cardiac actin. The preliminary results show the data with ACTC1 as the top item, and other genes listed below that, sorted by expression data similarity (Fig. 19.9.17B). However, this list needs to be enriched for more genes expressed in heart.
-
The “configure” button can be used to add a variety of other data types and additional tissues to the display, but for this example those choices will not be included. Instead, move to the “filter” option. This query will be set to ask for genes that are expressed above a certain value in heart. Click “filter” to access the choices.
On the filter interface there are several options. Focus on the GNF Atlas 2 area. It explains that the expression values range from about −5.0 to 5.0 for low to high expression, respectively.
For this example, the filter will be set to indicate that the data should contain the minimum expression in heart of 3. As this is a log2 scale, that means the query asks for genes that are expressed 8-fold more than average. Enter the data in the filter form to show a 3 in the “heart” row in the Minimum column. This indicates that genes whose expression value is 3 or higher will be visible in the sorting list.
-
Click the “submit” button at the top to enforce this filter. The results list should reload, and the genes will show much higher expression levels in heart than the initial list (Fig 19.9.17C).
It should be apparent that many more genes with high levels of expression in heart are displayed. Other tissues could also be selected to be filtered out at this point by going back to the filter and eliminating those with expression in liver, for example, but for the present example, just continue with this list.
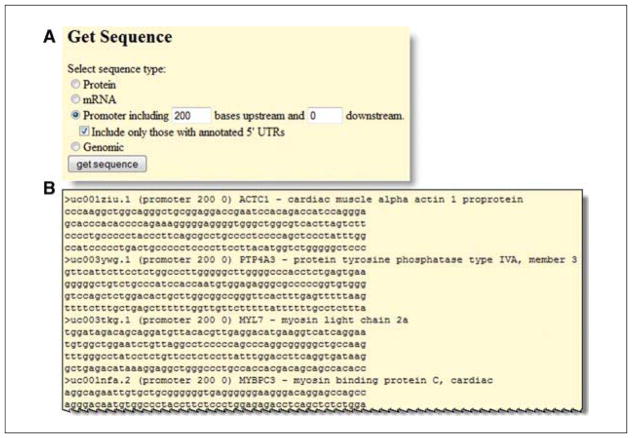
Obtain the sequences for these genes. At the top of the form is a button for “sequence”. Click that to set the type of sequence. In this case, select the radio button for Promoter and indicate that the 200 bases upstream of the transcription start and 0 downstream sequences are requested (Fig. 19.9.18A).
-
Click “get sequence” to obtain a list of gene sequences for upstream regions of these cardiac-expressed genes, which will be presented on a new Web page (Fig. 19.9.18B)
This list could be saved and used as the starting point for investigation of possible motifs in the upstream region that might be illuminating in understanding cardiac gene expression.
Figure 19.9.17.
The Gene Sorter allows data in a large number of columns (fields) to be sorted using a number of different criteria. Here, data from the GNF Atlas (A) is used to find genes expressed with a tissue pattern similar to a cardiac muscle gene, ACTC1 (B, gene list prior to filtering; C, after filtering for high expression).
Figure 19.9.18.
The “sequence” output option to the Gene Sorter provides the option to retrieve sequences of several types, including protein, mRNA and genomic DNA. Here the promoter sequence of 200 bases upstream of the transcription start site has been selected (A) and output for all genes in the list is displayed (B).
BASIC PROTOCOL 4. CREATING A SIMPLE CUSTOM TRACK IN THE UCSC GENOME BROWSER TO DISPLAY DATA
Clones, primers, SNPs, or anything else for which genomic location information is available can be overlaid on the UCSC Genome Browser. In this case imagine that there are three primers for a human gene of interest called Iceberg. However, this is only one data type that one might want to display. This protocol walks through the basic steps to generate a track showing those data. There are essentially four steps: (1) describe how the browser should look when a track is opened; (2) define the track features like name, color, and display; format the data in the appropriate columns with position, identifiers, or names, shading level of individual data items, and direction; (3) upload the track; and (4) view it. This does not require any programming skills. It merely requires that the text be put in the correct format.
Full details and additional complexity regarding this topic (including other more complicated styles of track display such as histograms in the “wiggle” format) can be found on the UCSC Genome Browser Web site at http://genome.ucsc.edu/goldenPath/help/customTrack.html.
This protocol starts with a text editor of any sort. Text in a structured column format with some spaces is needed to get started. This could be accomplished in many text programs or even spreadsheet programs. The format used in this example is called BED for Browser Extensible Data, which is the primary format used by the UCSC Genome Browser team, but other formats are also permitted.
- First tell the browser how to look when it opens a custom track. For this example, the display should focus on the coding area of the Iceberg gene, with the default number of pixels for the window, hide everything except the UCSC gene track, and show the restriction sites because those may be used to check the PCR products from amplifications. In this case, each of the browser characteristics is defined on a separate line:
   browser position chr11:104,514,740–104,515,016
   browser pix 800
   browser hide all
   browser pack knownGene
   browser pack cutters
-
Next establish some things desired in the track. Name the track myprimers, which is a set of “primers for the Iceberg gene”, which should be shown in “pack” display and be blue in color. Here is text that says that in the proper format:
   track name=myprimers description=“primers for the
      Iceberg gene” visibility=3 color=0,0,255 useScore=0
This would be on one single line in the text document without a hard return, but it may not appear that way in this unit. Visibility codes are: 0-hide, 1-dense, 2-full, 3-pack, 4=squish. Colors are in RGB notation with 255 levels of each color available. - Now add the position and specific features of the data items, which in this case are primers. Draw them as fat boxes in a nucleotide range, give them appropriate names, shade them (a range of 1 to 1000 indicates the depth of shading; in this case, the items will be the darkest possible), and indicate the 5′ to 3′ direction with arrowheads using the + or − to indicate the strand direction of forward or reverse.
   chr11 104514750 104514771 endprimer 1000 +
   chr11 104514991 104515016 beginprimer 1000 −
   chr11 104514910 104514930 middleprimer 1000 −
-
The fields in use here are a BED 6 file format. Additional types of features can be indicated with additional columns, but that is beyond the scope of this example. Documentation on the custom tracks options provides more details.
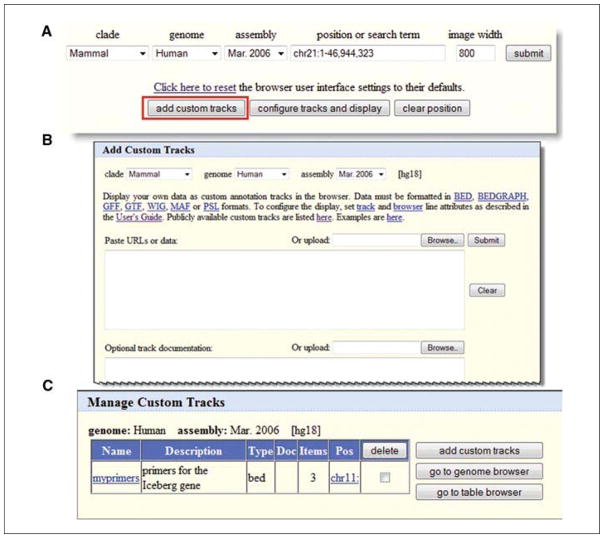
Now assemble the entire text in one piece:browser position chr11:104,514,740–104,515,016 browser pix 800 browser hide all browser pack knownGene browser pack cutters track name=myprimers description=“primers for the Iceberg gene” visibility=3 color=0,0,255 useScore=0 chr11 104514750 104514771 endprimer 1000 + chr11 104514991 104515016 beginprimer 1000 − chr11 104514910 104514930 middleprimer 1000 −This is the text that can be taken to the UCSC Genome Browser and uploaded as a custom track. A text file can simply be uploaded, or it can be copied and pasted into the interface. There are numerous buttons that can be used to upload the custom track data, but use the first one found on the Gateway page for this example (Fig. 19.9.19A).
Clicking an “add custom tracks” button provides a new interface for entering the tracks (Fig. 19.9.19B). On the custom track interface, indicate the species and assembly to which the track should apply, though the browser remembers your choices if one arrived here from a browser view of an assembly. Either upload the file or paste the text in the upper text box. Additional information can be added that describes the data in the “Optional track documentation” box. These are the data that would become available to users who click on the items. In this case, that information will not be added, but it may be something to consider when sharing tracks with colleagues. Paste the text from step 5 above, then click Submit.
The track becomes one item in a list of possible tracks a user can manipulate at this point (Fig. 19.9.19C). Other tracks can be added to expand this list, but for this example simply continue to explore the options on this one track.
-
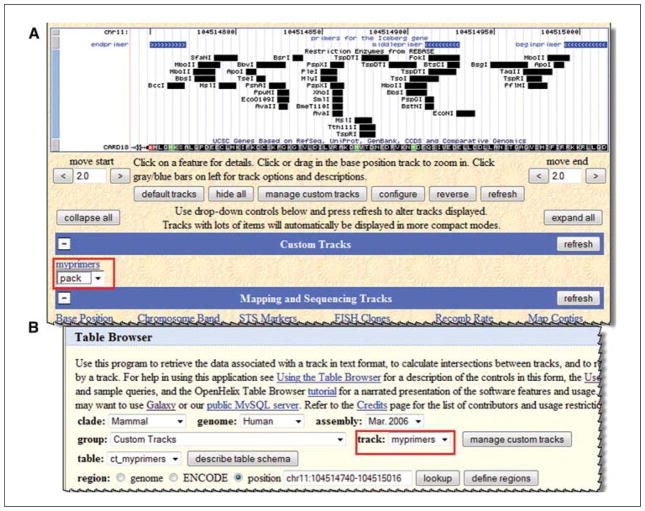
At this point, one could examine the data in this track in the genome browser viewer or begin to use it as a query option in the table browser. Start with a look at how it appears in the browser by clicking the button “go to genome browser”. The display will be shown in the Genome viewer interface (Fig. 19.9.20A).
Once a custom track is in place, query and analysis of the data in the context of the other genomic data is possible as with any other track in the viewer or in the Table Browser. This track can be shared with others, and everyone can know what primers are available. It is also possible to keep a clone collection for the lab or to show SNPs that a group has discovered. The possibilities are nearly endless. In addition to the graphical view, a return to the “Manage Custom Tracks” page will offer the option to load a track to make it available in the table browser. Click “go to table browser” from the Manager page and the track becomes available for those complex table browser queries just like any other track (Fig. 19.9.20B).
Figure 19.9.19.
Users may add data of their own to the Genome Browser via the Custom Tracks feature. (A) Access the Custom Tracks feature by selecting the button on the Gateway page. This button is also available on the main browser graphic display page and on the Table Browser interface. (B). Data may be uploaded by a variety of methods, including finding a file on a local computer (Browse …), pasting in a URL for a Web-accessible file, or pasting in the data directly (i.e., paste URLs or data). Several different file formats are accepted (top). (C) All custom tracks that have been uploaded are available under the “manage custom tracks”, button on the main browser page (replaces “add custom tracks” when custom tracks have been added).
Figure 19.9.20.
(A) Custom tracks are available for display in the main browser graphic in the same way as resident tracks and may be controlled via pull-down menus in the same way (red box). (B) Custom Tracks are also available in the Table Browser (red box) and can be queried in the same fashion as resident tracks. For the color version of this figure go to http://www.currentprotocols.com/protocol/mb1909.
COMMENTARY
At this juncture in scientific research, effective use of electronic data resources for query and display of molecular biology data is a requirement. The volume of data available to researchers exceeds the capacity of the traditional literature strategies for understanding many aspects of genomic context. Electronic data management is definitely an essential skill in this field. This unit, describing many of the functions of the UCSC Genome Browser, will enable researchers to make more efficient use of this resource. This introduction can only begin to expose the wealth of information available, and to seed ideas for the types of complex queries that can be posed on biomedical data to enhance and guide laboratory work. Other tools that have not been described here, including in silico PCR for virtual PCR queries, the Proteome Browser for protein-level data, Genome Graphs for visualizing genome-wide association study data, VisiGene for queries that offer image data for gene expression experiments, and the large Encyclopedia of DNA Elements (ENCODE) project data collection (ENCODE Consortium, 2007) can expand the reach as well. Researchers are encouraged to explore these other inter-linked interfaces and portals at the UCSC Genome Browser site. The data can also be used for further exploration employing other tools such as Galaxy (http://galaxyprvject.org), as well as other sites and algorithms in the field of bioinformatics. Users can also deepen their understanding of the features and methods at the links for Training on the UCSC Genome Browser homepage to access a variety of additional training and documentation choices. Assistance with all aspects of using this resource is also available in the form of active mailing lists that can be accessed from the Contact Us homepage area.
Literature Cited
- Di Bernardo MC, Crowther-Swanepoel D, Broderick P, Webb E, Sellick G, Wild R, Sullivan K, Vijayakrishnan J, Wang Y, Pittman AM, Sunter NJ, Hall AG, Dyer MJ, Matutes E, Dearden C, Mainou-Fowler T, Jackson GH, Summerfield G, Harris RJ, Pettitt AR, Hillmen P, Allsup DJ, Bailey JR, Pratt G, Pepper C, Fegan C, Allan JM, Catovsky D, Houlston RS. A genome-wide association study identifies six susceptibility loci for chronic lymphocytic leukemia. Nat Genet. 2008;40:1204–1210. doi: 10.1038/ng.219. [DOI] [PubMed] [Google Scholar]
- Kuhn RM, Karolchik D, Zweig AS, Wang T, Smith KE, Rosenbloom KR, Rhead B, Raney BJ, Pohl A, Pheasant M, Meyer L, Hsu F, Hinrichs AS, Harte RA, Giardine B, Fujita P, Diekhans M, Dreszer T, Clawson H, Barber GP, Haussler D, Kent WJ. The UCSC Genome Browser Database: Update 2009. Nucleic Acids Res. 2009;37:D755–D761. doi: 10.1093/nar/gkn875. [DOI] [PMC free article] [PubMed] [Google Scholar]
- The ENCODE Project Consortium. Identification and analysis of functional elements in 1 % of the human genome by the ENCODE pilot project. Nature. 2007;447:799–816. doi: 10.1038/nature05874. [DOI] [PMC free article] [PubMed] [Google Scholar]
- Strausberg RL, Feingold EA, Klausner RD, Collins FS. The mammalian gene collection. Science. 1999;286:455–457. doi: 10.1126/science.286.5439.455. [DOI] [PubMed] [Google Scholar]


