Abstract
Three-dimensional environmental boundaries fundamentally define the limits of a given space. A body of research employing a variety of methods points to their importance as cues in navigation. However, little is known about the nature of the representation of scene boundaries by high-level scene cortices in the human brain (namely, the parahippocampal place area (PPA) and retrosplenial cortex (RSC)). Here we use univariate and multivoxel pattern analysis to study classification performance for artificial scene images that vary in degree of vertical boundary structure (a flat 2D boundary, a very slight addition of 3D boundary, or full walls). Our findings present evidence that there are distinct neural components for representing two different aspects of boundaries: 1) acute sensitivity to the presence of grounded 3D vertical structure, represented by the PPA, and 2) whether a boundary introduces a significant impediment to the viewer’s potential navigation within a space, represented by RSC.
A fundamental challenge in scene perception is the selection of reliable visual cues to inform navigation. Boundaries are one of the central features that define a scene and restrict our movement within a given space. In a fundamental way, they contribute to the spatial layout and structural geometry of an environment. In the present research, we ask whether there exists a neural signature that distinguishes between boundaries that differ in terms of 1) vertical extent and 2) functional consequences to navigation. A boundary is generally defined as an extended surface that separates the outer limits of the local environment from other environments (Mou & Zhou, 2013).
Despite the obvious import for delineating the bounds of the surround, it is unclear what characteristics qualify a boundary as such. Does a surface only constitute an effective boundary once it imposes a limit on our movement or vision? It has long been noted that boundaries may be defined in terms of their functional affordance (Kosslyn, Pick & Fariello, 1974; Lever et al., 2009; Newcombe & Liben, 1982). However, a series of studies examining the reorientation abilities of young children (Lee & Spelke, 2008; 2011) demonstrate that a boundary’s effectiveness does not necessarily depend upon its navigational relevance. Lee and Spelke (2011) used a rectangular array that was defined by four columns that were connected by a suspended cord. Even though this manipulation effectively constrained children’s movement, they did not reorient geometrically in this type of array (i.e., they searched the four corners of the array at random). In contrast, children reoriented successfully in an array defined by a slight three-dimensional (3D) curb boundary that stood only 2 cm high (i.e., they searched more frequently at the target corner and its rotational equivalent—the signature search pattern of geometric reorientation). Rather than functional relevance, these findings highlight children’s exceptional sensitivity to boundaries that create subtle alterations in surface layout and do not dramatically impede motion. However, this sensitivity is tied to boundaries that introduce 3D structure (even if exceptionally slight), as children do not reorient geometrically in flat 2D arrays (Lee & Spelke, 2008; 2011). This suggests that children are highly sensitive to the slightest degree of 3D vertical information, and this may be one of the core and fundamental features that define a boundary.
Research also points to the important role of boundaries in the encoding of spatial location. Neurophysiological and neuroimaging studies demonstrate that oriented rats and humans encode both their own position and the positions of task-relevant objects relative to the borders of the navigable space (Doeller & Burgess, 2008; Doeller, King, & Burgess; Lever et al., 2002). At the cellular level, boundary vector cells (BVCs) fire whenever an environmental boundary intersects a receptive field located at a specific distance from the rat in a specific allocentric direction (Barry et al., 2006; Lever et al., 2009).
Studies using functional magnetic resonance imaging (fMRI) suggest that there may be specialized encoding of scene boundaries in high-level visual areas of the brain. This research has focused on scene-selective cortices: the parahippocampal place area (PPA) (Aguirre et al., 1996; Epstein & Kanwisher, 1998), and retrosplenial cortex (RSC) (Epstein 2008; Maguire, 2001). These areas respond strongly during passive viewing of navigationally relevant visual stimuli, such as scenes and buildings (Aguirre, Zarahn, & D’Esposito, 1998; Epstein & Kanwisher, 1998; Hasson et al., 2003; Nakamura et al., 2000). The collective literature indicates that the PPA is involved in representation of local physical scene structure (Epstein, 2003; Park & Chun, 2009; Park et al., 2011). Boundaries play a fundamental role in defining the layout of a scene—their presence or absence often qualifies whether a particular scene may be considered “open” or “closed.” As the PPA distinguishes between scenes categorized along the open/closed dimension (Park et al., 2011), we hypothesize that it may also represent the amount of vertical structure that a boundary presents. Research indicates that RSC is involved in locating and orienting the viewer within the broader spatial environment (Epstein, 2008; Epstein, Parker, & Feiler, 2007; Marchette et al., 2014). Given its role in representing a scene within the navigational environment, we hypothesize that RSC may represent the navigational relevance of a boundary.
In the present study we examine the neural representation of different boundary cues by systematically manipulating the vertical extent of a boundary in visually presented scene images. In Experiment 1, we test for sensitivity to slight changes in vertical height that parallel the developmental reorientation findings of Lee and Spelke (2008; 2011). In Experiment 2, we test whether the neural representation of boundaries aligns with participants’ judgments of functional affordance.
EXPERIMENT 1
Materials and Methods
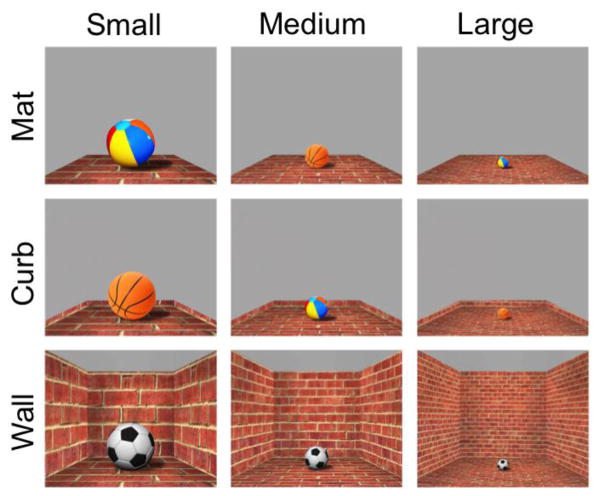
We measure the neural response of the PPA and RSC to visual stimuli that portray three different types of boundary cues: a mat condition in which no vertical structure is present, a curb condition where there is a very small addition of 3D structure, and a wall condition which resembles the wall structure typical of an indoor space (Figure 1). We hypothesize that if the slight 3D vertical cue of the curb makes a difference, as was observed in behavioral reorientation by Lee and Spelke (2008; 2011), then we expect to see a brain area that is sensitive to the slight addition of the curb on top of the mat, even though these two conditions are visually similar. On the other hand, if a slight vertical cue is not sufficient and salient amount of vertical structure is required, we hypothesize that the activity patterns of these ROIs will be quite similar for the mat condition and curb conditions, and only distinguishable for the wall condition. To explore whether the encoding of boundaries remains consistent across environments of both large and small spatial size, we include small, medium, and large spaces in the stimulus set.
Figure 1.
Illustration of the nine conditions of Experiment 1, shown for one of the 24 textures used.
The analysis is twofold: first, we use univariate analyses to compare overall activity for different boundary cues in the PPA and RSC. Second, we use multivariate analyses (multi-voxel pattern analysis, MVPA) to compare patterns of neural activity to hypothetical models of boundary representation. Lastly, we use a control manipulation with an independent group of participants to show that boundary representation in the PPA is not driven by low-level visual differences across the stimuli.
Participants
Twelve participants (6 females; 1 left-handed; ages 19–33 years) were recruited from the Johns Hopkins University community for financial compensation. All had normal or corrected-to-normal vision. Informed consent was obtained. The study protocol was approved by the Institutional Review Board of the Johns Hopkins University School of Medicine.
Visual stimuli
Artificial images were created using Autodesk Sketchbook Designer (2012) and Adobe Photoshop CS6. To systematically manipulate the type of boundary cue present within a scene, three different boundary cue conditions were included: mat, curb, and wall. We also aimed to explore whether the encoding of boundaries remains consistent across environments of both large and small spatial size, as some behavioral studies on spatial reorientation by children have found that use of a distinctive featural cue (i.e., one colored wall) is possible in larger, but not smaller, spaces (Learmonth, Nadel, & Newcombe, 2002; Learmonth et al., 2008). Previous research with adults using fMRI has also found a parametric representation of spatial size in anterior PPA and RSC (Park, Konkle, & Oliva, 2015). Three variations in size were included: small, medium, and large. Thus, the complete stimulus set included 9 conditions (Figure 1). Texture was used as a means of varying impression of the size of space. Larger textures were used for the small size, more fine-grained variations of the same textures were used for the large size, and the midpoint along the texture continuum was used for the medium size. Perspective and convergence lines were held constant across the three sizes. The stimuli also included an object with a well-known real-world size (either a soccer ball, basketball, or beach ball) as a cue to aid perception of boundary height and spatial size. Three different types of balls were used to increase visual variation, and ball types were equally distributed among the different textures and boundary conditions. The ball cues varied in size to correspond with the size of space. (To ensure that the presence of an object did not influence the results, a separate set of 12 participants were run with stimuli that did not include the ball cue. In all other respects, the stimuli were exactly the same as those described in Experiment 1. The results replicated the findings of Experiment 1.)
The complete stimulus set included 9 conditions, of 24 different textures each. Images were 800 × 600 pixel resolution (4.5° × 4.5° visual angle), and were presented in the scanner using an Epson PowerLite 7350 projector (type: XGA, brightness: 1600 ANSI Lumens).
Experimental Design
Twelve images from one of the 9 conditions were presented in blocks of 12 s each. Two blocks per condition were acquired within a run (length of one run = 6.13 mins, 184 TRs, total of 216 images presented per run). The order of blocks was randomized within each run and an 8 s fixation period followed each block. Each image was displayed for 800 ms, followed by a 200 ms blank. Participants performed a one-back repetition detection task in which they pressed a button whenever there was an immediate repetition of an image. All participants completed 12 runs of the experiment.
fMRI Data Acquisition
Imaging data were acquired with a 3 T Phillips fMRI scanner with a 32-channel phased-array head coil at the F. M. Kirby Research Center at Johns Hopkins University. Structural T1-weighted images were acquired using magnetization-prepared rapid-acquisition gradient echo (MPRAGE) with 1 × 1 × 1 mm voxels. Functional images were acquired with a gradient echo-planar T2* sequence ((2.5 × 2.5 × 2.5 mm voxels, TR 2 s, TE 30 ms, flip angle = 70°), 36 axial 2.5 mm slices (.5 mm gap), acquired parallel to the anterior commissure-posterior commissure line).
fMRI Data Analysis
Functional data were preprocessed using Brain Voyager QX software (Brain Innovation, Maastricht, Netherlands). Preprocessing included slice scan-time correction, linear trend removal, and three-dimensional motion correction. No additional spatial or temporal smoothing was performed and data were analyzed on individual ACPC space. For retinotopic analysis of V1, the cortical surface of each subject was reconstructed from the high-resolution T1-weighted anatomical scan, acquired with a 3D MPRAGE protocol. These 3D brains were inflated using the BV surface module and the obtained retinotopic functional maps were superimposed on the surface-rendered cortex.
Regions of interest (ROIs) were defined for each participant using a localizer. A localizer run presented blocks of images that were grouped by condition: scenes, faces (half female, half male), real-world objects, and scrambled objects. Scrambled object images were created by dividing intact object images into a 16 × 16 square grid and then scrambling positions of the resulting squares based on eccentricity (Kourtzi & Kanwisher, 2001). There were four blocks per condition, presented for 16 s with 10 s rest periods. Within each block, each image was presented for 600 ms with 200 ms fixation. There were 20 images per block. During these blocks, participants performed a one-back repetition detection task.
The retinotopic localizer presented vertical and horizontal visual field meridians to delineate borders of retinotopic areas (Spiridon & Kanwisher, 2002). Triangular wedges of black and white checkerboards were presented either vertically (upper or lower vertical meridians) or horizontally (left or right horizontal meridians) in 12 s blocks, alternating with 12 s blanks. During these blocks participants were instructed to fixate on a small central dot.
The left and right PPA were defined separately for individual subjects by contrasting brain activity of scene blocks – object blocks and identifying clusters between the posterior parahippocampal gyrus and anterior lingual gyrus. The single continuous cluster of voxels that passed the threshold of an ROI localizer (p < .0001, cluster threshold of 4) was used. This contrast also defined left and right RSC near the posterior cingulate cortex. The left and right LOC were defined by contrasting brain activity of object – scrambled object blocks in the lateral occipital lobe. The retinotopic borders of left and right V1 were defined with a contrast between vertical and horizontal meridians.
The average number of voxels for each of the ROIs in Study 1 (after mapping onto the structural 1 × 1 × 1 voxel space), as well as the average peak Talaraich coordinates (x, y, z) for each of the ROIs were as follows: left (L) PPA, 828 voxels (−29, −44, −9); right (R) PPA, 986 voxels (20, −44, −11); LRSC, 781 voxels (−20, −58, 11); RRSC, 1041 voxels (15, −57, 13); LLOC, 992 voxels (−48, −69, −5); RLOC, 988 voxels (43, −70, −5); L primary visual area (LV1), 6388 voxels; and RV1, 6352 voxels. The two scene ROIs of PPA and RSC did not differ from one another in size (number of voxels) in either the right or left hemisphere (all ps > .24, two-tailed).
Univariate analysis
A general linear model (GLM) was computed to obtain estimates of the overall average activity in these ROIs. A GLM was computed on the time courses obtained for each ROI to extract beta values that provide an estimated effect size of the univariate response for each condition. Each block of conditions was separately estimated by the hemodynamic response function, and entered as predictors in the GLM.
Multivariate pattern analysis
Patterns of activity were extracted across the voxels of an ROI for each block of the 9 conditions. The MRI signal intensity from each voxel within an ROI across all time points was transformed into z-scores by run, so that the mean activity was set to 0 and the SD was set to 1. This helps mitigate overall differences in fMRI signal across different ROIs, as well as across runs and sessions (Kamitani & Tong, 2005). The activity level for each block of each individual voxel was labeled with its respective condition, which spanned 12 s (6 TR), with a 4 s (2 TR) offset to account for the hemodynamic delay of the blood oxygenation level-dependent (BOLD) response. These time points were averaged to generate a pattern across voxels within an ROI for each stimulus block.
A linear support vector machine (SVM) (using LIBSVM, http://sourceforge.net/projects/svm) classifier was trained to assign the correct condition label to the voxel activation patterns of each ROI for each individual participant. We employed a leave-one-out cross validation method in which one of the blocks was left out of the training sample. The data from the left-out run were then submitted to the classifier, which generated predictions for the condition labels. This was repeated so that each block of the dataset played a role in training and testing. For multi-class classification, we used a “one-against-one” approach and a standard majority voting scheme to resolve discrepancies in labeling (Walther et al., 2009). Percent correct classification for each subject and each ROI was calculated as the average performance over the cross-validation iterations.
Results
Analysis of Univariate Response
We first considered the average amount of activity in each ROI (PPA, RSC, LOC, and V1) in response to the different boundary cue conditions. If the existence of a slight vertical 3D boundary plays an important role in defining a space, we would expect these ROIs to demonstrate different responses to the mat vs. curb conditions. On the other hand, if a slight vertical 3D boundary is not effective in defining a space, we would expect these ROIs to demonstrate no difference in amount of activity for the mat vs. curb conditions.
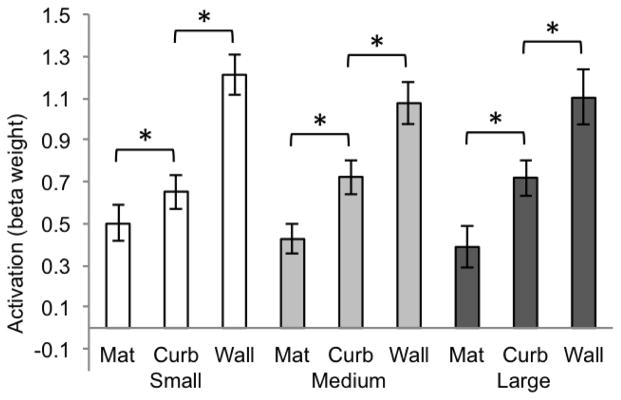
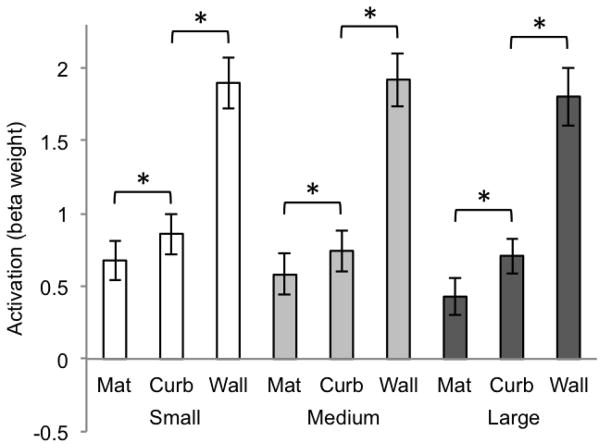
Two-way within-subjects analyses of variance were computed separately for each ROI (size × boundary cue). (All reported p values are Geisser-Greenhouse corrected for non-sphericity.) In the PPA (Figure 2), the main effect of size was not significant (F(2, 20) = 2.35, p = .13) and the main effect of boundary cue was significant (F(2, 20) = 53.28, p < .0001). There was no interaction between the factors of size and boundary cue (F(4, 40) = 2.79, p = .08). To test the effect of the three different boundary cue conditions, we computed paired t-tests within each of the size conditions. In the PPA, all boundary conditions were significantly different from one another (all ps < .008, Bonferroni corrected alpha level of significance for the multiple comparisons made within each ROI). This illustrates a step-wise pattern from mat, to curb, to wall, with the wall condition showing the highest activation and the mat showing the least. Most interestingly, the slight addition of vertical structure of the curb serves to set it apart from the mat, despite the fact that the two conditions are visually similar to one another.
Figure 2.
Beta weights for PPA for each of the 9 conditions of Experiment 1 (significance determined by t-test, p < .008, two-tailed). Error bars represent one standard error of the mean.
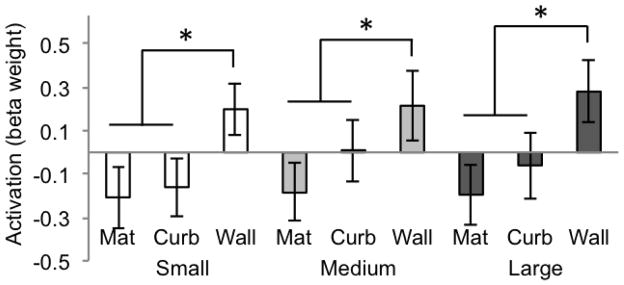
In RSC (Figure 3), the main effect of size was not significant (F(2, 20) = 2.09, p = .150), the main effect of boundary cue was significant (F(2, 20) = 46.64, p < .0001), and there was no interaction between size and boundary cue (F(4, 40) = 1.15, p = .35). Paired t-tests between the three boundary cue conditions revealed a different pattern in RSC compared to the PPA; the mat and curb conditions were no different (all ps > .008, two-tailed) for all size conditions, and the wall was the only condition found to be significantly different from the other two (all ps < .008, two-tailed). This indicates that RSC is sensitive to a high amount of vertical structure as displayed in the wall condition, but not slight variations as introduced by the transition from the mat to the curb. This pattern of results suggests that the scene-selectivity of RSC is sensitive to high amounts of geometric information (as is present in the wall condition), but less so when this information is not as strongly suggested (as in the mat and curb conditions).
Figure 3.
Beta weights for RSC for each condition of Experiment 1 (significance determined by t-test, p < .008, two-tailed). Error bars represent one standard error of the mean.
These results suggest that the PPA and RSC have different degrees of sensitivity to different types of boundary cues: while the PPA appears to be sensitive to very slight manipulations of 3D structure (e.g., the difference between the mat and curb), RSC is not sensitive to minimal 3D structure, but requires the strong vertical cue of the wall. To consider a potential interaction between the PPA and RSC, we computed a three-way within-subjects ANOVA (ROI (PPA, RSC) × size (small, medium, large) × boundary cue (mat, curb, wall)). This revealed a marginally significant main effect of ROI (F(1, 10) = 5.15, p = .06), a main effect of size (F(2, 20) = 7.82, p = .02), and a main effect of boundary cue (F(2, 20) = 22.52, p = .001). Most critically, there was a significant interaction between ROI and boundary cue (F(2, 20) = 26.11, p = .001), suggesting that sensitivity to boundary cues is consistently different across the PPA and RSC.
Next, we turned to consider the pattern of univariate response for other regions that are not selectively sensitive to scenes; the LOC and V1. For LOC (Figure 4), an ANOVA revealed a main effect of size (F(2, 20) = 4.30, p = .04), no main effect of boundary cue (F(2, 20) = 1.94, p = .19), and no interaction across size and boundary cue (F(4, 40) = 1.02, p = .39). While scene-specific ROIs (PPA and RSC) both showed a strong main effect of boundary cue, LOC did not. Further t-tests between boundary cue conditions for LOC did not indicate a systematic pattern of activity across the conditions—there was no clear step-wise progression or heightened response to the wall. This suggests that this object-selective region does not play a consistent role in the processing of scene boundaries.
Figure 4.
Beta weights for LOC for each of the 9 conditions of Experiment 1 (significance determined by t-test, p < .008, two-tailed). Error bars represent one standard error of the mean.
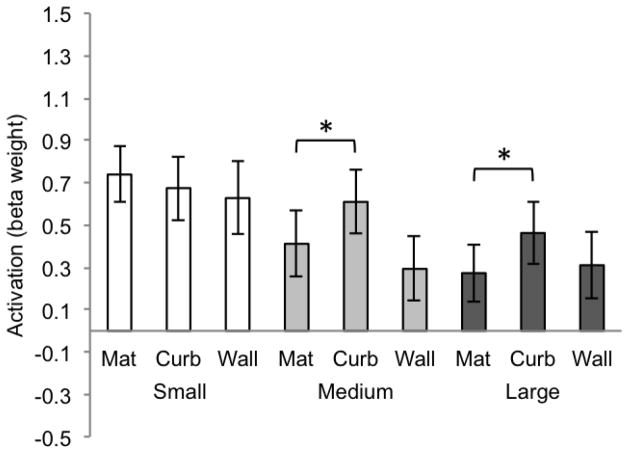
In V1 (Figure 5), there was a significant main effect of boundary cue (F(2, 20) = 37.08, p = .0001), no main effect of size (F(2, 20) = .28, p = .75), and no interaction across size and boundary cue (F(4, 40) = 1.23, p = .34). Further t-tests among boundary cue conditions showed that the pattern of univariate response demonstrated by V1 appears similar to that which was found for the PPA: a significant step-wise increase from mat, to curb, to wall, in all three variations of size (all ps < .008, two-tailed). This similarity is further explored in the subsequent section.
Figure 5.
Beta weights for V1 for each of the 9 conditions of Experiment 1 (significance determined by t-test, p < .008, two-tailed). Error bars represent one standard error of the mean.
The sensitivity to boundary cues was also replicated across three different sizes of space. We did not find a main effect for size in the PPA or RSC, which seemingly contradicts findings from a recent fMRI study that showed a parametric representation of spatial size in anterior PPA and RSC (Park et al., 2015). However, a notable stimuli difference between the two studies could account for the lack of a size effect in the current findings. Park et al. (2015) used images of real-world scenes (e.g., closet, auditorium) that increased in size in a log scale (e.g., from a confined space that could fit 1 to 2 people to an expansive area that could accommodate thousands of people). Accordingly, each of the spatial size categories were represented by scenes that had salient differences in spatial layout, perspective, texture gradient. The category of these scenes changed with increasing size (e.g., small bathroom to large stadium), and thus drew upon pre-existing knowledge about canonical size. In contrast, the current study used artificially created scenes that all belonged to one semantic category (empty room). Spatial layout and perspective were held constant over the alterations in spatial size. Perception of the size of space was manipulated only by variations in texture gradient and size of the object cue. The contrasting results between these two studies suggests that spatial size is represented in the brain as a multi-dimensional property, based on a combination of layout, perspective, texture gradient, and semantic category.
Disentangling low-level differences from representation of boundaries
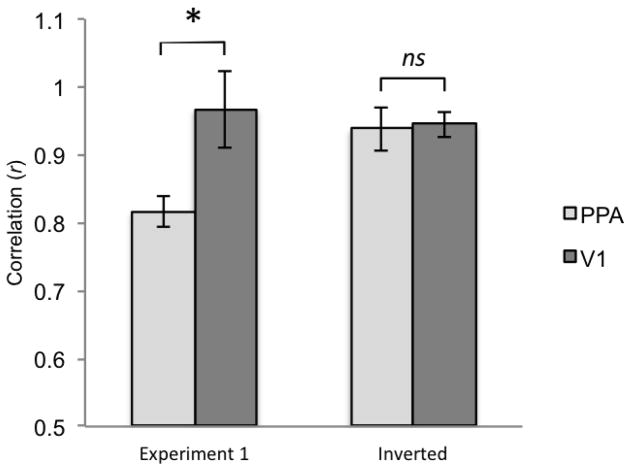
Sensitivity to the slight amount of 3D structure presented in the curb condition may not be a true characterization of the PPA’s representation of scene boundaries per se, but rather its response may be driven by low-level visual differences between the curb and mat stimuli (Arcaro et al., 2009; Rajimehr et al., 2011). There is a greater amount of visual input in the curb stimulus in comparison to the mat, and thus it is possible that both the PPA and V1 discriminate the conditions based on this difference alone. To quantify the difference in visual input from one condition to the next, we obtained a count of the number of pixels that belong to the region of the stimulus image that portrays the boundary cue (not including the solid grey background). The mat included 19552 pixels, the curb included 24664 pixels, and the wall included 96591 pixels. We next computed correlations between the univariate response of the PPA and V1 with the amount of pixels in the corresponding conditions. The resulting correlations were high for both regions (PPA: r = .82; V1: r = .97). However, the correlation obtained for V1 was significantly greater than that obtained for the PPA (t(9) = 3.78, p = .007) (Figure 6). This provides additional evidence that the response of V1 very closely corresponds to the amount of visual information portrayed in a particular boundary cue condition. The correlation for V1 (r = .97) is nearly equivalent to 1, suggesting a near perfect correlation between the univariate response of this area and the pixel amount in the stimulus images. The PPA’s response also correlates highly with pixel count, but an additional aspect of processing must be proposed to account for the significant differences observed between it and V1. We hypothesize that the PPA is finely tuned to detect the presence of 3D vertical structure, even if very slight, because this feature signifies the existence of a boundary in the present environment.
Figure 6.
Correlation values (r) for the univariate activity of the PPA and V1 with the amount of pixels in the boundary cue conditions, shown for Experiment 1 and for the inverted images. Error bars represent one standard error of the mean.
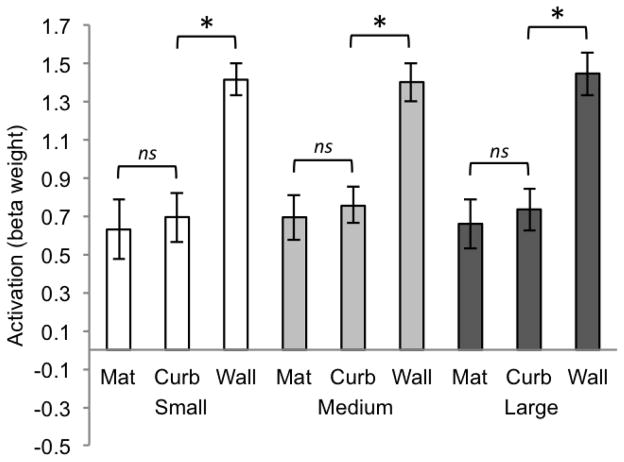
As a final step towards disentangling low-level visual information from representation of boundary cue, 12 additional subjects were run in a version of the study where the stimulus images were turned upside down. Inverting the images preserves the low level visual information of the stimuli, but erases the ecological validity of solid boundary structure that typically extends from the ground up. Our prediction was that the PPA’s sensitivity to the curb condition in comparison to the mat would now be diminished. This prediction was upheld, as activity for the PPA in response to the mat and curb inverted conditions were not significantly different from one another (Figure 7). We performed the same pixel analysis to calculate the correlation between univariate response and number of pixels in the stimulus image (which remains unchanged when the image is turned upside down). As is shown in Figure 6 (Inverted), the resulting correlations for the PPA and V1 are nearly identical (r = .94, r = .95, respectively). In contrast to the right side up images, the correlation obtained for V1 was not significantly greater than that obtained for the PPA (t(9) = −.31, p = .78). Inversion of the stimulus images erases the meaningful cue of 3D vertical structure that rises from the ground up, and the response of the PPA more closely tracks the number of pixels in the same manner as V1. Thus, we may conclude that the PPA’s sensitivity to different boundary cues in the upright images is not solely driven by low-level visual differences or a direct reflection of processing accomplished by V1.
Figure 7.
Beta weights for PPA for each of the 9 inverted conditions (significance determined by t-test, p < .008, two-tailed). Error bars represent one standard error of the mean.
Multivoxel Pattern Analysis
Comparison of the levels of univariate response indicated differences between the PPA and RSC’s sensitivity to the mat condition in comparison to the curb. However, univariate analyses may not be sensitive enough to capture the nature of the underlying representations of these two regions (Haxby et al., 2001). Linear SVM classification accuracy for condition by PPA, RSC, LOC, and V1 was significantly above chance (11.11%). These ROIs had respective classification accuracies of 27.98% for PPA (two-tailed t(10) = 8.19, p < .001); 18.51% for RSC (two-tailed t(10) = 4.42, p = .001); 25.44% for LOC (two-tailed t(10) = 5.36, p < .001); and 54.71% for V1 (two-tailed t(10) = 5.97, p = .001). These results demonstrate that multi-voxel patterns in these regions can distinguish between scenes varying in boundary height and size, however, it does not inform us about the nature of boundary representation in each region. For example, classification accuracy for the mat, curb and wall conditions may have contributed differently to averaged classification accuracy, and these contributions may differ across brain regions. We next examine these potential contributions by studying the types of confusion errors made by the classifier.
Analysis of the patterns of confusion errors made by a MVPA classifier can further reveal whether a particular brain region represents different types of boundary cues as similar or distinct from each other (e.g., Park et al., 2011). If there is systematic confusion between two conditions, this suggests that the region has similar representations for these conditions. To test the nature of boundary representation within a particular ROI, we established models of hypothetical confusion matrices. Values were assigned to each of the 81 cells in a 9 × 9 matrix to reflect different hypotheses. Figure 8.A illustrates the hypothesis that the mat, curb, and wall cues are uniquely represented as distinct from one another. This matrix would be observed if brain patterns are sensitive in distinguishing 3D vertical structure across the conditions, irrespective of size. Figure 8.B illustrates the hypothesis that the brain patterns from an ROI are insufficient to distinguish between the mat and curb cues (both given a value of 1), while the high degree of vertical structure in the wall cue stands apart (given a value of 2). This is the pattern that we might predict to see for RSC, based on the univariate response. Lastly, Figure 8.C illustrates a case in which the slight amount of vertical structure included in the curb cue is sufficient to render it indistinguishable from patterns associated with the wall boundary cue.
Figure 8.
Illustration of three theoretical 9-way confusion matrices set up to test the different hypotheses about the representation of boundary cues.
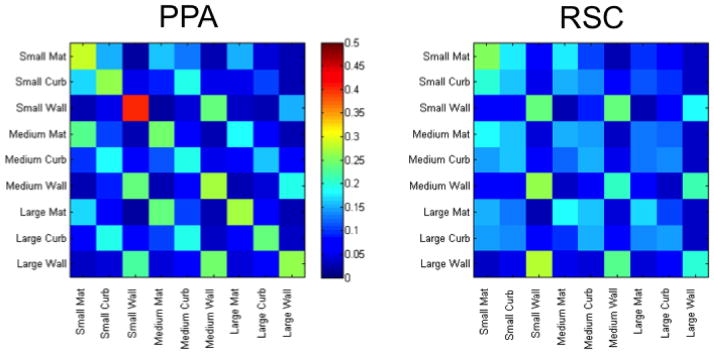
To quantify whether the multivoxel patterns found in the ROIs fit with a particular hypothesis, we computed correlations (Pearson’s r) between the hypothetical confusion matrices and the data obtained from each of the ROIs (Figure 9). The r values for individual subjects were converted to the normally distributed variable z using the Fisher’s z transformation. These values were then averaged across subjects for the separate ROIs.
Figure 9.
Confusion matrices generated by the classifier when trained on the different neural patterns obtained from the PPA and RSC in Experiment 1.
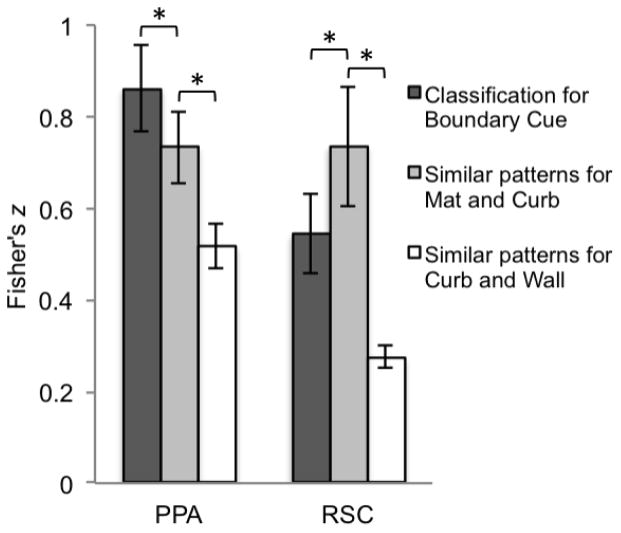
The PPA showed a strong correlation to the model that predicts sensitivity to all three types of boundary cues (z = .86, SE = .09) (Figure 10). This correlation was significantly greater (t(10) = 2.30, p = .04) than the PPA’s correlation to the model that predicts similar patterns for the mat and curb conditions (z = .73, SE = .07). Both these models had significantly higher correlations than the third model that predicts similar patterns for the curb and wall (z = .52, SE = .05; t(10) = 7.90, p < .001; t(10) = 4.02, p = .002), respectively.
Figure 10.
Average Fisher’s z values for the PPA and RSC, obtained by calculating correlation values between neural data and the three models (Classification for boundary cue, Similar patterns for mat and curb, and Similar patterns for curb and wall) (significance determined by t-test, p < .05, two-tailed). Error bars represent one standard error of the mean. There is a significant interaction of ROI and model (not depicted).
In contrast, RSC showed a significantly higher correlation to the model predicting similar patterns for mat and curb, (z = .74, SE = .13) compared to the model predicting classification for all three boundary cues (z = .54, SE = .09, t(10) = −4.89, p < .001; Figure 10). Both these models had significantly higher correlations than the third model that predicts similar patterns for curb and wall (z = .28, SE = .052; t(10) = 4.92, p < .001; t(10) = 5.28, p < .001, respectively). These analyses confirm that the MVPA data of RSC is best characterized by the hypothetical model that predicts similar patterns for the mat and curb conditions. A two-way within-subject ANOVA (ROI (PPA, RSC) × model (classification for boundary cue, similar patterns for mat and curb)) revealed a significant interaction of ROI and model (F(1, 10) = 22.37, p = .001), which indicates that the contribution of the models significantly differs between the PPA and RSC. Thus, their activity patterns reflect qualitatively different representations: the PPA is sensitive to each type of boundary cue as distinct from one other, while RSC is not sensitive to the minimal vertical cue present in the curb, showing consistent confusion between the mat and curb conditions.
LOC and V1 were also analyzed to explore which hypothetical representational model showed the strongest correlation to the confusion matrices generated by the classifier when trained on the neural data from these ROIs. For LOC, none of the correlations to any of the three models were significant (all ps > .15). This finding is not surprising, given that LOC is an area that is selectively responsive to objects and not scenes. For V1, we found significant correlations to the model predicting classification for all three boundary cues (z = .80, SE = .07) and the model predicting similar patterns for the mat and curb conditions (z = .69, SE = .11). The correlations to these two models did not differ from one another (t(10) = 1.65, p = .18). This reflects the sensitivity of V1 to differences between the three boundary conditions that is driven by low-level visual properties of the stimulus images, where the mat and the curb are more similar to one another in terms of pixel quantity in comparison to the wall.
EXPERIMENT 2
The results of Experiment 1 collectively indicate that the PPA shows acute sensitivity to the minimal visual cue of the curb. In contrast, the pattern of activity in RSC fails to distinguish between the curb and mat cues, and only treats the wall as different. One possible explanation is grounded in the observation that the small curb doesn’t have a substantial impact on the viewer’s potential locomotion within a scene. Boundaries may be characterized in terms of their imposed limitations to locomotion or vision (Kosslyn, Pick, & Fariello, 1974; Newcombe & Liben, 1982; Lee & Spelke, 2008). When presented with a scene boundary, perhaps one of the critical jobs of the visual system is to determine whether the extended vertical surface serves as a serious impendent to future navigation through the space—is the boundary one that constrains the viewer’s locomotion?
Researchers have characterized RSC as an area that is involved in navigation (Epstein, 2008; Maguire, 2001; Aguirre & D’Esposito, 1999). Adding the curb structure doesn’t dramatically change the functional relevance of a scene boundary, and thus RSC may not treat it as different from the mat. The full wall structure, on the other hand, is a boundary that does effectively limit and constrain a viewer’s potential interaction with the space. To test the hypothesis that RSC’s response is related to the functional affordance of a boundary, we use stimuli that incrementally vary in terms of boundary height on a more fine-grained scale. We hypothesize that RSC will demonstrate a modulation in response that is driven by a functional cut-off point—the point at which the boundary changes from something that the viewer could easily traverse, to something that limits the functional affordance of the scene.
Materials and Methods
Participants
A new set of 13 participants (7 females; all right-handed; ages 19–29 years) were recruited to participate in Experiment 2. One participant was excluded from the analyses due to excessive head movement (over 8 mm across runs). The analyses reported here were conducted using the data from the 12 remaining subjects.
Visual stimuli and behavioral measure of functional affordance
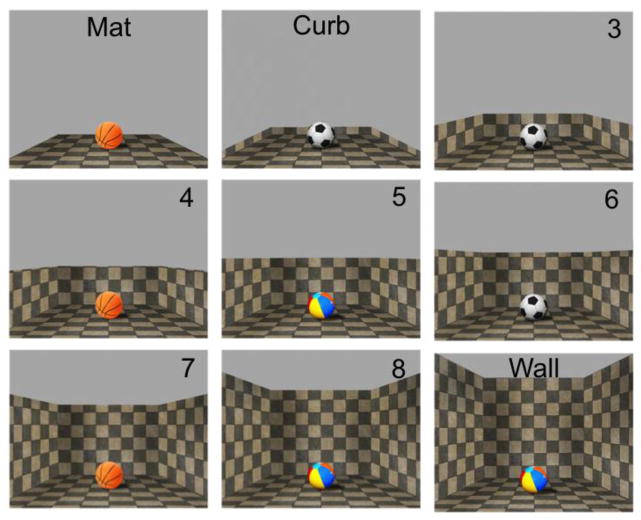
We created stimuli portraying boundaries of 9 different heights, which included the same object cue as was used in Experiment 1 (Figure 11). To focus specifically on potential differences in representation of boundary height, only the medium-sized texture of Experiment 1 was used. The mat, curb, and wall boundary heights from Experiment 1 were included in the stimulus set of Experiment 2 to facilitate direct comparison of these conditions to the new boundary heights. To build the boundary higher and higher, the same number of pixels was added for each increasing step in height. These stimuli were published to Amazon Mechanical Turk. Participants were asked to decide whether a boundary of a particular type appeared more like a curb, or more like a wall. Before beginning, participants were shown one example image each of a curb and a wall. For each subsequent image, participants chose either “curb” (easy to cross) or “wall” (difficult to cross). Thirty ratings for each stimulus image were obtained. Seven hundred and twenty ratings were obtained for each boundary height, from 50 participants.
Figure 11.
Illustration of the nine boundary height conditions of Experiment 2, shown for one of the 24 textures used.
The timing parameters and stimulus blocks of the fMRI portion of Experiment 2 exactly matched those of Experiment 1. Participants again performed a one-back repetition detection task to maintain attention.
Results
Behavioral judgment for functional affordance of a boundary
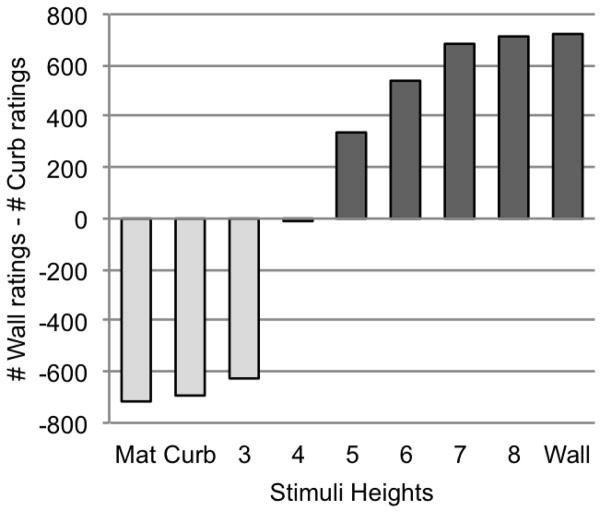
To consider the data collected from human observers via Mechanical Turk, we subtracted the number of curb ratings a particular boundary height received from the number of wall ratings that it received (Figure 12). We found that the boundary of height 4 received a nearly equal number of curb and wall ratings. This indicates the tipping point at which participants changed their ratings from “curb” to “wall.” After height 4, the boundaries of increasing height are judged to look more like limiting walls.
Figure 12.
Behavioral ratings shown for stimuli of each different boundary height. The y-axis plots the number of curb ratings a particular height received subtracted from the number of wall ratings it received.
Analysis of Univariate Response
Univariate analyses of the PPA and RSC revealed qualitatively different patterns of response. A two-way within-subjects ANOVA (ROI (PPA, RSC) × Boundary cue (9 conditions) revealed a significant main effect of ROI (F(1, 10) = 75.45, p < .0001), a significant main effect of boundary cue (F(8, 80) = 4.76, p < .0001), and a significant interaction between ROI and boundary cue (F(2, 80) = 3.82, p = .001). Using linear regression, we found a significant linear increase from the mat to the wall for both the PPA (F(1, 7) = 61.4, p < .001, R2 = .90) and RSC (F(1, 7) = 21.46, p < .002, R2 = .87). This suggests that both regions show an overall increase in activity as the boundary height increases.
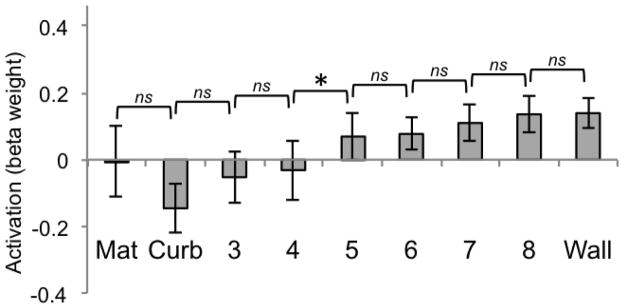
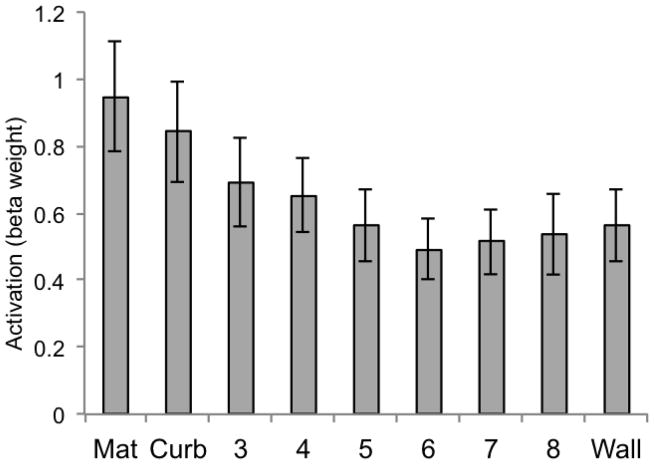
However, the critical question is whether the response of these ROIs parallels the perceptual tipping point as measured by behavioral judgments. To investigate how each region responded to incremental variations in boundary height, we calculated pairwise t-test comparisons at each increasing height level (e.g., mat vs. curb, curb vs. height 3, height 3 vs. height 4, and so forth). Because the same pixel amount was added from one increasing height to the next, this pairwise t-test comparison allows us to determine whether there is a tipping point at which an ROI changes its response despite the controlled amount of visual information. RSC (Figure 13) shows a shift from negative to positive activity that occurs at the transition from height 4 to height 5. Furthermore, the only pairwise comparison found to be statistically significant was between height 4 and height 5 (t(12) = −3.54, p < .0063, Bonferroni corrected alpha level of significance for the multiple comparisons made within each ROI). None of the other comparisons were significant, even though the amount of pixel increase from one condition to the next is constant (all ps > .11, two-tailed). These analyses indicate a qualitative shift that occurs between heights 4 and 5 for RSC, which precisely matches the point at which participants judged the conditions to change from a boundary that would be easy to cross to one that would be difficult to cross. To check for replication of the results of Experiment 1, we additionally compared activity for the mat vs. the curb and the wall vs. the curb. As was found for RSC in Experiment 1, the mat and the curb did not significantly differ (t(12) = 1.46, p = .18), but the curb and the wall did (t(12) = −2.92, p < .0063).
Figure 13.
Beta weights for RSC for each of the 9 conditions of Experiment 2 (significance determined by t-test, p < .0063, two-tailed). Error bars represent one standard error of the mean.
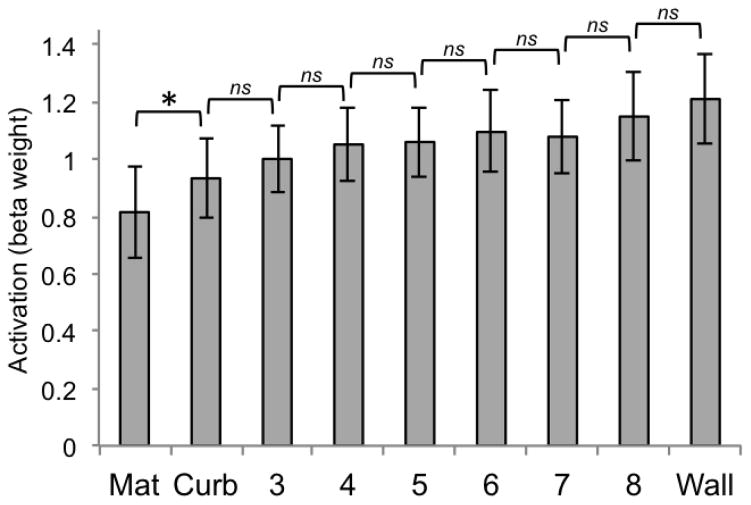
In contrast, the univariate response demonstrated by the PPA (Figure 14) revealed a different pattern. In this case, the only significant pairwise comparison occured between the mat and the curb conditions (t(12) = −3.78, p < .0063). Crucially, heights 4 and 5 were not different (t(12) = −.32, p = .76), which is the functional “decision point” for RSC. The statistical difference in univariate activity between the mat and curb replicates and extends the findings of Experiment 1, which also demonstrated the PPA’s sensitivity to differences in vertical structure between the mat and curb conditions (the curb and the wall were also significantly different from one another in Experiment 2, t(12) = −4.23, p < .0063). For the 6 additional heights tested in Experiment 2, we see that this finely tuned sensitivity does not extend to discrimination between boundaries that both contain some degree of intermediate vertical structure—for example between heights 6 and 7 (t(12) = .39, p = .71). This further demonstrates that a very slight amount of grounded vertical structure plays a critical role in the representation of boundaries by the PPA, just as a very slight amount of physical curb structure dramatically improves the ability of young children to reorient geometrically (Lee & Spelke, 2008; 2011).
Figure 14.
Beta weights for PPA for each of the 9 conditions of Experiment 2 (significance determined by t-test, p < .0063, two-tailed). Error bars represent one standard error of the mean.
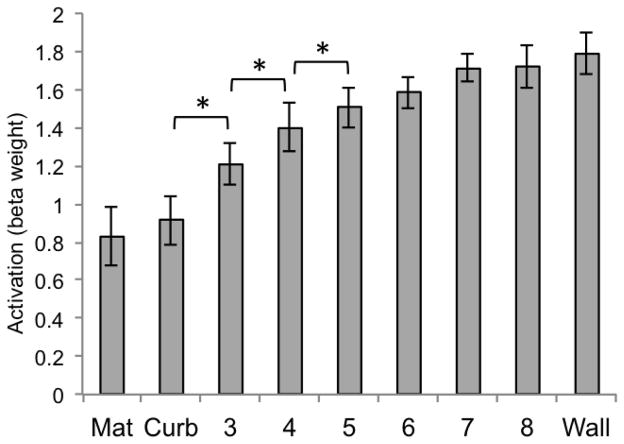
We additionally considered the univariate response of LOC and V1 in Experiment 2. Both revealed patterns that qualitatively differed from the two scene ROIs of PPA and RSC. For LOC (Figure 15), none of the pairwise comparisons were significant (all ps > .05, two-tailed). For V1 (Figure 16), comparisons between the curb and height 3, height 3 and height 4, and height 4 and height 5 were all significantly different from one another (all ps < .0063).
Figure 15.
Beta weights for LOC for each of the 9 conditions of Experiment 2. Error bars represent one standard error of the mean.
Figure 16.
Beta weights for V1 for each of the 9 conditions of Experiment 2 (significance determined by t-test, p < .0063, two-tailed). Error bars represent one standard error of the mean.
DISCUSSION
Vertical boundaries provide a fundamental and immutable contribution to the geometry of a scene. The work presented here is the first to systematically evaluate the way in which two scene-selective areas encode different boundaries that vary in terms of vertical height. We were inspired by a finding in the developmental literature: immature navigators though they may be, 4-year-old children spontaneously encode the geometry of a rectangular array defined by a curb that is only 2 cm in height (Lee & Spelke, 2011). This suggests that vertical structure is a core feature of what qualifies a boundary as such. Our results reveal that this feature is central to the representation of boundaries by the PPA as well; using both univariate and multi-voxel pattern analysis, this area systematically demonstrates sensitivity to minimal changes in 3D vertical structure. A further control manipulation using V1 as a comparison demonstrated that the PPA’s response to the minimal curb condition cannot be fully attributed to low-level visual attributes of the stimuli. This differentiation by the PPA is consistent with its known sensitivity to local scene geometry (Park & Chun, 2009; Epstein 2005; 2008).
RSC demonstrated a different pattern, where the curb and mat conditions were consistently confused. Both these cues offer relatively the same navigational affordance (i.e., they may be easily traversed), while in contrast the wall condition presents a strong impediment to navigation. In Experiment 2, we found that the activity of RSC mirrored the tipping point of a boundary’s functional relevance, as judged by human observers. We propose that RSC’s response to boundaries is driven by functional affordance, which is consistent with RSC’s representation of navigationally relevant information (Marchette et al., 2014; Epstein, 2008; Maguire, 2001).
In this paper we explore the representation of boundaries in brain regions that are known to process visual scene information. Are the same regions implicated in visual boundary representation also involved in real-world navigation? A recent fMRI study using active reorientation in the scanner suggests selective involvement of the PPA in representing vertical aspects of the environment. Sutton et al. (2012) used virtual rooms with different cues to define a rectangular array (complete walls or a shaded rectangle on the floor). The greatest activation of the PPA was found when contrasting activity for the walls compared to the floor. These results are in line with our data, which highlight the role of the PPA in representing the presence of vertical elements in the environment. The current data extend these findings by demonstrating that boundaries are not only useful cues for active reorientation, but also suggests that they are primary elements in visual scene representation.
What constitutes a boundary? Our findings contribute to the existing neural and behavioral literature involving research with human adults, children, and animals. These studies collectively provide a preliminary “checklist” for what features may constitute an effective boundary. First, a boundary introduces an alteration to scene geometry. Children’s acute sensitivity to 3D structure and their inability to reorient by the geometry of a flat mat (Lee & Spelke, 2011) suggests that boundaries must fundamentally contribute to 3D changes in scene geometry if they are to effectively inform the geometric reorientation mechanism. The current study identifies an area in the brain that mirrors this core feature; the PPA shows a disproportionate sensitivity to the presence of slight curb structure within a scene.
Second, a boundary rises from the ground up. For organisms whose navigation is tied to the ground, changes in geometry must also occur from the ground up in order to qualify as boundaries. Children do not reorient geometrically in an array defined by a suspended cord, despite the fact that it blocks their movement beyond the array (Lee & Spelke, 2011). If continuous 3D structure is not connected to the navigable surface, it may not qualify as a boundary. In further support of this, the inversion manipulation of Experiment 1 reveals that the acute sensitivity of the PPA is only observable when vertical boundary structure rises from the ground up.
Lastly, a boundary poses behavioral consequences to navigation. Studies on the firing properties of BVCs provide evidence for the encoding of boundaries that is dependent upon their functional significance. Although these cells were originally discovered to fire in response to the wall boundaries of a rat’s enclosure (Lever et al., 2009), further work on drop boundaries (where rats are placed on an elevated platform) has shown that drops elicit field repetition in BVCs in the same way as upright barriers (Stewart et al., 2013). This indicates that BVCs treat drops similarly to walls. As walls and drop edges have very different sensory properties, the similar coding of these two boundary types highlights a specialized mechanism for environmental boundaries that functionally restrict navigation, irrespective of sensory input (Stewart et al., 2013). In line with this functional representation, the findings of the current study indicate that RSC represents scene boundaries in terms of categorical differences in behavioral consequence (whether they are easy or difficult to cross).
What qualifies as a boundary is likely a combination of all these factors that are represented across the scene network in collective support of a percept that aids navigation. Junctions and curvature contours have also been identified as visual features that play a key role in human scene categorization (Walther & Shen, 2014). Perhaps the most salient contribution of the Curb condition used in the present study is the fact that it creates non-accidental junction properties that are recognized by the PPA. Additional work has shown that the PPA is selectively activated by rectilinear features (Nasr, Echavarria, & Tootell, 214). Future studies are needed to further investigate the way in which the brain extracts geometric cues from a scene image. This work may draw upon additional findings from the behavioral reorientation literature, which highlight distance and directional relationships between extended boundary surfaces as crucial input to the reorientation process by both human children (Lee, Sovrano, & Spelke, 2012) and fish (Lee et al., 2013).
In the current research, we present evidence that what defines a boundary is qualitatively different for two scene regions in the brain. Our findings demonstrate that boundaries are a structural aspect of scenes that are encoded by high-level scene areas to form distinct yet complementary representations. The current work evaluates the visual encoding of boundaries under passive viewing conditions, but other research (Sutton et al., 2012) has begun to explore the neural processing of different boundary cues in virtual reality tasks. Whether active reorientation in a “curb” array will reveal heightened activity of the PPA in the adult brain is left to future research. Focus on RSC’s response to the functional affordance of boundaries in active navigation tasks is also a subject for further studies, as is involvement of the hippocampus, which shows parametric increases in activation with the number of enclosing boundaries in mental scene images (Bird et al., 2010). These future directions will further elucidate the neural representation of boundaries in both visual scene perception and active navigation.
Highlights.
Complementary representations of boundary geometry and function in scene cortices.
The PPA is sensitive to the geometry of a small vertical boundary cue.
This mirrors children’s use of a small boundary in geometric reorientation.
RSC represents the functional affordance of scene boundaries.
Acknowledgments
Funding
This work was supported by an Integrative Graduate Education and Research Traineeship through the National Science Foundation (DGE 0549379, to KF) and a grant from the National Eye Institute (NEI R01EY026042, to SP).
We thank Ru Harn Cheng, Matthew Levine, and Jung Uk Kang for their assistance.
Footnotes
Publisher's Disclaimer: This is a PDF file of an unedited manuscript that has been accepted for publication. As a service to our customers we are providing this early version of the manuscript. The manuscript will undergo copyediting, typesetting, and review of the resulting proof before it is published in its final citable form. Please note that during the production process errors may be discovered which could affect the content, and all legal disclaimers that apply to the journal pertain.
References
- Aguirre GK, D’Esposito M. Topographical disorientation: A synthesis and taxonomy. Brain. 1999;122:1613–1628. doi: 10.1093/brain/122.9.1613. [DOI] [PubMed] [Google Scholar]
- Aguirre GK, Detre JA, Alsop DC, D’Esposito M. The parahippocampus subserves topographical learning in man. Cerebral Cortex. 1996;6:823–829. doi: 10.1093/cercor/6.6.823. [DOI] [PubMed] [Google Scholar]
- Aguirre GK, Zarahn E, D’Esposito M. An area within human ventral cortex sensitive to “building” stimuli: Evidence and implications. Neuron. 1998;21:373–383. doi: 10.1016/s0896-6273(00)80546-2. [DOI] [PubMed] [Google Scholar]
- Arcaro MJ, McMains SA, Singer BD, Kastner S. Retinotopic organization of human ventral visual cortex. Journal of Neuroscience. 2009;29:10638–10652. doi: 10.1523/JNEUROSCI.2807-09.2009. [DOI] [PMC free article] [PubMed] [Google Scholar]
- Barry C, Lever C, Hayman R, Hartley T, Burton S, O’Keefe J, Jeffery K, Burgess N. The boundary vector cell model of place cell firing and spatial memory. Annual Review of Neuroscience. 2006;17:71–97. doi: 10.1515/revneuro.2006.17.1-2.71. [DOI] [PMC free article] [PubMed] [Google Scholar]
- Bird CM, Cappont C, King JA, Doeller CF, Burgess N. Establishing the boundaries: The hippocampal contribution to imagining scenes. Journal of Neuroscience. 2010;30:11688–11695. doi: 10.1523/JNEUROSCI.0723-10.2010. [DOI] [PMC free article] [PubMed] [Google Scholar]
- Doeller CF, Burgess N. Distinct error-correcting and incidental learning of location relative to landmarks and boundaries. Proceedings of the National Academy of Sciences, USA. 2008;105:5909–5914. doi: 10.1073/pnas.0711433105. [DOI] [PMC free article] [PubMed] [Google Scholar]
- Doeller CF, King JA, Burgess N. Parallel striatal and hippocampal systems for landmarks and boundaries in spatial memory. Proceedings of the National Academy of Sciences, USA. 2008;105:5915–5920. doi: 10.1073/pnas.0801489105. [DOI] [PMC free article] [PubMed] [Google Scholar]
- Epstein RA. The cortical basis of visual scene processing. Visual Cognition. 2005;12:954–978. [Google Scholar]
- Epstein RA. Parahippocampal and retrosplenial contributions to human spatial navigation. Trends in Cognitive Science. 2008;12:388–396. doi: 10.1016/j.tics.2008.07.004. [DOI] [PMC free article] [PubMed] [Google Scholar]
- Epstein RA, Graham KS, Downing PE. Viewpoint-specific scene representations in human parahippocampal cortex. Neuron. 2003;37:865–876. doi: 10.1016/s0896-6273(03)00117-x. [DOI] [PubMed] [Google Scholar]
- Epstein RA, Kanwisher N. A cortical representation of the local visual environment. Nature. 1998;392:598–601. doi: 10.1038/33402. [DOI] [PubMed] [Google Scholar]
- Epstein RA, Parker WE, Feiler AM. Where am I now? Distinct roles for parahippocampal and retrosplenial cortices in place recognition. Journal of Neuroscience. 2007;27:6141–6149. doi: 10.1523/JNEUROSCI.0799-07.2007. [DOI] [PMC free article] [PubMed] [Google Scholar]
- Hasson U, Harel M, Levy I, Malach R. Large-scale mirror-symmetry organization of human occipito-temporal object areas. Neuron. 2003;37:1027–1041. doi: 10.1016/s0896-6273(03)00144-2. [DOI] [PubMed] [Google Scholar]
- Haxby JV, Gobbini MI, Furey ML, Ishai A, Schouten JL, Pietrini P. Distributed and overlapping representations of faces and objects in ventral temporal cortex. Science. 2001;293:2425–2430. doi: 10.1126/science.1063736. [DOI] [PubMed] [Google Scholar]
- Kourtzi Z, Kanwisher N. Representation of perceived object shape by the human lateral occipital complex. Science. 2001;293:1506–1509. doi: 10.1126/science.1061133. [DOI] [PubMed] [Google Scholar]
- Kosslyn SM, Pick HL, Fariello GR. Cognitive maps in children and men. Child Development. 1974;45:707–716. [PubMed] [Google Scholar]
- Learmonth AE, Nadel L, Newcombe NS. Children’s use of landmarks: Implications for modularity theory. Psychological Science. 2002;13:337–341. doi: 10.1111/j.0956-7976.2002.00461.x. [DOI] [PubMed] [Google Scholar]
- Learmonth AE, Newcombe NS, Sheridan N, Jones M. Why size counts: Children’s spatial reorientation in large and small enclosures. Developmental Science. 2008;11:414–426. doi: 10.1111/j.1467-7687.2008.00686.x. [DOI] [PubMed] [Google Scholar]
- Lee SA, Spelke ES. Navigation as a source of geometric knowledge: Young children’s use of length, angle, distance, and direction in a reorientation task. Cognition. 2012;1232:144–161. doi: 10.1016/j.cognition.2011.12.015. [DOI] [PMC free article] [PubMed] [Google Scholar]
- Lee SA, Spelke ES. Children’s use of geometry for navigation. Developmental Science. 2008;11:743–749. doi: 10.1111/j.1467-7687.2008.00724.x. [DOI] [PubMed] [Google Scholar]
- Lee SA, Spelke ES. Young children reorient by computing layout geometry, not by matching images of the environment. Psychonomic Bulletin & Review. 2011;18:192–198. doi: 10.3758/s13423-010-0035-z. [DOI] [PMC free article] [PubMed] [Google Scholar]
- Lee SA, Vallortigara G, Flore M, Spelke ES, Sovrano VA. Navigation by environmental geometry: The use of zebrafish as a model. The Journal of Experimental Biology. 2013;216:3693–3699. doi: 10.1242/jeb.088625. [DOI] [PMC free article] [PubMed] [Google Scholar]
- Lever C, Wills T, Cacucci F, Burgess N, O’Keefe J. Long-term plasticity in hippocampal place-cell representation of environmental geometry. Nature. 2002;416:90–94. doi: 10.1038/416090a. [DOI] [PubMed] [Google Scholar]
- Lever C, Burton S, Ali Jeewajee A, O’Keefe J, Burgess N. Boundary vector cells in the subiculum of the hippocampal formation. Journal of Neuroscience. 2009;29:9771–77. doi: 10.1523/JNEUROSCI.1319-09.2009. [DOI] [PMC free article] [PubMed] [Google Scholar]
- Maguire EA. The retrosplenial contribution to human navigation: a review of lesion and neuroimaging findings. Scandanavian Journal of Psychology. 2001:225–238. doi: 10.1111/1467-9450.00233. [DOI] [PubMed] [Google Scholar]
- Marchette SA, Vass LK, Ryan J, Epstein RA. Anchoring the neural compass: Coding of local spatial reference frames in human medial parietal lobe. Nature Neuroscience. 2014;17:1598–1606. doi: 10.1038/nn.3834. [DOI] [PMC free article] [PubMed] [Google Scholar]
- Mou W, Zhou R. Defining a boundary in goal localization: Infinite number of points or extended surfaces. Journal of Experimental Psychology. 2013;39:1115–1127. doi: 10.1037/a0030535. [DOI] [PubMed] [Google Scholar]
- Nakamura K, Kawashima R, Sato N, Nakamura A, Sugiura M, Kato T, Hatano K, Ito K, Fukuda H, Schormann T, Ziles K. Functional delineation of the human occipito-temporal areas related to face and scene processing: A PET study. Brain. 2000;123:1903–1912. doi: 10.1093/brain/123.9.1903. [DOI] [PubMed] [Google Scholar]
- Nasr S, Echavarria CE, Tootell RBH. Thinking outside the box: Rectilinear shapes selectively activate scene-selective cortex. The Journal of Neuroscience. 2014;34(20):6721–6735. doi: 10.1523/JNEUROSCI.4802-13.2014. [DOI] [PMC free article] [PubMed] [Google Scholar]
- Newcombe NS, Liben LS. Barrier effects in the cognitive maps of children and adults. Journal of Experimental Child Psychology. 1982;34:46–58. doi: 10.1016/0022-0965(82)90030-3. [DOI] [PubMed] [Google Scholar]
- Park S, Chun MM. Different roles of the parahippocampal place area (PPA) and retrosplenial cortex (RSC) in panoramic scene perception. NeuroImage. 2009;47:1747–1756. doi: 10.1016/j.neuroimage.2009.04.058. [DOI] [PMC free article] [PubMed] [Google Scholar]
- Park S, Brady TF, Greene MR, Oliva A. Disentangling scene content form spatial boundary: Complementary roles for the parahippocampal place area and lateral occipital complex in representing real-world scenes. Journal of Neuroscience. 2011;31:1333–1340. doi: 10.1523/JNEUROSCI.3885-10.2011. [DOI] [PMC free article] [PubMed] [Google Scholar]
- Park S, Konkle T, Oliva A. Parametric coding of the size and clutter of natural scenes in the human brain. Cerebral Cortex. 2015;25(7):1792–1805. doi: 10.1093/cercor/bht418. [DOI] [PMC free article] [PubMed] [Google Scholar]
- Rajimehr R, Devaney KJ, Bilenko NY, Young JC, Tootel RBH. The “parahippocampal place area” responds preferentially to high spatial frequencies in human monkeys. PLOS Biology. 2011;9:e1000608. doi: 10.1371/journal.pbio.1000608. [DOI] [PMC free article] [PubMed] [Google Scholar]
- Spiridon M, Kanwisher N. How distributed is visual category information in human occipital-temporal cortex? An fMRI study. Neuron. 2002;35:1157–1165. doi: 10.1016/s0896-6273(02)00877-2. [DOI] [PubMed] [Google Scholar]
- Stewart S, Jeewajee A, Wills TJ, Burgess N, Lever C. Boundary coding in the rat subiculum. Philosopical Transactions of the Royal Society of London B: Biological Sciences. 2013;369:1635–1647. doi: 10.1098/rstb.2012.0514. [DOI] [PMC free article] [PubMed] [Google Scholar]
- Sutton JE, Joanisse MF, Newcombe NS. Geometry three ways: An fMRI investigation of geometric processing during reorientation. Journal of Experimental Psychology: Learning, Memory, and Cognition. 2012;38:1530–1541. doi: 10.1037/a0028456. [DOI] [PubMed] [Google Scholar]
- Walther DB, Caddigan E, Fei-Fei L, Beck DM. Natural scene categories revealed in distributed patterns of activity in the human brain. The Journal of Neuroscience. 2009;29(34):10573–10581. doi: 10.1523/JNEUROSCI.0559-09.2009. [DOI] [PMC free article] [PubMed] [Google Scholar]
- Walther DB, Shen D. Nonaccidental properties underlie human categorization of complex natural scenes. Psychological Science. 2014;25(4):851–860. doi: 10.1177/0956797613512662. [DOI] [PMC free article] [PubMed] [Google Scholar]


