

Abstract
Recent advances in genetically encoded fluorescent probes have dramatically increased the toolkit available for imaging the intracellular environment. Perhaps the biggest improvements have been made in sensing specific reactive oxygen species (ROS) and redox changes under physiological conditions. The new generation of probes may be targeted to a wide range of subcellular environments. By targeting such probes to compartments and organelle surfaces they may be exposed to environments, which support local signal transduction and regulation. The close apposition of the endoplasmic reticulum (ER) with mitochondria and other organelles forms such a local environment where Ca2+ dynamics are greatly enhanced compared to the bulk cytosol. We describe here how newly developed genetically encoded redox indicators (GERIs) might be used to monitor ROS and probe their interaction with Ca2+ at both global and local level.
Keywords: redox, H2O2, HyPer, SypHer, Grx1-roGFP2
Graphical abstract
Introduction
Calcium is one of the most versatile and universal cellular second messengers [1]. Across a typical animal cell Ca2+ concentrations range 10,000 fold and its signals last from μs to days, modulating processes as disparate as neurotransmitter release, muscle contraction, oxidative metabolism, organelle distribution, cell division and death. Cells pay a tremendous energetic price to establish and maintain large concentration gradients through a diverse array of ion exchangers and pumps. Conversely, Ca2+ signaling events permit Ca2+ to flow down the energetic gradient through gated channels. The field of Ca2+-signaling has embraced the concept of limited spatial or temporal features, the [Ca2+]c oscillation is a beautiful example of an event with carefully confined temporal characteristics [2, 3]. Similarly, the physical arrangement of Ca2+ channels, impermeable membranes and buffers promote signals confined to μm-scale subcellular regions [4, 5]. Neurons offer extreme examples; localized Ca2+ dynamics restricted to millisecond timescales in terminals isolated at incredible distances from the cell body which allow synaptic transmission independent of other terminals [6]. Such restrictions offer tremendous benefits in terms of efficiency, signal quality and safety, by focusing Ca2+ in time and space. Global, rather than local signals, would force compromise on energetic cost, signal amplitude, speed or the potential for Ca2+ overload.
Below the μm scale, Ca2+ inevitably forms local concentrations in the nm range upon channel opening [7]. This occurs when individual or clusters of Ca2+ channels in the ER/SR or plasma membrane (PM) are gated open, allowing passage to the cytosol of Ca2+ from the ER/SR lumen or extracellular space - the two principal stores. Here, the Ca2+ overwhelms local buffering capacity leading to elevated free Ca2+ forming a gradient from the channel mouth to the bulk cytosol. Such microdomains form and persist in the 10–100s of ms and extend for 10–100s of nm [5, 8]. The distances implied by calculations of Ca2+ diffusion match those observed where the ER forms associations with organelles like the PM (Figure 1. B Pink). Here, cells selectively concentrate Ca2+ sensors (Stim [9]) and channels (Orai [10]) forming a transient physically tethered interface promoting the formation of a microdomain which increases Ca2+ uptake efficiency [11]. Its dynamic construction allows the ER to be moved by motor proteins, remodeled by fusion and divided into functional sub domains [12–14]. Given the dynamism of the mitochondrial network, it is not surprising that the two motile organelles form transient stochastic associations. However, various experiments have demonstrated that the ER and mitochondria form a robust structure physically stabilized by protein tethers [15–17]. At these locations, elevated microdomains of Ca2+ were proposed [18] as a solution to the high-threshold of mitochondrial Ca2+ uptake now known to be mediated by specific proteins of the mitochondrial Ca2+ uniporter [19, 20]. Successful attempts to measure the Ca2+ nanodomain at the ER-mitochondrial interface [21, 22] demonstrated that local Ca2+ is enhanced ≥10 fold compared to the bulk cytosol. Evidence from many fields supports the hypothesis that all second messengers may form micro/nanodomains including cAMP and NOX-induced H2O2 [23, 24].
Figure 1.
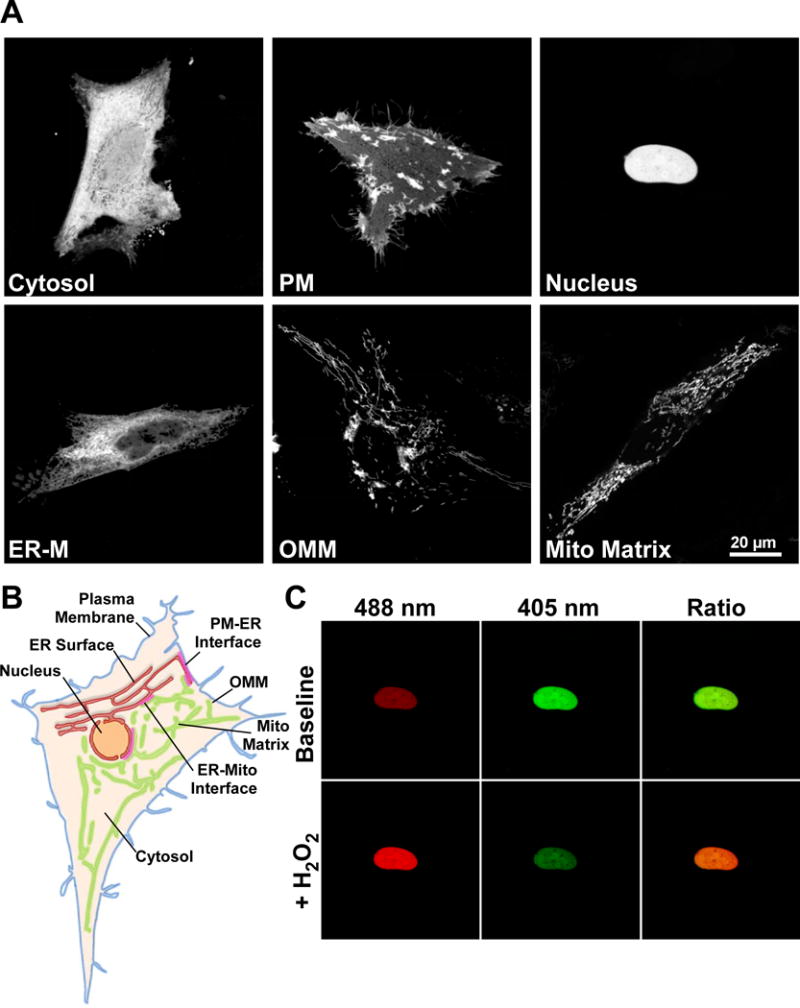
The genetically encoded redox indicator HyPer is a functional H2O2 sensor when targeted to diverse subcellular environments. (A) Confocal images of HeLa cells transfected with HyPer targeted to the cytosol, cytosolic surface of the plasma membrane (PM), nucleus, cytosolic surface of the endoplasmic reticulum membrane (ER-M), cytosolic surface of the outer mitochondrial membrane (OMM) and mitochondrial matrix. Images are the sum of 488 & 405 nm excitation with a 1 pixel median filter step. (B) Scheme depicting some subcellular organelles viable for probe targeting, Plasma membrane (blue), ER membrane (red), Nucleus (orange), outer mitochondrial membrane (OMM, green), mitochondrial matrix (light green) and cytosol (tan). Close appositions of the ER with the plasma membrane (PM-ER interface), mitochondria (ER-mito interface) are highlighted (red). (C) HeLa cell expressing HyPer targeted to the nucleus. Fluorescence intensity images of 488 nm excitation (red) and 405 nm excitation (green) before and after addition of H2O2 (100 μM). Overlaid images (right) show increase in 488 nm fluorescence (red) and decrease in 405 nm fluorescence (green) following H2O2 addition.
Reactive oxygen species (ROS) modify the spatial and temporal profile of both global and local Ca2+ signals by functional modification of Ca2+ handling proteins [25–28]. By direct and indirect tuning, ROS may modulate protein activity at a local level, giving rise to spatially confined heterogeneity in Ca2+ pumping, flow and exchange. This interaction is facilitated by concentration of ROS production and degradation at the organelles primarily involved in Ca2+ handling. For example, the close apposition of the ER to potent ROS sources like mitochondria, suggest exciting new ways in which second messengers may interact locally at organellar interfaces. In order to determine the mechanisms and significance of the interplay between Ca2+ and ROS, it is important to establish specific and sensitive means to track and perturb ROS in live cells down to level of subcellular organelles. We here summarize recent developments in technology that allow monitoring of ROS in spatially and temporally resolved manner and even simultaneously with monitoring of [Ca2+].
1. Measurement of ROS
Fluorescence Measurements – Fluorophores
Both small-molecule dyes and fluorescent proteins allow real-time imaging of diverse species within individual cells. Small molecule probes are often easier to introduce to a cell but may not be targeted to tissue or cell type, and are subject to saturation, leak, extrusion or compartmentalization when used beyond short time periods, and as such may not be used to track lengthy physiological processes such as development or wound healing. Furthermore, evidence has accumulated on the lack of specificity of several small molecule probes and on a range of artifacts. Presently, we seek to highlight the possibilities afforded by the range of genetically encoded redox indicators (GERIs) currently available. Early experiences demonstrated the sensitivity of fluorescent proteins (FPs) to changes in the chemical environment, such as pH or Cl− [29]. Efforts were made to create chemically stable variants [30] while others exploited the sensitivity to measure the intracellular environment. The development of circular permuted FPs [31] allowed insertion of an adapter protein that linked conformational change to optical information. Almost immediately, Ca2+-sensitive motifs were used to create a new generation of genetically encoded Ca2+ indicators (GECIs) [32–34]. By adding peptide motifs from selected endogenous proteins, fluorophores could be targeted to cellular compartments and membranes, permitting measurements using non-invasive imaging equipment [35].
Tools for sensing ROS and Redox
Since evidence gathers that ROS and redox regulation engage all modes of physiological and pathological signaling, interest in their measurement has grown. Conversely, intracellular measurements using small molecule dyes still rely upon a cabal of sensors based upon reduced ethidium, fluorescein or rhodamine. Use of these indicators is fraught with difficulty even in experienced hands. They offer few targeting options, little ROS selectivity or specificity and myriad mechanisms for producing anomalous data [36, 37]. Currently, no small molecule indicator is ratiometric, reversible or capable of sensing redox metabolites such as NAD(P)H or GSH in live cells. For these reasons, measurements made with small molecules must feature extensive controls and the results interpreted within the context of their limitations. However, where conditions are tightly controlled, such as permeabilized cell systems or isolated organelles, their convenience offers more promise. In contrast to small molecule indicators, GERIs have developed rapidly. Living organisms harbor proteins evolved to sense ROS and redox changes in order to adapt to their environment. This has produced two categories of indicators: those that equilibrate with the redox potential, and those that specifically sense a redox active molecule.
Redox environment probes
rxYFP
The first redox sensor, rxYFP, (Table 1) was produced by substituting two residues close to the YFP chromophore for a cysteine pair capable of forming a disulfide bond [38]. Upon oxidation, the disulfide bridge induces a conformation change in the adjacent chromophore, enhancing absorption/fluorescence at 512 nm while proportionally decreasing (absorption only) at 404 nm. When expressed in the cytosol, rxYFP equilibrates with the redox environment within individual living cells. rxYFP is fully oxidized or reduced by cell-permeable thiol reagents 2,2′-dipyridyl disulphide (DPS) and dithiothreitol (DTT), but when purified, in vitro rxYFP responds slowly to GSH:GSSH ratios. This strongly implicates proteins with glutaredoxin (Grx) activity as necessary cofactors in sensing GSH:GSSG [39]. The pH sensitivity of rxYFP was noted in the characterization, probe fluorescence increases with pH in the physiological range however, reduced and oxidized forms show divergent responses, with the reduced form 50% brighter at pH 7.4. Consequently, rxYFP requires consideration of changes in pH, halides or nitrate [40].
Table 1.
Genetically-encoded redox and ROS sensors
| Name | Targeted Species | Excitation | Emission | Dynamic Range | Fluorophore Base | Comments |
|---|---|---|---|---|---|---|
| rxYFP | Redox potential | 512 nm | 523 nm | 2.2 | rxYFP | Dependent upon endogenous cofactors, pH −240 mV [38] |
| roGFP1 | Redox potential | 395/475 nm | 508 nm | 2.5 | roGFP2 | Dependent upon endogenous cofactors [41] |
| roGFP2 | Redox potential | 395/490 nm | 508 nm | 8.8 | roGFP2 | Dependent upon endogenous cofactors [41] |
| HyPer | H2O2 | 420/500 nm | 516 nm | 2–4 (8) | cpYFP | pH Sensitivity[50] |
| HyPer 2 | H2O2 | 420/500 nm | 516 nm | 2–8 | cpYFP | pH Sensitivity, slow [52] |
| HyPer 3 | H2O2 | 420/500 nm | 516 nm | 2–8 | cpYFP | pH Sensitivity [52] |
| HyPer Red | H2O2 | 560 nm | 605 nm | 2.0 | mApple | pH sensitivity [57] Not ratiometric |
| Orp1roGFP2 | H2O2 | 395/488 nm | 508 nm | roGFP | Cofactor dependent reduction [62] | |
| Per/Oxy FRET | H2O2 | 435/514 nm | 470/527 nm | 2/1.5 | CFP/YFP | Cofactor dependent reduction [60] |
| Grx1roGFP2 | GSH:GSSG | 395/488 nm | 508 nm | 8.8 | roGFP2 | Depletion of absolute amounts of GSH are undetected. [44] |
| Grx1-roGFP2-iL/iX/ie | GSH:GSSG | 395/488 nm | 508 nm | 8.8 | roGFP1 | changed mV for oxidizing compartments, dim [81, 82] |
| Peredox | NAD+/NADH | 400/587 nm | 510/610 nm | 2.5 | cpGFP/mChe rry reference | [72] |
| Frex | NAD+/NADH | 514 nm | 527 nm | 2–5 | cpYFP | pH sensitive [71] |
| cpYFP | Superoxide? pH | 514 nm | 527 nm | pH 20 | cpYFP | pH sensitive [83] |
roGFP
Following rxYFP, the disulfide bond strategy was applied to modulate the chromophore of wild type avGFP, retaining two excitation peaks at 395/475 nm (Table 1) yielding redox-sensitive roGFP1 [41]. A further mutation, S65T yielded the brighter, spectrally shifted and higher dynamic range roGFP2. The advantages of roGFP probes over rxYFP are numerous, essentially rendering rxYFP conceptually important but functionally obsolete. Both roGFP variants are true ratiometric fluorophores which display greater redox sensitivity (1: −291mV, 2: −280mV vs. rxYFP: −261mV) in the physiological range (cytosol: −260 to −200mV [42] the more reducing mitochondrial matrix: −330 to −300mV [43]), while eliminating most potential artifacts. H+, Halide and other small anions do not affect GFP at physiologically relevant concentrations. While roGFP2 fluorescence decreases upon acidification, both excitation wavelengths respond equally [44]. It should be noted that uniform changes in both wavelengths of a ratiometric indicator may still be subject to artifacts created by endogenous autofluorescence prevalent in primary cells and often subject to independent redox modulation [45]. In relatively few steps, GERIs have developed as methods to assess the intracellular redox environment; they offer real-time measurements of individual cells without the artifacts created by biochemical sample preparation. That roGFP may be targeted to any compartment of the cell is of great utility, but caveats remain. In vitro reactions with common oxidants, such as H2O2, show poor sensitivity compared with the same probe expressed in HeLa cells [41]. The oxidation/reduction of roGFP and rxYFP by equilibration with GSH:GSSG in vitro is extremely slow compared to the rate inside living cells. While the intracellular mechanism is not fully understood, addition of glutaredoxin (Grx) to in vitro assays dramatically enhances the relationship between GSH:GSSG ratio and the redox state of the probes, implying that cellular redox status is communicated to the probe via endogenous enzymes [39]. Subsequent fusion of Grx1 with roGFP2 increased probe sensitivity to common oxidants [44], demonstrating that roGFP is not a ROS probe, rather, it integrates into the cellular thiol network with uncertain efficiency. Therefore, dynamic measurements rely upon endogenous redox proteins which vary between cell type and compartment.
Specific ROS probes: H2O2 HyPer
It is accepted that ROS generated by metabolism and ROS generating enzymes, occur in the form of superoxide however, its half-life in most cellular environments forces the equilibrium in favor of dismutation to H2O2 [46]. Measurement of H2O2 has traditionally relied upon unspecific small molecule dyes or extracellular detection with HRP-Amplex red [47]. The discovery of specific microbial H2O2 sensors OxyR, in E.coli, and the Orp1-Yap1 H2O2 relay system in S.cerevisiae [48, 49] was critical to the design of GERIs with real ROS specificity. The regulatory domain of OxyR (amino acids 80–310) contains two key cysteine residues (Cys 199 & 208). Cys 199 resides in a hydrophobic pocket that is freely accessible to H2O2 but not superoxide. Upon oxidation Cys 199 forms a sulfenic acid, which leaves the hydrophobic region to form a disulfide bridge with C208. Critically, the reaction is between OxyR and H2O2 directly, with no cofactors, causing a marked conformational change in the flexible 205–222 region [49]. Belousov and colleagues used this conformational change to modulate the fluorescence of cpYFP using a similar strategy to the construction of the Ca2+-sensitive pericam [32, 50]. The result “HyPer” was the first GERI to measure ROS directly and perhaps the first probe of any kind to measure intracellular H2O2 specifically. The specificity of the OxyR domain has been robustly demonstrated by multiple groups in vitro, and in diverse cell models. Its microbial origin implies no endogenous binding partners and resultant perturbations [51]. HyPer appears to function as a monomer [52] allowing activity to be maintained when attached via the N or C terminal, or placed into the middle of a complex polypeptide chain. Further to previous attempts to target HyPer [53, 54], we illustrate in Figure 1 a range of subcellular locations to which the probe may be directed. Pre-validated sequences to target HyPer to the bulk cytosol, the intracellular surface of the plasma membrane, the nuclear lumen, the cytosolic surface of the endoplasmic reticulum (ER-M), the outer mitochondrial membrane (OMM) and the mitochondrial matrix were used (Figure 1, AB). We found that in all locations HyPer functions as a ratiometric H2O2 probe with a lower limit of sensitivity around 2–5 μM and contrary to previous reports, a dynamic range ≥ 5 [52]. Addition of H2O2 to nuclear-targeted HyPer yields a dramatic and opposing change in fluorescence intensities with 488 and 405 nm laser lines (Figure 1, C) Furthermore, in the mitochondrial matrix we see elevated initial ratios and enhanced dynamic range (≥ 8) which we attribute to the alkaline pH of the compartment. Belousov and others have commented upon the pH stability of HyPer as a function of the cpYFP fluorophore [52, 55]. Combined with earlier observations of rxYFP, it is tempting to speculate that H2O2 sensing may superimpose upon pH changes [38]. For this reason, the development of “SypHer” was opportune, the probe is essentially a redox desensitized derivative of HyPer with Cys 199 mutated to serine which essentially operates as fully reduced HyPer [54, 56]. The study highlighted Ca2+-induced pH changes which are mirrored by HyPer in the absence of H2O2. While small molecule pH-sensing dyes, such as carboxy SNARF-1, may be imaged simultaneously with HyPer, they are difficult to target and do not share pKa values. A more straightforward situation is to assess H2O2 using HyPer and SypHer constructs targeted to the same location. Following comparison between HyPer and SypHer, suspected H2O2 elevations should be confirmed with thiol reducing agents, such as DTT, which should reduce the probe, fully matching the fluorescence ratio to that of SypHer. Similarly, inducing the maximal HyPer ratio under experimental conditions (≥100 μM H2O2) will provide valuable reference range for any H2O2 detected. All drugs should be tested at working concentrations to ensure matched pH, as differences can equilibrate across the plasma membrane with considerable delay.
Following HyPer, three additional variants HyPer 2, 3 and HyPerRed have been developed [52, 57]. HyPer 2&3 derive from HyPer with mutations to the OxyR domain. These mutations increase the apparent dynamic range from ~3 to ~8, and in the case of HyPer 2 slow the response. It is interesting that the increase in dynamic range comes without changing the cpYFP fluorophore. Indeed, we speculate that the dynamic range of HyPer3 mimics that of HyPer in an alkaline environment. Perhaps the H34Y mutation of HyPer3 removes the proton donor histidine, favoring a deprotonated chromophore core. If true, then HyPer2 and 3 would represent improvements by being resistant to small alkalization events. HyPerRed was produced by fusing the original OxyR domain to the circularly permuted fluorophore from the calcium sensor R-GECO1[58] and represents a spectrally shifted, non-ratiometric H2O2 sensor with similar sensitivities to both H2O2 and pH but a somewhat truncated dynamic range (1.5–2.0).
Alternative strategies to sensing H2O2 were derived from the yeast Orp1-Yap1 redox relay system. In this pathway, the Orp1 is oxidized by H2O2, forming a disulfide bridge with the cysteine rich domain of Yap1 [59]. This phenomenon was exploited by Enyedi and colleagues to produce two sensors, OxyFret and PerFRET which use conformational changes to increase and decrease Forster Resonance Electron Transfer (FRET) respectively. Both probes demonstrate reversibility upon wash out of H2O2. Although OxyFRET has two Yap1-derrived cysteine rich regions in place of Orp1-Yap1, it is easily oxidized, implying that endogenous enzymes are interacting with the cysteine rich domains in manner as yet uncharacterized [60]. The probes, particularly PerFRET has the advantage over rxYFP and HyPer in that it is FRET based, using Cerulean and Venus is an upgrade over legacy FRET redox probes [61] in that the chosen FRET pair is largely unaffected by pH changes although such FRET pairs typically occupy a large part of the available optical spectrum. A simpler strategy employed by Dick and colleagues, used Orp1 to peroxidate roGFP2 [62]. The result is a probe which has H2O2 specificity conveyed upon it by fusion to Orp1. However, in the absence of adapter proteins, roGFP2 responds to H2O2 and other oxidants via endogenous redox proteins. So far it has not been demonstrated whether roGFP-Orp1 may be oxidized independently of H2O2 via such mechanisms.
Grx1-roGFP2
The GERI Grx1-roGFP2 sits between probes which monitor the redox environment, and those which measure a specific moiety. The probe was created by fusing roGFP2 with human Grx1 resulting in direct, reversible communication of the GSH:GSSG state to the thiol pair in roGFP2 [44]. The improvement in performance is remarkable, Grx1-roGFP2 reduction with GSH and oxidation by GSSG happens in seconds when measured in vitro, in contrast to roGFP2 which senses GSH:GSSG with poor efficiency. The probe does not directly sense ROS such as H2O2, but can sense this via the GSH:GSSG ratio in a manner dramatically enhanced by the presence of glutathione peroxidase (GPx). In live cells the probe responds rapidly, although with a slower kinetic than HyPer, to low (12.5 μM) concentrations of H2O2 which may be completely reversed by DTT. Furthermore, redox shifts in response to TRAIL-induced apoptosis, Ca2+-store depletion, serum starvation and activation of NADPH oxidase have been documented with Grx-roGFP derivatives [63], contrasting the limitations of plain roGFP in responding to physiologically relevant stimuli [64].
NADH
The nicotinamide adenine dinucleotide (NAD+/NADH) and nicotinamide adenine dinucleotide phosphate (NADP+/NADPH) redox couples are major determinants of redox state in the cell upstream of the GSH:GSSG relay. Half a century ago, fluorescence from living tissues was attributed to the autofluorescence of NAD(P)H [65]. Subsequently this endogenous redox indicator was used to demonstrate the coupling between Ca2+ signaling, mitochondrial metabolism and the redox balance in response to physiological [51, 66–68] and pathological stimuli [69]. While imaging NADH and NADPH individually is possible with fluorescent lifetime imaging (FLIM), it requires specialist equipment and artificially elevated NADPH levels [70]. Fortunately, fluorescent probes for NADH have been developed. Both are based upon microbial Rex/T-Rex NADH sensing domains and use the NADH-induced conformational change to modulate the fluorescence of circularly permuted fluorophores. Frex (fluorescent Rex) (Table 1) is based upon cpYFP [71] whereas Peredox (Table 1) uses UV excitable GFP derivative termed T-Sapphire fused to mCherry as a stable reference [72]. Both probes demonstrate acute changes in NADH:NAD+ ratios in response to manipulation of mitochondrial metabolism and substrates. Since many metabolic manipulations modulate pH, constructing Peredox with a pH insensitive GFP paired with a stable reference fluorophore, represents a coherent strategy [73].
Choosing a GERI
Within this special issue, we have tried to draw the attention of Ca2+ researchers to the tools available to visualize ROS and redox dynamics. GERIs emerge as having significant advantages over small molecule probes, GERIs may be expressed in living cells, tissues or whole organisms to reversibly study specific species over extended periods of time. Such features may be used to design experiments with maximum physiological relevance. Which GERI is selected should be informed by the experiment, specifically the environment to which the probe will be exposed and the information desired. Currently, Grx1-roGFP2 stands as the most “fool proof” option, a significant change to the redox environment will be revealed since the GSH:GSSG ratio serves to integrate and channel redox information to one species. This occurs because of direct or protein-catalyzed reduction by GSH of ROS/reactive nitrogen species (RNS), including superoxide, H2O2 and peroxynitrite [74–76]. Grx1 ensures that the probe senses GSH:GSSG independently, unlike rxYFP/roGFP. As such, experiments may be planned where members of the Gpx/Grx/Trx family are ablated or inhibited without compromising the sensing. The roGFP2 fluorophore is well-characterized, free of major pH artifacts, easily targeted, and the excitation/emission spectra are amenable to common filters or laser lines (405/488 nm). However, protocols that deplete the total glutathione pool, such as buthionine sulphoxamine (BSO) treatment, or permeabilization, are likely to substrate-limit the probe, potentially compromising the data.
Following detection of redox shifts, the investigator may wish to assess ROS directly; Orp1-roGFP2 shares the same fluorophore, and is therefore equally stable and directly comparable with Grx1-roGFP2. Using such information, it may be determined whether free H2O2 precedes or trails GSH oxidation. Should fast kinetics and sensitivity be required, HyPer remains state of the art. Oxidation of OxyR by H2O2 changes the fluorescence of HyPer extremely quickly, without need for cofactors. This may be critical when the environment to which the probe is targeted is physically confined, containing finite glutathione pools and limited populations of catalytic enzymes. HyPer must be assessed in paired experiments with the redox desensitized derivative SypHer, to control for pH dynamics [56]. While HyPer2 and HyPer3 have been advertised as having enhanced dynamic range, HyPer2 possesses a slow kinetic and therefore offers no advantage over Orp1-roGFP2. HyPer3 is described as having equal pH sensitivity to legacy SypHer, but the mechanism of the enhanced dynamic range is unexplored [52]. Production of a C199S mutant “SypHer3”, followed by characterization of the probes’ responses to a full range of H2O2 and pH is advised to determine whether the dynamic range has increased, or the protonation state of the chromophore is shifted.
While targeting motifs exist for almost every neighborhood within a cell, some regions are problematic for the described GERIs. The lumen of the endoplasmic reticulum hosts tremendous Ca2+ and redox dynamics, but probes based upon thiol pairs such as HyPer cannot be trusted to directly sense H2O2 in a compartment populated with “professional” thiol modifying machinery [77].
Experiments with ratiometric probes should be planned as to assess the cellular environment in the context of the fully reduced and oxidized range of all probes. DTT and H2O2 are ideal to obtain minimum and maximum ratios (Figure 1, C, 2, A). Furthermore, data should be carefully analyzed at both excitation wavelengths separately to ensure that ratio changes attributable to redox derive from opposing changes in fluorescence, rather than large shifts in overall signal.
Figure 2.
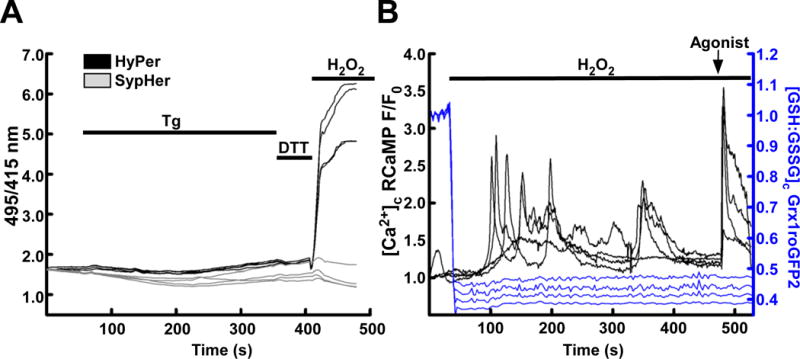
Calcium and redox status may be imaged simultaneously. (A) HEK293 cells transiently transfected with HyPer (black) or the redox-desensitized derivative SypHer (grey) treated with the sarcoendoplasmic reticulum Ca2+ ATPase inhibitor thapsigargin (Tg, 2μM) to induce cytosolic and mitochondrial Ca2+ elevations. Small shifts in HyPer and SypHer occur in response to Tg, but a lack of response to DTT suggests that any changes are pH derived. H2O2 (200 μM) is added at the end of the experiment to demonstrate maximal response. (B) HEK293 cells transiently transfected with Grx1roGFP2 (blue) and RCaMP (black) targeted to the cytosol. Addition of H2O2 (200 μM) oxidizes the GSH:GSSG ratio, subsequently, dysregulated H2O2-induced cytosolic Ca2+ elevations occur. An IP3-linked agonist, carbachol (CCh, 100 μM) is added at the end of the experiment to demonstrate the effect of maximal IP3 receptor-mediated Ca2+ release.
Correlated Imaging
Since ROS/Redox and Ca2+ display mutual regulation, investigators may wish to probe the dynamics of both systems simultaneously. The recent expansion of GECIs means that there are now many probes which may be used with GERIs, with the advantage that either probe may be targeted independently [78, 79]. As an example, we co-transfected HEK293 cells with Grx1-roGFP2 and RCaMP, each targeted to the cytosol. Upon application of H2O2 (200μM) the GSH:GSSG ratio became rapidly and fully oxidized (Figure 2, B. Blue). Within 100 s, H2O2-induced [Ca2+]c elevations were detected by RCaMP (Figure 1, B Black) indicating the sensitivity of Ca2+ release to H2O2 and GSH:GSSG shifts. In addition to the GECIs, small molecule Ca2+ sensitive fluorescent indicators can also be simultaneously used with GERIs. For example, HyPer or Grx1-roGFP2 can be combined with rhod-2 or X-rhod-1 (fluorescence excitation and emission maxima at about 550nm and 580nm for rhod-2 and 580nm and 600nm for X-rhod-1, respectively). HyPerRed fluorescence can be monitored simultaneously with the ratiometric dye fura-2 (excitation at 340nm and 380nm and emission at 500nm). These Ca2+ sensitive fluorescent indicators can be loaded to the cytoplasm using their acetoxymethyl ester derivative or using microinjection of their free acid form. Although the small molecule indicators cannot be specifically targeted to any organelles of interest, in particular cell types, using particular dye loading protocols preferential compartmentalization of certain dyes in certain locations like mitochondrial matrix or ER lumen is feasible (eg in hepatocytes [51, 80]).
2. Tools for local measurements
Membrane Anchored Probes
Measurement of local dynamics may be measured without special techniques in situations where the local dynamics are extreme, such as the local Ca2+ sparks elicited by clusters of ryanodine receptors [84]. In cells with less physical confinement and more modest Ca2+ release, soluble probes may bind calcium and diffuse freely, destroying the spatial information. By confining a Ca2+-sensor to the OMM, Giacomello and colleagues identified “hot spots” on the mitochondrial surface that were exposed to high-Ca2+ microdomains [21]. An approach to target the Ca2+ sensor to organellar interfaces fuses a GECI into a membrane-targeted protein containing a rapamycin-binding domain. By targeting a different color fluorescent protein to the opposing organelle and equipping it with a protein that binds a different portion of rapamycin, the linker halves represent a drug-inducible heterodimer. By tuning the length of the respective linker halves, fluorescent probes may be concentrated specifically to organellar interfaces, such as the ER-mitochondrial or PM-mitochondrial contact sites (Figure 1, B. Pink) [22]. Targeting probes to the interface allows dramatic enrichment of information from interface regions that are below the spatial resolution of conventional fluorescence microscopy. Such techniques might have the ability to sense the nanometer-scale regions where ROS and redox are locally elevated, whereas the volume and antioxidant machinery present in the cytosol precludes the detection of changes in non-pathological conditions. To measure changes in the vicinity of a target protein, the protein can be tagged with a reporter protein directly. Pal and colleagues, chose to directly monitor the activity of NADPH oxidase by creating a fusion protein from roGFP2 and the p47Phox subunit [85]. The skeletal muscle and macrophage systems showed specific oxidation of roGFP2 upon assembly/activation of NOX2, over the course of minutes. The fusion protein approach is demonstrably viable, for any protein amenable to tagging, although retaining a Grx1 or Orp1 as a conjugated catalyst would retain greater sensitivity.
3. The ER-mitochondrial interface: a potential stage for local redox-Ca2+ interactions
Using genetically encoded luminescent Ca2+ sensors, Rizzuto, Pozzan et al. demonstrated effective delivery of Ca2+ released through IP3 receptors (IP3R) to the mitochondria. To explain the disparity between the maximum [Ca2+]c and the minimum [Ca2+] necessary for mitochondrial Ca2+ uptake, they reasoned that the ER and mitochondria must be functionally linked and proposed a locally elevated [Ca2+]c microdomain mediating the Ca2+ transfer to the mitochondria [18]. As described under section 2, this idea has been validated by direct measurement of [Ca2+] at the ER-mitochondrial interface [21, 22]. Furthermore, close association of ER and mitochondria was demonstrated by electron microscopy studies long ago, more recently, ER-mitochondrial tethering species were revealed that show diversity in shape and length spanning 10–60nm interorganellar gaps [15]. The presence of ER-mitochondrial tethers explains why a fraction of the ER, referred as mitochondria associated membranes or MAM, co-purifies with mitochondria upon cell or tissue fractionation [86]. The MAM is enriched with numerous proteins which coordinate ER Ca2+ release and sensing by adjacent mitochondria [18]. The protein tethers are required for efficient Ca2+ transfer [15], as explored using artificial variable-length drug-inducible linkers [22]. By extending the contact area, Ca2+ transfer enhanced, conversely, reducing the distance to below the protrusion of the IP3R inhibited transfer, demonstrating that the ER-mitochondrial interface tunes cellular energetics via mitochondria. The extent of the ER-mitochondrial interaction is a regulated event, induction of ER stress enhances the association [15, 87] but the functional relevance of the rearrangement remains elusive.
The ER is the primary source of interface Ca2+ but mitochondrial respiration and ROS production must impact the restricted environment [88]. Sources of redox perturbation lie on both sides of the interface: the ER lumen is an oxidizing compartment with H2O2-producing enzymes enriched at the MAM [89] and behind the OMM, the intermembrane (IMS) space that may be highly oxidized [90]. Further studies show that the IMS becomes oxidized when access to the cytosol is blocked, implying the exchange of oxidized products from the IMS to the mitochondrial surface [91]. VDAC proteins are present at the ER-mitochondrial interface and provide access to the IMS for small molecules including Ca2+ [92, 93]. That VDAC forms a tether complex with grp75 and IP3R, which all co-purify in a biochemical MAM fraction, provides evidence that a portion of VDAC allows exchange between the IMS and the interface volume. It is tempting to speculate that VDAC provides privileged communication between the IMS and interface involving Ca2+, ATP and redox intermediates.
A central molecular component of the interplay between redox changes and Ca2+ signaling is the IP3R. Although there are species differences, each of the three IP3R isoforms show sensitization of channel activation in response to oxidants [94]. Increased generation of ROS at ER-mitochondrial interfaces would sensitize IP3R channels localized to the interface and drive additional ROS production as a consequence of enhanced mitochondrial Ca2+ uptake. This could be part of a regulatory positive feed-back loop contributing to several modes of cell death. The mechanism of redox sensitization of IP3Rs is poorly understood but may involve oxidation of critical thiols and/or altered association with regulatory proteins. Changes in the binding of the ER luminal oxido-reductase ERp44 to the type 1 IP3R has been proposed to confer redox sensitivity to the channel [94]. The balance of oxidized and reduced IP3Rs has also been found to be affected by another ER luminal oxido-reductase ERO-1alpha, acting indirectly by binding to ERp44 [95]. Interestingly, there is evidence that ERp44 and ERO-1alpha are enriched at the MAM interface [95, 96]. Although intraluminal regulation may contribute to redox regulation of the type 1 IP3R, it is more likely that modification of critical cytosol-exposed thiols represent a general mechanism for modulation of all IP3R isoforms. Identifying these thiols, and understanding their role in modifying the channel gating mechanisms revealed by recent high-resolution structures of the IP3R [97], remains a major challenge.
Local generation of ROS and redox shifts within the interface could form an elevated nanodomain by shielding oxidants from rapid reduction in the cytosol. As such, OMM or ER-M bound ROS generators would exert an amplified effect upon ROS targets in their vicinity. Such systems exist, for example, OMM localized monoamine oxidase enzymes, which in the presence of appropriate neurotransmitter substrates generate H2O2 in a Ca2+ stimulated manner are overactive in the astrocytes of Parkinson’s disease patients [98] the disease also displays many features of mitochondrial dysfunction and Ca2+ dysregulation [99, 100]. A logical place for such pathology to begin, and for investigators to look, would be at organellar interfaces, where mitochondria and Ca2+ handling machinery gather.
While this review has focused upon the ER-mitochondrial interface as an exciting example of local interactions between Ca2+ and redox, this is a single example. Wherever gradients of Ca2+ and redox exist local elevations and signaling should also. The plasma membrane divides a high Ca2+ and oxidized cell exterior from the low Ca2+ and reducing cytosol, as such Ca2+ entry drives local elevations in neuronal models [101] which may be detected with probes anchored to the membrane but not the diffuse cytosol [102]. Local elevations of Ca2+ restricted to the nm range below the plasma membrane have been shown to modulate neighboring plasma membrane Ca2+ pumps [103] which are further regulated by local mitochondria [104]. That the ER/SR mitochondria and plasma membrane gather so closely and utilize local Ca2+ signals invites detailed investigation of the respective interfaces with respect to Ca2+ and redox, we have demonstrated that probes targeted to the OMM and PM may be used to investigate the interface between the parent organelles [22] however, given the proximity of mitochondria and plasma membrane sources of ROS such as NADPH oxidase, significant opportunities exist to probe ER-PM and OMM-PM interfaces with targeted GERIs.
Conclusions future directions
It is increasingly apparent that signaling events begin locally and that they engage in cross talk and mutual interregulation. Ca2+ and ROS/redox are examples of such signaling pathways. Micro and nanodomain transients of Ca2+ have been observed across many models for some time, owing largely to the quality of tools available for Ca2+ measurement. Small molecule redox indicators have never approached the performance of their Ca2+ counterparts, but the harnessing of microbial H2O2 sensors and glutathione sensitive proteins, means that GERIs can compete on a level playing field. While Ca2+ persists as a single entity, redox biology exists as a diverse group of related species and metabolites, as such; opportunities exist to develop probes for these processes. The sensing of superoxide is an obvious candidate, and for a period was thought possible using the SoxRS system, however, evidence emerges that this is indirect [105]. Controversy surrounds the use of cpYFP in this regard, and as such the discovery of a superoxide sensitive domain with true specificity would be invaluable to understand the proximal generation of ROS and the route taken to its terminal reduction [83, 106]. Certain metabolites with key roles in the antioxidant cascade are also excellent candidates, GSH:GSSG is now easily monitored, but the upstream reductant NADPH is difficult to assay. There are many proteins which interact with NADPH specifically and as such a sensing domain with affinity in the physiological range is likely to exist. Further upstream, glucose-6-phosphate stands as the only way to generate NADPH in many cell types. Sensing the flow of metabolic reducing equivalents may reveal that there is more to oxidative stress than simply changes in ROS generation. Further developments of fluorophores are also eagerly anticipated. Current ratiometric fluorophores require illumination with near-UV light, which is unfavorable for experiments where photooxidation is a potential problem. An improvement would be a red shifted ratiometric probe that would limit photodamage, and potential autofluorescence artifacts. Elimination of pH sensitivity is another goal. While it has been suggested that pH sensitivity is inherent in cpYFP, there is evidence from variants of the protein that the pKa can be shifted. Were it shifted out of the physiological range, a sensor using it would be free of pH artifacts in practice.
Highlights.
Recent advances have led to a new generation of ROS and redox indicators
Genetically Encoded Redox Indicators (GERIs) may be specifically targeted
Real-time specific measurements can be made in local cell environments
Correlated redox and calcium imaging is now reliable and convenient
Acknowledgments
The authors thank Drs. Peter Varnai, Balazs Enyedi and Miklos Geiszt (Semmelweis Medical University, Budapest, Hungary) for providing HyPer and SypHer constructs with various targeting sequences. This work was supported by NIH grants GM59419, DK103558 and ES025672.
Footnotes
Publisher's Disclaimer: This is a PDF file of an unedited manuscript that has been accepted for publication. As a service to our customers we are providing this early version of the manuscript. The manuscript will undergo copyediting, typesetting, and review of the resulting proof before it is published in its final citable form. Please note that during the production process errors may be discovered which could affect the content, and all legal disclaimers that apply to the journal pertain.
References
- 1.Berridge MJ, Lipp P, Bootman MD. The versatility and universality of calcium signalling. Nat Rev Mol Cell Biol. 2000;1(1):11–21. doi: 10.1038/35036035. [DOI] [PubMed] [Google Scholar]
- 2.Berridge MJ, Galione A. Cytosolic calcium oscillators. FASEB J. 1988;2(15):3074–82. doi: 10.1096/fasebj.2.15.2847949. [DOI] [PubMed] [Google Scholar]
- 3.Putney JW, Jr, Thomas AP. Calcium signaling: double duty for calcium at the mitochondrial uniporter. Curr Biol. 2006;16(18):R812–5. doi: 10.1016/j.cub.2006.08.040. [DOI] [PMC free article] [PubMed] [Google Scholar]
- 4.Tinel H, et al. Active mitochondria surrounding the pancreatic acinar granule region prevent spreading of inositol trisphosphate-evoked local cytosolic Ca(2+) signals. EMBO J. 1999;18(18):4999–5008. doi: 10.1093/emboj/18.18.4999. [DOI] [PMC free article] [PubMed] [Google Scholar]
- 5.Parker I, Ivorra I. Localized all-or-none calcium liberation by inositol trisphosphate. Science. 1990;250(4983):977–9. doi: 10.1126/science.2237441. [DOI] [PubMed] [Google Scholar]
- 6.Llinas R, Sugimori M, Silver RB. Microdomains of high calcium concentration in a presynaptic terminal. Science. 1992;256(5057):677–9. doi: 10.1126/science.1350109. [DOI] [PubMed] [Google Scholar]
- 7.Filadi R, Pozzan T. Generation and functions of second messengers microdomains. Cell Calcium. 2015;58(4):405–14. doi: 10.1016/j.ceca.2015.03.007. [DOI] [PubMed] [Google Scholar]
- 8.Naraghi M, Neher E. Linearized buffered Ca2+ diffusion in microdomains and its implications for calculation of [Ca2+] at the mouth of a calcium channel. J Neurosci. 1997;17(18):6961–73. doi: 10.1523/JNEUROSCI.17-18-06961.1997. [DOI] [PMC free article] [PubMed] [Google Scholar]
- 9.Liou J, et al. STIM is a Ca2+ sensor essential for Ca2+-store-depletion-triggered Ca2+ influx. Curr Biol. 2005;15(13):1235–41. doi: 10.1016/j.cub.2005.05.055. [DOI] [PMC free article] [PubMed] [Google Scholar]
- 10.Feske S, et al. A mutation in Orai1 causes immune deficiency by abrogating CRAC channel function. Nature. 2006;441(7090):179–85. doi: 10.1038/nature04702. [DOI] [PubMed] [Google Scholar]
- 11.Jousset H, Frieden M, Demaurex N. STIM1 knockdown reveals that store-operated Ca2+ channels located close to sarco/endoplasmic Ca2+ ATPases (SERCA) pumps silently refill the endoplasmic reticulum. J Biol Chem. 2007;282(15):11456–64. doi: 10.1074/jbc.M609551200. [DOI] [PubMed] [Google Scholar]
- 12.Waterman-Storer CM, Salmon ED. Endoplasmic reticulum membrane tubules are distributed by microtubules in living cells using three distinct mechanisms. Curr Biol. 1998;8(14):798–806. doi: 10.1016/s0960-9822(98)70321-5. [DOI] [PubMed] [Google Scholar]
- 13.Pendin D, McNew JA, Daga A. Balancing ER dynamics: shaping, bending, severing, and mending membranes. Curr Opin Cell Biol. 2011;23(4):435–42. doi: 10.1016/j.ceb.2011.04.007. [DOI] [PMC free article] [PubMed] [Google Scholar]
- 14.Urra H, Hetz C. The ER in 4D: a novel stress pathway controlling endoplasmic reticulum membrane remodeling. Cell Death Differ. 2012;19(12):1893–5. doi: 10.1038/cdd.2012.127. [DOI] [PMC free article] [PubMed] [Google Scholar]
- 15.Csordas G, et al. Structural and functional features and significance of the physical linkage between ER and mitochondria. J Cell Biol. 2006;174(7):915–21. doi: 10.1083/jcb.200604016. [DOI] [PMC free article] [PubMed] [Google Scholar]
- 16.Hayashi T, et al. Three-dimensional electron microscopy reveals new details of membrane systems for Ca2+ signaling in the heart. J Cell Sci. 2009;122(Pt 7):1005–13. doi: 10.1242/jcs.028175. [DOI] [PMC free article] [PubMed] [Google Scholar]
- 17.Boncompagni S, et al. Mitochondria are linked to calcium stores in striated muscle by developmentally regulated tethering structures. Mol Biol Cell. 2009;20(3):1058–67. doi: 10.1091/mbc.E08-07-0783. [DOI] [PMC free article] [PubMed] [Google Scholar]
- 18.Rizzuto R, et al. Microdomains with high Ca2+ close to IP3-sensitive channels that are sensed by neighboring mitochondria. Science. 1993;262(5134):744–7. doi: 10.1126/science.8235595. [DOI] [PubMed] [Google Scholar]
- 19.Csordas G, et al. MICU1 controls both the threshold and cooperative activation of the mitochondrial Ca(2)(+) uniporter. Cell Metab. 2013;17(6):976–87. doi: 10.1016/j.cmet.2013.04.020. [DOI] [PMC free article] [PubMed] [Google Scholar]
- 20.Hoffman NE, et al. SLC25A23 augments mitochondrial Ca(2)(+) uptake, interacts with MCU, and induces oxidative stress-mediated cell death. Mol Biol Cell. 2014;25(6):936–47. doi: 10.1091/mbc.E13-08-0502. [DOI] [PMC free article] [PubMed] [Google Scholar]
- 21.Giacomello M, et al. Ca2+ hot spots on the mitochondrial surface are generated by Ca2+ mobilization from stores, but not by activation of store-operated Ca2+ channels. Mol Cell. 2010;38(2):280–90. doi: 10.1016/j.molcel.2010.04.003. [DOI] [PubMed] [Google Scholar]
- 22.Csordas G, et al. Imaging interorganelle contacts and local calcium dynamics at the ER-mitochondrial interface. Mol Cell. 2010;39(1):121–32. doi: 10.1016/j.molcel.2010.06.029. [DOI] [PMC free article] [PubMed] [Google Scholar]
- 23.Zaccolo M, Pozzan T. Discrete microdomains with high concentration of cAMP in stimulated rat neonatal cardiac myocytes. Science. 2002;295(5560):1711–5. doi: 10.1126/science.1069982. [DOI] [PubMed] [Google Scholar]
- 24.Prosser BL, Ward CW, Lederer WJ. X-ROS signaling: rapid mechano-chemo transduction in heart. Science. 2011;333(6048):1440–5. doi: 10.1126/science.1202768. [DOI] [PubMed] [Google Scholar]
- 25.Yan Y, et al. Cross-talk between calcium and reactive oxygen species signaling. Acta Pharmacol Sin. 2006;27(7):821–6. doi: 10.1111/j.1745-7254.2006.00390.x. [DOI] [PubMed] [Google Scholar]
- 26.Hidalgo C, Donoso P. Crosstalk between calcium and redox signaling: from molecular mechanisms to health implications. Antioxid Redox Signal. 2008;10(7):1275–312. doi: 10.1089/ars.2007.1886. [DOI] [PubMed] [Google Scholar]
- 27.Bootman MD, Taylor CW, Berridge MJ. The thiol reagent, thimerosal, evokes Ca2+ spikes in HeLa cells by sensitizing the inositol 1,4,5-trisphosphate receptor. J Biol Chem. 1992;267(35):25113–9. [PubMed] [Google Scholar]
- 28.Bansaghi S, et al. Isoform- and Species-specific Control of Inositol 1,4,5-Trisphosphate (IP3) Receptors by Reactive Oxygen Species. J Biol Chem. 2014;289(12):8170–81. doi: 10.1074/jbc.M113.504159. [DOI] [PMC free article] [PubMed] [Google Scholar]
- 29.Kneen M, et al. Green fluorescent protein as a noninvasive intracellular pH indicator. Biophys J. 1998;74(3):1591–9. doi: 10.1016/S0006-3495(98)77870-1. [DOI] [PMC free article] [PubMed] [Google Scholar]
- 30.Griesbeck O, et al. Reducing the environmental sensitivity of yellow fluorescent protein. Mechanism and applications. J Biol Chem. 2001;276(31):29188–94. doi: 10.1074/jbc.M102815200. [DOI] [PubMed] [Google Scholar]
- 31.Topell S, Hennecke J, Glockshuber R. Circularly permuted variants of the green fluorescent protein. FEBS Lett. 1999;457(2):283–9. doi: 10.1016/s0014-5793(99)01044-3. [DOI] [PubMed] [Google Scholar]
- 32.Nagai T, et al. Circularly permuted green fluorescent proteins engineered to sense Ca2+ Proc Natl Acad Sci U S A. 2001;98(6):3197–202. doi: 10.1073/pnas.051636098. [DOI] [PMC free article] [PubMed] [Google Scholar]
- 33.Nakai J, Ohkura M, Imoto K. A high signal-to-noise Ca(2+) probe composed of a single green fluorescent protein. Nat Biotechnol. 2001;19(2):137–41. doi: 10.1038/84397. [DOI] [PubMed] [Google Scholar]
- 34.Baird GS, Zacharias DA, Tsien RY. Circular permutation and receptor insertion within green fluorescent proteins. Proc Natl Acad Sci U S A. 1999;96(20):11241–6. doi: 10.1073/pnas.96.20.11241. [DOI] [PMC free article] [PubMed] [Google Scholar]
- 35.Abad MF, et al. Mitochondrial pH monitored by a new engineered green fluorescent protein mutant. J Biol Chem. 2004;279(12):11521–9. doi: 10.1074/jbc.M306766200. [DOI] [PubMed] [Google Scholar]
- 36.Zielonka J, Kalyanaraman B. Hydroethidine- and MitoSOX-derived red fluorescence is not a reliable indicator of intracellular superoxide formation: another inconvenient truth. Free Radic Biol Med. 2010;48(8):983–1001. doi: 10.1016/j.freeradbiomed.2010.01.028. [DOI] [PMC free article] [PubMed] [Google Scholar]
- 37.Bonini MG, et al. The oxidation of 2′,7′-dichlorofluorescin to reactive oxygen species: a self-fulfilling prophesy? Free Radic Biol Med. 2006;40(6):968–75. doi: 10.1016/j.freeradbiomed.2005.10.042. [DOI] [PubMed] [Google Scholar]
- 38.Ostergaard H, et al. Shedding light on disulfide bond formation: engineering a redox switch in green fluorescent protein. EMBO J. 2001;20(21):5853–62. doi: 10.1093/emboj/20.21.5853. [DOI] [PMC free article] [PubMed] [Google Scholar]
- 39.Ostergaard H, Tachibana C, Winther JR. Monitoring disulfide bond formation in the eukaryotic cytosol. J Cell Biol. 2004;166(3):337–45. doi: 10.1083/jcb.200402120. [DOI] [PMC free article] [PubMed] [Google Scholar]
- 40.Wachter RM, Remington SJ. Sensitivity of the yellow variant of green fluorescent protein to halides and nitrate. Curr Biol. 1999;9(17):R628–9. doi: 10.1016/s0960-9822(99)80408-4. [DOI] [PubMed] [Google Scholar]
- 41.Dooley CT, et al. Imaging dynamic redox changes in mammalian cells with green fluorescent protein indicators. J Biol Chem. 2004;279(21):22284–93. doi: 10.1074/jbc.M312847200. [DOI] [PubMed] [Google Scholar]
- 42.Rebrin I, Sohal RS. Comparison of thiol redox state of mitochondria and homogenates of various tissues between two strains of mice with different longevities. Exp Gerontol. 2004;39(10):1513–9. doi: 10.1016/j.exger.2004.08.014. [DOI] [PMC free article] [PubMed] [Google Scholar]
- 43.Kemp M, Go YM, Jones DP. Nonequilibrium thermodynamics of thiol/disulfide redox systems: a perspective on redox systems biology. Free Radic Biol Med. 2008;44(6):921–37. doi: 10.1016/j.freeradbiomed.2007.11.008. [DOI] [PMC free article] [PubMed] [Google Scholar]
- 44.Gutscher M, et al. Real-time imaging of the intracellular glutathione redox potential. Nat Methods. 2008;5(6):553–9. doi: 10.1038/nmeth.1212. [DOI] [PubMed] [Google Scholar]
- 45.Monici M. Cell and tissue autofluorescence research and diagnostic applications. Biotechnol Annu Rev. 2005;11:227–56. doi: 10.1016/S1387-2656(05)11007-2. [DOI] [PubMed] [Google Scholar]
- 46.Winterbourn CC. Reconciling the chemistry and biology of reactive oxygen species. Nat Chem Biol. 2008;4(5):278–86. doi: 10.1038/nchembio.85. [DOI] [PubMed] [Google Scholar]
- 47.Mohanty JG, et al. A highly sensitive fluorescent micro-assay of H2O2 release from activated human leukocytes using a dihydroxyphenoxazine derivative. J Immunol Methods. 1997;202(2):133–41. doi: 10.1016/s0022-1759(96)00244-x. [DOI] [PubMed] [Google Scholar]
- 48.Toledano MB, et al. Microbial H2O2 sensors as archetypical redox signaling modules. Trends Biochem Sci. 2004;29(7):351–7. doi: 10.1016/j.tibs.2004.05.005. [DOI] [PubMed] [Google Scholar]
- 49.Zheng M, Aslund F, Storz G. Activation of the OxyR transcription factor by reversible disulfide bond formation. Science. 1998;279(5357):1718–21. doi: 10.1126/science.279.5357.1718. [DOI] [PubMed] [Google Scholar]
- 50.Belousov VV, et al. Genetically encoded fluorescent indicator for intracellular hydrogen peroxide. Nat Methods. 2006;3(4):281–6. doi: 10.1038/nmeth866. [DOI] [PubMed] [Google Scholar]
- 51.Hajnoczky G, et al. Decoding of cytosolic calcium oscillations in the mitochondria. Cell. 1995;82(3):415–24. doi: 10.1016/0092-8674(95)90430-1. [DOI] [PubMed] [Google Scholar]
- 52.Bilan DS, et al. HyPer-3: a genetically encoded H(2)O(2) probe with improved performance for ratiometric and fluorescence lifetime imaging. ACS Chem Biol. 2013;8(3):535–42. doi: 10.1021/cb300625g. [DOI] [PubMed] [Google Scholar]
- 53.Malinouski M, et al. Hydrogen peroxide probes directed to different cellular compartments. PLoS One. 2011;6(1):e14564. doi: 10.1371/journal.pone.0014564. [DOI] [PMC free article] [PubMed] [Google Scholar]
- 54.Enyedi B, Varnai P, Geiszt M. Redox state of the endoplasmic reticulum is controlled by Ero1L-alpha and intraluminal calcium. Antioxid Redox Signal. 2010;13(6):721–9. doi: 10.1089/ars.2009.2880. [DOI] [PubMed] [Google Scholar]
- 55.McAnaney TB, et al. Protonation, photobleaching, and photoactivation of yellow fluorescent protein (YFP 10C): a unifying mechanism. Biochemistry. 2005;44(14):5510–24. doi: 10.1021/bi047581f. [DOI] [PubMed] [Google Scholar]
- 56.Poburko D, Santo-Domingo J, Demaurex N. Dynamic regulation of the mitochondrial proton gradient during cytosolic calcium elevations. J Biol Chem. 2011;286(13):11672–84. doi: 10.1074/jbc.M110.159962. [DOI] [PMC free article] [PubMed] [Google Scholar]
- 57.Ermakova YG, et al. Red fluorescent genetically encoded indicator for intracellular hydrogen peroxide. Nat Commun. 2014;5:5222. doi: 10.1038/ncomms6222. [DOI] [PMC free article] [PubMed] [Google Scholar]
- 58.Shui B, et al. Circular permutation of red fluorescent proteins. PLoS One. 2011;6(5):e20505. doi: 10.1371/journal.pone.0020505. [DOI] [PMC free article] [PubMed] [Google Scholar]
- 59.Ma LH, Takanishi CL, Wood MJ. Molecular mechanism of oxidative stress perception by the Orp1 protein. J Biol Chem. 2007;282(43):31429–36. doi: 10.1074/jbc.M705953200. [DOI] [PubMed] [Google Scholar]
- 60.Enyedi B, et al. Spatial and temporal analysis of NADPH oxidase-generated hydrogen peroxide signals by novel fluorescent reporter proteins. Antioxid Redox Signal. 2013;19(6):523–34. doi: 10.1089/ars.2012.4594. [DOI] [PubMed] [Google Scholar]
- 61.Kolossov VL, et al. Engineering redox-sensitive linkers for genetically encoded FRET-based biosensors. Exp Biol Med (Maywood) 2008;233(2):238–48. doi: 10.3181/0707-RM-192. [DOI] [PubMed] [Google Scholar]
- 62.Gutscher M, et al. Proximity-based protein thiol oxidation by H2O2-scavenging peroxidases. J Biol Chem. 2009;284(46):31532–40. doi: 10.1074/jbc.M109.059246. [DOI] [PMC free article] [PubMed] [Google Scholar]
- 63.Avezov E, et al. Retarded PDI diffusion and a reductive shift in poise of the calcium depleted endoplasmic reticulum. BMC Biol. 2015;13:2. doi: 10.1186/s12915-014-0112-2. [DOI] [PMC free article] [PubMed] [Google Scholar]
- 64.Hansen JM, Go YM, Jones DP. Nuclear and mitochondrial compartmentation of oxidative stress and redox signaling. Annu Rev Pharmacol Toxicol. 2006;46:215–34. doi: 10.1146/annurev.pharmtox.46.120604.141122. [DOI] [PubMed] [Google Scholar]
- 65.Chance B, et al. Oxidation-reduction ratio studies of mitochondria in freeze-trapped samples. NADH and flavoprotein fluorescence signals. J Biol Chem. 1979;254(11):4764–71. [PubMed] [Google Scholar]
- 66.Robb-Gaspers LD, et al. Integrating cytosolic calcium signals into mitochondrial metabolic responses. Embo J. 1998;17(17):4987–5000. doi: 10.1093/emboj/17.17.4987. [DOI] [PMC free article] [PubMed] [Google Scholar]
- 67.Voronina S, et al. Correlation of NADH and Ca2+ signals in mouse pancreatic acinar cells. J Physiol. 2002;539(Pt 1):41–52. doi: 10.1113/jphysiol.2001.013134. [DOI] [PMC free article] [PubMed] [Google Scholar]
- 68.Duchen MR. Ca(2+)-dependent changes in the mitochondrial energetics in single dissociated mouse sensory neurons. Biochem J. 1992;283(Pt 1):41–50. doi: 10.1042/bj2830041. [DOI] [PMC free article] [PubMed] [Google Scholar]
- 69.Booth DM, et al. Reactive oxygen species induced by bile acid induce apoptosis and protect against necrosis in pancreatic acinar cells. Gastroenterology. 2011;140(7):2116–25. doi: 10.1053/j.gastro.2011.02.054. [DOI] [PubMed] [Google Scholar]
- 70.Blacker TS, et al. Separating NADH and NADPH fluorescence in live cells and tissues using FLIM. Nat Commun. 2014;5:3936. doi: 10.1038/ncomms4936. [DOI] [PMC free article] [PubMed] [Google Scholar]
- 71.Zhao Y, et al. Genetically encoded fluorescent sensors for intracellular NADH detection. Cell Metab. 2011;14(4):555–66. doi: 10.1016/j.cmet.2011.09.004. [DOI] [PMC free article] [PubMed] [Google Scholar]
- 72.Hung YP, et al. Imaging cytosolic NADH-NAD(+) redox state with a genetically encoded fluorescent biosensor. Cell Metab. 2011;14(4):545–54. doi: 10.1016/j.cmet.2011.08.012. [DOI] [PMC free article] [PubMed] [Google Scholar]
- 73.Shaner NC, Steinbach PA, Tsien RY. A guide to choosing fluorescent proteins. Nat Methods. 2005;2(12):905–9. doi: 10.1038/nmeth819. [DOI] [PubMed] [Google Scholar]
- 74.Winterbourn CC, Metodiewa D. The reaction of superoxide with reduced glutathione. Arch Biochem Biophys. 1994;314(2):284–90. doi: 10.1006/abbi.1994.1444. [DOI] [PubMed] [Google Scholar]
- 75.Imai H, Nakagawa Y. Biological significance of phospholipid hydroperoxide glutathione peroxidase (PHGPx, GPx4) in mammalian cells. Free Radic Biol Med. 2003;34(2):145–69. doi: 10.1016/s0891-5849(02)01197-8. [DOI] [PubMed] [Google Scholar]
- 76.Sies H, et al. Glutathione peroxidase protects against peroxynitrite-mediated oxidations. A new function for selenoproteins as peroxynitrite reductase. J Biol Chem. 1997;272(44):27812–7. doi: 10.1074/jbc.272.44.27812. [DOI] [PubMed] [Google Scholar]
- 77.Mehmeti I, Lortz S, Lenzen S. The H2O2-sensitive HyPer protein targeted to the endoplasmic reticulum as a mirror of the oxidizing thiol-disulfide milieu. Free Radic Biol Med. 2012;53(7):1451–8. doi: 10.1016/j.freeradbiomed.2012.08.010. [DOI] [PubMed] [Google Scholar]
- 78.Akerboom J, et al. Genetically encoded calcium indicators for multi-color neural activity imaging and combination with optogenetics. Front Mol Neurosci. 2013;6:2. doi: 10.3389/fnmol.2013.00002. [DOI] [PMC free article] [PubMed] [Google Scholar]
- 79.Wu J, et al. Improved orange and red Ca(2)+/− indicators and photophysical considerations for optogenetic applications. ACS Chem Neurosci. 2013;4(6):963–72. doi: 10.1021/cn400012b. [DOI] [PMC free article] [PubMed] [Google Scholar]
- 80.Hajnoczky G, Thomas AP. Minimal requirements for calcium oscillations driven by the IP3 receptor. Embo J. 1997;16(12):3533–43. doi: 10.1093/emboj/16.12.3533. [DOI] [PMC free article] [PubMed] [Google Scholar]
- 81.Aller I, Rouhier N, Meyer AJ. Development of roGFP2-derived redox probes for measurement of the glutathione redox potential in the cytosol of severely glutathione-deficient rml1 seedlings. Front Plant Sci. 2013;4:506. doi: 10.3389/fpls.2013.00506. [DOI] [PMC free article] [PubMed] [Google Scholar]
- 82.Avezov E, et al. Lifetime imaging of a fluorescent protein sensor reveals surprising stability of ER thiol redox. J Cell Biol. 2013;201(2):337–49. doi: 10.1083/jcb.201211155. [DOI] [PMC free article] [PubMed] [Google Scholar]
- 83.Wang W, et al. Superoxide flashes in single mitochondria. Cell. 2008;134(2):279–90. doi: 10.1016/j.cell.2008.06.017. [DOI] [PMC free article] [PubMed] [Google Scholar]
- 84.Cheng H, Lederer WJ, Cannell MB. Calcium sparks: elementary events underlying excitation-contraction coupling in heart muscle. Science. 1993;262(5134):740–4. doi: 10.1126/science.8235594. [DOI] [PubMed] [Google Scholar]
- 85.Pal R, et al. Real-time imaging of NADPH oxidase activity in living cells using a novel fluorescent protein reporter. PLoS One. 2013;8(5):e63989. doi: 10.1371/journal.pone.0063989. [DOI] [PMC free article] [PubMed] [Google Scholar]
- 86.Rusinol AE, et al. A unique mitochondria-associated membrane fraction from rat liver has a high capacity for lipid synthesis and contains pre-Golgi secretory proteins including nascent lipoproteins. J Biol Chem. 1994;269(44):27494–502. [PubMed] [Google Scholar]
- 87.Bravo R, et al. Increased ER-mitochondrial coupling promotes mitochondrial respiration and bioenergetics during early phases of ER stress. J Cell Sci. 2011;124(Pt 13):2143–52. doi: 10.1242/jcs.080762. [DOI] [PMC free article] [PubMed] [Google Scholar]
- 88.Mbaya E, et al. Calcium signalling-dependent mitochondrial dysfunction and bioenergetics regulation in respiratory chain Complex II deficiency. Cell Death Differ. 2010;17(12):1855–66. doi: 10.1038/cdd.2010.51. [DOI] [PubMed] [Google Scholar]
- 89.Gilady SY, et al. Ero1alpha requires oxidizing and normoxic conditions to localize to the mitochondria-associated membrane (MAM) Cell Stress Chaperones. 2010;15(5):619–29. doi: 10.1007/s12192-010-0174-1. [DOI] [PMC free article] [PubMed] [Google Scholar]
- 90.Hu J, Dong L, Outten CE. The redox environment in the mitochondrial intermembrane space is maintained separately from the cytosol and matrix. J Biol Chem. 2008;283(43):29126–34. doi: 10.1074/jbc.M803028200. [DOI] [PMC free article] [PubMed] [Google Scholar]
- 91.Kojer K, et al. Glutathione redox potential in the mitochondrial intermembrane space is linked to the cytosol and impacts the Mia40 redox state. EMBO J. 2012;31(14):3169–82. doi: 10.1038/emboj.2012.165. [DOI] [PMC free article] [PubMed] [Google Scholar]
- 92.Gincel D, Zaid H, Shoshan-Barmatz V. Calcium binding and translocation by the voltage-dependent anion channel: a possible regulatory mechanism in mitochondrial function. Biochem J. 2001;358(Pt 1):147–55. doi: 10.1042/0264-6021:3580147. [DOI] [PMC free article] [PubMed] [Google Scholar]
- 93.Rapizzi E, et al. Recombinant expression of the voltage-dependent anion channel enhances the transfer of Ca2+ microdomains to mitochondria. J Cell Biol. 2002;159(4):613–24. doi: 10.1083/jcb.200205091. [DOI] [PMC free article] [PubMed] [Google Scholar]
- 94.Higo T, et al. Subtype-specific and ER lumenal environment-dependent regulation of inositol 1,4,5-trisphosphate receptor type 1 by ERp44. Cell. 2005;120(1):85–98. doi: 10.1016/j.cell.2004.11.048. [DOI] [PubMed] [Google Scholar]
- 95.Anelli T, et al. ERp44, a novel endoplasmic reticulum folding assistant of the thioredoxin family. EMBO J. 2002;21(4):835–44. doi: 10.1093/emboj/21.4.835. [DOI] [PMC free article] [PubMed] [Google Scholar]
- 96.Anelli T, et al. Ero1alpha regulates Ca(2+) fluxes at the endoplasmic reticulum-mitochondria interface (MAM) Antioxid Redox Signal. 2012;16(10):1077–87. doi: 10.1089/ars.2011.4004. [DOI] [PubMed] [Google Scholar]
- 97.Fan G, et al. Gating machinery of InsP3R channels revealed by electron cryomicroscopy. Nature. 2015;527(7578):336–41. doi: 10.1038/nature15249. [DOI] [PMC free article] [PubMed] [Google Scholar]
- 98.Youdim MB, Edmondson D, Tipton KF. The therapeutic potential of monoamine oxidase inhibitors. Nat Rev Neurosci. 2006;7(4):295–309. doi: 10.1038/nrn1883. [DOI] [PubMed] [Google Scholar]
- 99.Winklhofer KF, Haass C. Mitochondrial dysfunction in Parkinson’s disease. Biochim Biophys Acta. 2010;1802(1):29–44. doi: 10.1016/j.bbadis.2009.08.013. [DOI] [PubMed] [Google Scholar]
- 100.Schapira AH. Calcium dysregulation in Parkinson’s disease. Brain. 2013;136(Pt 7):2015–6. doi: 10.1093/brain/awt180. [DOI] [PubMed] [Google Scholar]
- 101.Goldberg DJ. Local role of Ca2+ in formation of veils in growth cones. J Neurosci. 1988;8(7):2596–605. doi: 10.1523/JNEUROSCI.08-07-02596.1988. [DOI] [PMC free article] [PubMed] [Google Scholar]
- 102.Chadborn N, et al. Direct measurement of local raised subplasmalemmal calcium concentrations in growth cones advancing on an N-cadherin substrate. Eur J Neurosci. 2002;15(12):1891–8. doi: 10.1046/j.1460-9568.2002.02033.x. [DOI] [PubMed] [Google Scholar]
- 103.Bautista DM, Lewis RS. Modulation of plasma membrane calcium-ATPase activity by local calcium microdomains near CRAC channels in human T cells. J Physiol. 2004;556(Pt 3):805–17. doi: 10.1113/jphysiol.2003.060004. [DOI] [PMC free article] [PubMed] [Google Scholar]
- 104.Frieden M, et al. Subplasmalemmal mitochondria modulate the activity of plasma membraneCa2+-ATPases. J Biol Chem. 2005;280(52):43198–208. doi: 10.1074/jbc.M510279200. [DOI] [PubMed] [Google Scholar]
- 105.Gu M, Imlay JA. The SoxRS response of Escherichia coli is directly activated by redox-cycling drugs rather than by superoxide. Mol Microbiol. 2011;79(5):1136–50. doi: 10.1111/j.1365-2958.2010.07520.x. [DOI] [PMC free article] [PubMed] [Google Scholar]
- 106.Schwarzlander M, et al. The ‘mitoflash’ probe cpYFP does not respond to superoxide. Nature. 2014;514(7523):E12–4. doi: 10.1038/nature13858. [DOI] [PMC free article] [PubMed] [Google Scholar]