

Abstract
The rapid development in fluorescence microscopy and imaging techniques has greatly benefited our understanding of the mechanisms governing cellular processes at the molecular level. In particular, super-resolution microscopy methods overcome the diffraction limit to observe nanoscale cellular structures with unprecedented detail, and single-molecule tracking provides precise dynamic information about the motions of labeled proteins and oligonucleotides. Enhanced photostability of fluorescent labels (i.e., maximum emitted photons before photobleaching) is a critical requirement for achieving the ultimate spatio-temporal resolution with either method. While super-resolution imaging has greatly benefited from highly photostable fluorophores, a shortage of photostable fluorescent labels for bacteria has limited its use in these small but relevant organisms. In this study, we report the use of a highly photostable fluoromodule, dL5, to genetically label proteins in the Gram-negative bacterium Caulobacter crescentus, enabling long time-scale protein tracking and super-resolution microscopy. dL5 imaging relies on the activation of the fluorogen Malachite Green (MG), and can be used to label proteins sparsely, enabling single protein detection in live bacteria without initial bleaching steps. dL5-MG complexes emit two-fold more photons before photobleaching compared to organic dyes such as Cy5 and Alexa 647 in vitro; and five-fold more photons compared to eYFP in vivo. We imaged fusions of dL5 to three different proteins in live Caulobacter cells using stimulated emission depletion (STED) microscopy, yielding a four-fold resolution enhancement compared to diffraction-limited imaging. Importantly, dL5 fusions to an intermediate filament protein CreS are significantly less perturbative compared to traditional fluorescent protein fusions. To the best of our knowledge, this is the first demonstration of the use of fluorogen activating proteins for super-resolution imaging in live bacterial cells.
TOC image

Genetically expressed fusions to green fluorescent protein (FP) and its relatives have provided a powerful way to label specific biomolecules in a wide array of cell types.1 The advancement of super-resolution microscopy and single-molecule tracking tools have enabled us to visualize single proteins and protein structures in bacterial cells and have furthered our understanding of the various processes that occur in these cells with remarkable detail.2–6 Both of these methods require the largest possible numbers of available photons before photobleaching, because the precision of single-molecule tracking and the resolution of protein structure improves with an increasing number of photons detected in an image. In most cases, small organic molecules can emit more photons before photobleaching (typically ~106) than FPs (often ~105), thus strategies for genetically targeting small organic molecules can be beneficial.7 This has led to a push in the development of fluoromodules based on a genetically encoded protein that can specifically bind to an organic dye with the correct reactive handle. Fluoromodules such as SNAP, CLIP and HaloTag have successfully targeted photostable dyes in super-resolution microscopy.8, 9 While these fluoromodules have found wide use in imaging eukaryotic cells, their applications to bacterial cells have been limited due to challenges posed during labeling. For example, enzymatic tags require incubation of 10−6–10−3 M dyes for over an hour followed by multiple washing steps during which bacterial cells may undergo multiple division cycles.8 Further, long time scale single-protein tracking using photostable fluorophores remains an important yet unmet need in live bacterial cells. Hence, there is a need to deliver a low dose of fluorescent markers relatively quickly (before cell division) in order to obtain relevant structural and functional information from live bacteria; something that has relied predominantly on FPs and enzymatic labeling schemes in the past.10, 11
Fluorogen-activating peptides (FAPs) are a class of fluoromodules that bind a non-fluorescent small molecule in a non-covalent fashion and exhibit fluorescence.12 Malachite Green (MG) is one such fluorogen whose fluorescence is strongly quenched by conformational flexibility in solution. However, upon binding to a cognate FAP, MG is conformationally constrained and exhibits an 18000-fold fluorescence increase.12 MG binding FAPs have been used in live cell super-resolution microscopy (using STED and super-localization approaches) and single-protein tracking.13–15 One particular FAP, dL5 has been optimized for better spectral properties and a high binding affinity for MG.16 The dL5-MG (Figure 1A, Figure S1A) complex has several advantages for live cell imaging such as a far-red emission, high photostability, low-picomolar binding affinity and an extremely slow off rate.17 Despite these improved properties, this fluoromodule has not been applied to bacterial imaging and super-resolution microscopy.
Figure 1.
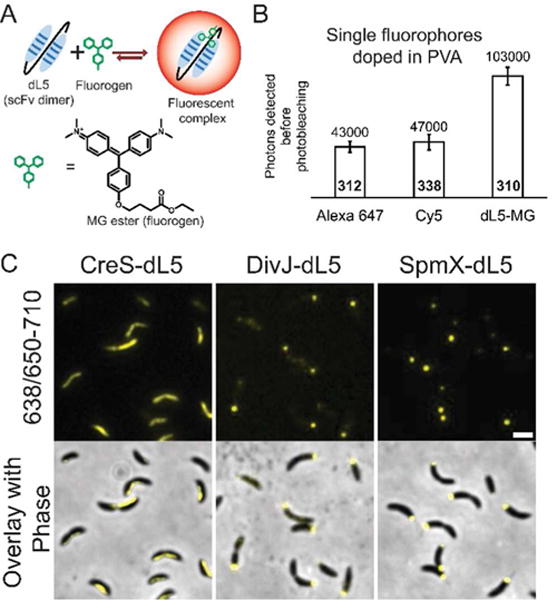
(A) Schematic of the binding reaction between dL5 and MG-ester (structure shown).12 Note that the unequal length arrows shown in the reaction represent a fast on rate and a slow off rate. (B) Comparison of dL5-MG with Alexa 647 and Cy5 in vitro. The numbers above the bars denote the mean of the distribution of photons detected before photo-bleaching (error bars denote ± S.E.M) whereas the numbers inside the bars (bold) denote the number of molecules analyzed. (C) Diffraction limited widefield images of the Caulobacter strains expressing CreS-dL5, DivJ-dL5 and SpmX-dL5, respectively. The top row shows the fluorescence images acquired using excitation from a 638 nm laser while collecting emission from 650–710 nm. The bottom row shows the overlay of phase contrast and fluorescence images for the same cells. Scale bar is 1μm.
In this study, we demonstrate long time scale protein tracking and super-resolution microscopy of the dL5-MG fluoromodule in live Caulobacter cells. We targeted proteins from three different families: an intermediate filament-like protein, a histidine kinase and a lysozyme-like polar localization factor. dL5-MG enabled the tracking of single proteins for several seconds in live cells, providing a better alternative to FPs for single protein tracking. Additionally, we report the first use of dL5-MG for STED imaging in live bacteria, yielding up to four-fold resolution enhancement compared to conventional confocal microscopy. Importantly, the dL5 fusions to the intermediate filament-like protein perturb its cellular structure significantly less than eYFP fusions. The advances reported here pave the way for imaging structures in bacteria with high spatial resolution (FWHM down to 60 nm) and tracking of single molecules for extended time scales up to ten seconds.
Measurements of photostability in live cells are obscured by diffusion of molecules and oxidative or reductive intracellular environments. In order to determine the mean detected photons available before photobleaching from dL5-MG, we imaged single dL5-MG molecules doped in poly(vinyl alcohol) (PVA) and compared the performance to conventional organic fluorophores such as Cy5 and Alexa 647. The results show that dL5-MG is about two-fold more photostable than these dyes (Figure 1B). For some fluorophores, saturation of absorption can occur at high intensities, thereby decreasing the amount of energy absorbed and the signal-to-background.18 This leads to a non-linear emission response from the fluorophore. The dL5-MG complex showed a linear emission response across the typical excitation intensities used for single-molecule measurements, ranging from 389 W/cm2 to 1500 W/cm2 (Figure S1B). This implies that absorption saturation and non-radiative processes do not take precedence over fluorescence at typical single molecule imaging conditions for the dL5-MG complex.
In order to utilize dL5-MG for photostable imaging, we engineered C-terminus fusions of three Caulobacter proteins (Figure S2A). The first protein, Crescentin (CreS) is an intermediate filament homolog that is responsible for the crescent shape of Caulobacter.19 Additionally, we engineered dL5 fusions of a polar-localized cell fate determinant (a histidine protein kinase known as DivJ) and a polar-localized lysozyme homolog, SpmX.20, 21 Together, these proteins are important components of networks that control cell morphology and signaling. Cells from these strains of Caulobacter were incubated with the membrane-permeable MG-ester fluorogen,12 washed, and imaged using a diffraction-limited epifluorescence microscope (Figure 1C). The localization patterns of the imaged proteins are consistent with previous work.19, 20, 21 The labeling could be performed in under ten minutes, which is well under the typical division time of Caulobacter. Upon MG-ester labeling, the cells expressing dL5 fusions grew and divided normally in growth media and on agarose pads used for imaging (Figures S2B and C). Therefore, we concluded that the dL5-MG fluoromodule is suitable for live cell imaging of Caulobacter cells.
Due to its enhanced photostability, dL5-MG can provide an excellent alternative to FPs for single-protein tracking in bacteria. To test this, we compared the performance of SpmX- dL5 fusions to corresponding SpmX-eYFP fusions. We chose eYFP as a benchmark as it is a widely used FP in bacterial imaging. One advantage of using dL5-MG compared to FPs is that the number of fluorescent molecules in the cell can be controlled by tuning the fluorogen concentration, thus removing the need for pre-bleaching steps to reach single-molecule concentrations. As a result, cells avoid a high dose of light before useful imaging. Furthermore, the long-wavelength emission from dL5-MG allows one to benefit from a lower background fluorescence from cells as well as from the agarose used as the mounting medium for imaging (Figure S3). Finally, significant photoblinking was not observed from single dL5-MG molecules even under high excitation intensities in live bacterial cells (Figure S4). This lack of blinking makes dL5-MG suitable for tracking experiments.
We used a wide-field epifluorescence microscope to track over 200 molecules of SpmX-dL5 and SpmX-eYFP under similar imaging conditions and measured the photons detected per track. Typical tracks from SpmX-eYFP only lasted up to 1 second whereas the SpmX-dL5 tracks lasted up to 10 seconds (Figure 2A through D). Time traces showing single-step photobleaching confirmed that the tracks obtained were indeed single molecules, rather than multiple emitters (Figure 2E and F, inset). From the measured distribution of the photons detected per track, we conclude that dL5-MG is about fivefold more photostable compared to eYFP under the same excitation intensities in vivo (Figure 2E and F). Therefore, the combination of the lack of pre-bleaching, no requirement for short wavelength activation, a far-red emission spectrum, and a five-fold higher number of photons make dL5-MG an excellent genetically directed choice for single-protein tracking experiments in Caulobacter compared to conventional FPs.
Figure 2.

(A, B) Reverse contrast display of a white light image of a Caulobacter cell with a single (A) SpmX-eYFP and (B) SpmX-dL5 molecule track shown in yellow in the dotted box. Scale bars are 500 nm. (C) Magnified view of the single track of SpmX-eYFP molecule from A that lasted for ~1s, time colored. (D) Magnified view of the single track of SpmX-dL5 molecule from B that lasted for over 10s. (E, F) Distribution of the photons detected per track for (E) SpmX-eYFP molecules and (F) SpmX-dL5 molecules in live Caulobacter cells. The red line shows an exponential fit with mean and standard deviations noted at the top. Also shown are the time traces of the tracked molecule from (C) and (D) confirming single-step photobleaching.
Owing to the remarkable photostability and fluorogenic nature of dL5-MG, we attempted to perform single-molecule super-resolution microscopy on cells expressing CreS-dL5. We first employed a PAINT-like technique where we supplemented the mounting medium (agarose) with excess MG-ester.22 We hypothesized that the normally dark MG-ester molecules would slowly diffuse through the cell, fluoresce upon binding dL5, and be localized. However, we observed that MG-ester activated upon binding to the bacterial cell surface (Figure S5). This was expected since similar floppy dyes such as Crystal violet have been shown to bind to the peptidoglycan layer in bacteria.23 However, we also found that we could robustly and easily wash out MG-ester loosely bound to the Caulobacter surface (Figure S5).
The nonspecific binding of MG-ester and washing thus required an alternative method to obtain super-resolution images. For this, we utilized STED microscopy that relies on shrinking the effective excitation PSF to achieve super-resolution. We tested the utility of dL5-MG in STED imaging using a home built fast scanning pulsed STED microscope (Figure S6). Sample preparation for STED imaging was the same as that used for diffraction-limited imaging. STED images overlaid with reverse contrast white light images showed the same localization patterns for Cres-dL5, SpmX-dL5, and DivJ-dL5 as observed with diffraction-limited images, but with an enhanced resolution (Figure 3A). We observed that most CreS-dL5 fibers localized to the ventral side of the cells. We also obtained STED images of DivJ and SpmX in live cells, which appeared tightly localized to the pole (Figure 3A).
Figure 3.

(A) dL5-MG labeling of CreS, DivJ and SpmX imaged using a fast scanning pulsed STED microscope. Top panel shows the STED images whereas the bottom panel shows an overlay of the reverse contrast white light image with the STED image. For each STED image, the inset shows zoomed in views of features marked with white arrows. All scale bars (cyan) are 500 nm. (B) A comparison of confocal and STED images of CreS-dL5 showing CreS fibers from two adjacent cells with line scans. Scale bars are 500 nm. (C) Bar graphs showing the percentage of detached fibers observed as a function of increasing xylose concentration for induction of labeled CreS. Data are presented as mean ± S.E.M (107< N < 123 for all samples). **p<0.01.
Using the CreS-dL5 fibers as a static structural reference, we obtained an up to four-fold resolution enhancement in STED images compared to confocal imaging (Figure 3B). We also observed similar resolution enhancement for dL5 fusions of CreS, DivJ and SpmX (Figure S7C through E). Images of CreS-eYFP obtained using a commercial cw STED microscope showed a three-fold resolution enhancement over confocal images (Figure S8A through C). Additionally, we obtained a distribution of the CreS fiber widths (FWHM) from STED images with means of 81.0 ± 1.5 nm for CreS-dL5 and 91.0 ± 2.0 nm for CreS-eYFP, respectively (Figure S9). The broader width of the CreS-eYFP fibers may be attributed to the lower resolution from the cw STED measurement at the intensities needed to prevent excessive photobleaching of eYFP.
With the enhanced resolution provided by STED microscopy, we observed that some CreS-dL5 fibers showed detachment phenotypes similar to those previously reported for FP fusions to CreS.19, 24 We investigated this effect further by titrating CreS-dL5 and CreS-eYFP in vivo against the inducer, xylose. We observed detached fibers for CreS-eYFP even at the lowest induction condition (0.06% Xylose for 90 mins, Figure S8D, E). A careful visual scoring of these fibers indicates that dL5 fusions of CreS perturb fiber formation to a significantly lesser extent than eYFP fusions (Supporting Information, Figure S8E and Figure 3C). We also noticed an increase in the number of detached fibers from 9% to 24% upon increasing the xylose dose for CreS-dL5 expressing cells. This implies that insertion of CreS-dL5 molecules leads to fiber detachment although its effect is less drastic compared to CreS-eYFP. Given that dL5 and eYFP are of similar size, this fortuitous effect may be attributed to altered interactions between the labels and the CreS fiber and needs to be explored further. However, dL5-MG complexes emit more photons before photobleaching than eYFP and can be imaged using STED microscopy without over-expression of CreS-dL5 fusion. This opens the possibility for a detailed, non-perturbative study of this intermediate filament-like protein in Caulobacter.
This study is the first use of the dL5-MG fluoromodule to label proteins on a short time scale compared to the cell cycle in live bacteria, thus enabling extended protein tracking and super-resolution microscopy. dL5-MG complexes emit five-fold more photons compared to the commonly used eYFP, enabling high-quality tracking of single proteins for tens of seconds. Further, STED microscopy of dL5 fusions facilitates a four-fold resolution enhancement compared to conventional diffraction-limited images. STED images also revealed that the dL5 fusion of CreS is significantly less perturbative to the fiber formation compared to the corresponding eYFP fusion. The labeling methods developed in this study are applicable to other bacterial species with some optimization. In conclusion, the use of dL5 expands the current bacterial labeling toolbox and promises to achieve enhanced spatio-temporal resolution that is essential for deciphering in vivo protein structures and dynamics in Caulobacter and other bacterial species.
Supplementary Material
Acknowledgments
The authors thank Prof. Marcel Bruchez for providing the plasmids for dL5 and MG-ester. This work was supported in part by the National Institute of General Medical Sciences Grant No. R01GM086196 and R35GM118067. S. S. and A. M. P. were also supported through a seed grant from the Department of Systems Biology at Stanford University. C. J. C. was supported by a National Science Foundation Graduate Fellowship. The Leica STED microscope imaging was supported, in part, by award Number 1S10OD010580 from the National Center for Research Resources (NCRR).
Footnotes
Supporting Information Placeholder
Supporting Information
Experimental methods, microscope setup, analysis procedures along with supporting figures: This supporting information is available free of charge on the ACS publication website.
Notes
The authors declare no competing financial interests.
References
- 1.Shaner NC, Steinbach PA, Tsien RY. Nat Methods. 2005;2:905–909. doi: 10.1038/nmeth819. [DOI] [PubMed] [Google Scholar]
- 2.Gahlmann A, Moerner WE. Nat Rev Micro. 2014;12:9–22. doi: 10.1038/nrmicro3154. [DOI] [PMC free article] [PubMed] [Google Scholar]
- 3.Godin A, Lounis B, Cognet L. Biophys J. 2014;107:1777–1784. doi: 10.1016/j.bpj.2014.08.028. [DOI] [PMC free article] [PubMed] [Google Scholar]
- 4.Coltharp C, Xiao J. Cell Microbiol. 2012;14:1808–1818. doi: 10.1111/cmi.12024. [DOI] [PMC free article] [PubMed] [Google Scholar]
- 5.Huang B, Babcock H, Zhuang X. Cell. 2010;143:1047–1058. doi: 10.1016/j.cell.2010.12.002. [DOI] [PMC free article] [PubMed] [Google Scholar]
- 6.Bianchini P, Peres C, Oneto M, Galiani S, Vicidomini G, Diaspro A. Cell Tissue Res. 2015;360:143–150. doi: 10.1007/s00441-015-2146-3. [DOI] [PMC free article] [PubMed] [Google Scholar]
- 7.Peterman EJG, Brasselet S, Moerner WE. J Phys Chem A. 1999;103:10553–10560. [Google Scholar]
- 8.Lukinavicius G, Umezawa K, Olivier N, Honigmann A, Yang G, Plass T, Mueller V, Reymond L, Corrêa IR, Jr, Luo ZG, Schultz C. Nature Chemistry. 2013;5:132–139. doi: 10.1038/nchem.1546. [DOI] [PubMed] [Google Scholar]
- 9.Stagge F, Mitronova GY, Belov VN, Wurm CA, Jakobs S. PLoS One. 2013;8:e78745. doi: 10.1371/journal.pone.0078745. [DOI] [PMC free article] [PubMed] [Google Scholar]
- 10.Lee HD, Lord SJ, Iwanaga S, Zhan K, Xie H, Williams JC, Wang H, Bowman GR, Goley ED, Shapiro L, Twieg RJ, Rao J, Moerner WE. J Am Chem Soc. 2010;132:15099–15101. doi: 10.1021/ja1044192. [DOI] [PMC free article] [PubMed] [Google Scholar]
- 11.Landgraf D, Okumus B, Chien P, Baker TA, Paulsson J. Nat Meth. 2012;9:480–482. doi: 10.1038/nmeth.1955. [DOI] [PMC free article] [PubMed] [Google Scholar]
- 12.Szent-Gyorgyi C, Schmidt BF, Creeger Y, Fisher GW, Zakel KL, Adler S, Fitzpatrick JAJ, Woolford CA, Yan Q, Vasilev KV, Berget PB, Bruchez MP, Jarvik JW, Waggoner A. Nat Biotech. 2008;26:235–240. doi: 10.1038/nbt1368. [DOI] [PubMed] [Google Scholar]
- 13.Fitzpatrick JA, Yan Q, Sieber JJ, Dyba M, Schwarz U, Szent-Gyorgyi C, Woolford CA, Berget PB, Waggoner AS, Bruchez MP. Bioconjug Chem. 2009;20:1843–1847. doi: 10.1021/bc900249e. [DOI] [PMC free article] [PubMed] [Google Scholar]
- 14.Yan Q, Schwartz SL, Maji S, Huang F, Szent-Gyorgyi C, Lidke DS, Lidke KA, Bruchez MB. ChemPhysChem. 2014;15:687–695. doi: 10.1002/cphc.201300757. [DOI] [PMC free article] [PubMed] [Google Scholar]
- 15.Schwartz SL, Yan Q, Telmer CA, Lidke KA, Bruchez MP, Lidke DS. ACS chemical biology. 2014;10:539–546. doi: 10.1021/cb5005146. [DOI] [PMC free article] [PubMed] [Google Scholar]
- 16.Szent-Gyorgyi C, Stanfield RL, Andreko S, Dempsey A, Ahmed M, Capek S, Waggoner AS, Wilson IA, Bruchez MP. J Mol Biol. 2013;425:4595–4613. doi: 10.1016/j.jmb.2013.08.014. [DOI] [PMC free article] [PubMed] [Google Scholar]
- 17.Saurabh S, Zhang M, Mann VR, Costello AM, Bruchez MP. ChemPhysChem. 2015;16:2974–2980. doi: 10.1002/cphc.201500587. [DOI] [PubMed] [Google Scholar]
- 18.Urdaneta I. Applied Physics B. 2001;72:207–213. [Google Scholar]
- 19.Ausmees N, Kuhn JR, Jacobs-Wagner C. Cell. 2003;115:705–713. doi: 10.1016/s0092-8674(03)00935-8. [DOI] [PubMed] [Google Scholar]
- 20.Wheeler RT, Shapiro L. Mol Cell. 1999;4:683–694. doi: 10.1016/s1097-2765(00)80379-2. [DOI] [PubMed] [Google Scholar]
- 21.Radhakrishnan SK, Thanbichler M, Viollier PH. Genes & Development. 2008;22:212–225. doi: 10.1101/gad.1601808. [DOI] [PMC free article] [PubMed] [Google Scholar]
- 22.Lew MD, Lee SF, Ptacin JL, Lee MK, Twieg RJ, Shapiro L, Moerner WE. Proc Natl Acad Sci U S A. 2011;108:E1102–E1110. doi: 10.1073/pnas.1114444108. [DOI] [PMC free article] [PubMed] [Google Scholar]
- 23.Beveridge TJ. Biotechnic & Histochemistry. 2001;76:111–118. [PubMed] [Google Scholar]
- 24.Gahlmann A, Ptacin JL, Grover G, Quirin S, von Diezmann ARS, Lee MK, Backlund MP, Shapiro L, Piestun R, Moerner WE. Nano Lett. 2013;13:987–993. doi: 10.1021/nl304071h. [DOI] [PMC free article] [PubMed] [Google Scholar]
Associated Data
This section collects any data citations, data availability statements, or supplementary materials included in this article.