

Abstract
Myriapods, including the diverse and familiar centipedes and millipedes, are one of the dominant terrestrial arthropod groups. Although molecular evidence has shown that Myriapoda is monophyletic, its internal phylogeny remains contentious and understudied, especially when compared to those of Chelicerata and Hexapoda. Until now, efforts have focused on taxon sampling (e.g., by including a handful of genes from many species) or on maximizing matrix size (e.g., by including hundreds or thousands of genes in just a few species), but a phylogeny maximizing sampling at both levels remains elusive. In this study, we analyzed 40 Illumina transcriptomes representing 3 of the 4 myriapod classes (Diplopoda, Chilopoda, and Symphyla); 25 transcriptomes were newly sequenced to maximize representation at the ordinal level in Diplopoda and at the family level in Chilopoda. Ten supermatrices were constructed to explore the effect of several potential phylogenetic biases (e.g., rate of evolution, heterotachy) at 3 levels of gene occupancy per taxon (50%, 75%, and 90%). Analyses based on maximum likelihood and Bayesian mixture models retrieved monophyly of each myriapod class, and resulted in 2 alternative phylogenetic positions for Symphyla, as sister group to Diplopoda + Chilopoda, or closer to Diplopoda, the latter hypothesis having been traditionally supported by morphology. Within centipedes, all orders were well supported, but 2 deep nodes remained in conflict in the different analyses despite dense taxon sampling at the family level. Relationships among centipede orders in all analyses conducted with the most complete matrix (90% occupancy) are at odds not only with the sparser but more gene-rich supermatrices (75% and 50% supermatrices) and with the matrices optimizing phylogenetic informativeness or most conserved genes, but also with previous hypotheses based on morphology, development, or other molecular data sets. Our results indicate that a high percentage of ribosomal proteins in the most complete matrices, in conjunction with distance from the root, can act in concert to compromise the estimated relationships within the ingroup. We discuss the implications of these findings in the context of the ever more prevalent quest for completeness in phylogenomic studies.
Keywords: Chilopoda, Diplopoda, gene tree, missing data, node calibration, species tree, Symphyla
The status and interrelationships of Myriapoda have been major questions in arthropod systematics for more than a century (see a recent review in Edgecombe 2011). Variably argued to be mono-, para-, or polyphyletic, molecular systematics has decisively weighed in favor of myriapod monophyly (Regier et al. 2008 2010; Rehm et al. 2014). The closest relative of Myriapoda remains a topic of discussion, though most recent analyses of arthropod phylogeny support an insect-crustacean clade named Pancrustacea or Tetraconata as sister group of Myriapoda. These clades are consistent with the Mandibulata hypothesis (Regier et al. 2010; Rota-Stabelli et al. 2011; Zwick et al. 2012; Borner et al. 2014; Rehm et al. 2014), a result also supported in earlier combined analyses of molecules and morphology (e.g., Giribet et al. 2001). The main alternative is an alliance between Myriapoda and Chelicerata (Paradoxopoda or Myriochelata hypotheses), retrieved in many analyses in the 1990s and 2000s. Debate has now largely shifted to the interrelationships between the 4 main clades of Myriapoda—Chilopoda (centipedes), Diplopoda (millipedes), Pauropoda, and Symphyla— and the branching patterns of the 2 diverse groups, Chilopoda and Diplopoda. These relationships remain contentious based on the analyses of Sanger-sequenced genes, making this arthropod group an ideal candidate to explore through phylogenomics.
Phylogenomic studies based on hundreds or thousands of genes are becoming common in the literature. Although enlarged character sampling often improves the resolution and support for inferred trees (Rokas et al. 2003) these kinds of data sets are vulnerable to systematic error. The large size of many phylogenomic data sets can yield conflicting inferences with higher support for erroneous groupings than seen in smaller data sets. In the last few years, much effort has been devoted to uncovering and understanding the effect of a series of confounding factors in phylogenomic reconstruction, unique to genome-scale data. Perhaps foremost among these is missing data, with studies suggesting a negative (i.e., missing data have a deleterious effect on accuracy; e.g., Roure et al. 2013; Dell’Ampio et al. 2014) or neutral (missing data per se do not directly affect inference; e.g., Wiens 2003; Philippe et al. 2004) effect of the missing data. Taxon sampling (Pick et al. 2010) and quality of data (e.g., proper ortholog assignment and controls on exogenous contamination, Philippe et al. 2011; Salichos and Rokas 2011) have also been suggested to impact strongly on phylogenomic inference. In addition, assumptions underlying concatenation (Salichos and Rokas 2013) and model (mis-)specification (Lartillot and Philippe 2008) have been identified as possible pitfalls for tree reconstruction in a phylogenomic framework. It has been shown as well that conflict may exist between classes of genes, with some authors advocating exclusive usage of slowly evolving genes to resolve deep metazoan splits (e.g., Nosenko et al. 2013), whereas others believe that slow-evolving genes may not be able to resolve deep splits due to the lack of sufficient signal. Compositional heterogeneity (i.e., the nucleotide or amino acid frequencies change across the tree) is not accounted for by the standard nucleotide and amino acid substitution models, which assume stationarity (i.e., transition probabilities do not change across the tree and one set of equilibrium frequencies applies to every point along any edge of the tree). Non-stationarity can therefore lead to compositional attraction artifacts in which tips with similar composition group together even though they may be unrelated. Such systematic error can be especially problematic in the context of rooting, particularly when outgroups used to root the tree are highly divergent from the rest of the taxa (Graham et al. 2002; Wheeler 1990). Whereas rooting with outgroups generally performs better than alternative methods (Huelsenbeck et al. 2002), the accuracy of inferred trees decreases with the distance from the root to the ingroup. Moreover, when some of the ingroup branches are also long, systematic error can artifactually draw these long-branched ingroup taxa to the base of the tree (Philippe et al. 2005). Finally, gene composition has also been shown to affect phylogenomic reconstruction, as different genes can contain a different phylogenetic signal. For instance, ribosomal proteins have been shown to sometimes exhibit conflicting phylogenetic signal (Nosenko et al. 2013; Chang et al. 2015). Although increasingly studies aim to explore the effect of these factors on large genomic or transcriptomic data sets (e.g., Fernández et al. 2014a), to date no single study evaluates all the effects on the same data set, hampering the identification of the most deleterious sources of error as well as the choice of proper experimental design.
Until very recently, analyses of arthropod phylogeny based on transcriptomic data have included just a handful of myriapods, typically one species of Diplopoda and one of Chilopoda (Meusemann et al. 2010; Andrew 2011). This undersampling of myriapod diversity is now being rectified, with the first phylogenomic studies aimed at testing major hypotheses about diplopod and chilopod phylogeny appearing. Relationships between 8 of the 16 recognized millipede orders have been inferred using 221 genes sampled for 9 species (Brewer and Bond 2013), and interrelations of the 5 extant chilopod orders have been estimated using transcriptomes for 7 species and up to 1934 genes (Fernández et al. 2014b). Rehm et al. (2014) appraised the position of Myriapoda within Arthropoda using up to 181 genes from 8 myriapods, including the first transcriptomic data for Symphyla and some key millipede groups, notably Penicillata (bristly millipedes) and Glomerida (pill millipedes), the latter millipede orders not sampled by Brewer and Bond (2013). However, none of these studies included a dense taxonomic sampling across Myriapoda: to date, the maximum number of myriapods included in phylogenomic studies is 10, 1 centipede, and 9 millipedes (Brewer and Bond 2013). In addition to the limited representation of taxa, most of these studies did not provide indepth analysis of the robustness of the recovered phylogenetic hypotheses.
The most widely endorsed phylogenetic framework for myriapods based on morphology and development divides the group into Chilopoda and a putative clade named Progoneata based on its anteriorly situated gonopore. The standard resolution within Progoneata is Symphyla as sister group of Pauropoda and Diplopoda, the latter two grouped as Dignatha (Dohle 1980, 1997; Edgecombe 2011). Progoneata has found some support from molecular phylogenetics (Gai et al. 2008; Regier et al. 2010), but it has also been contradicted by a grouping of Chilopoda and Diplopoda (Rehm et al. 2014). The most novel hypothesis to emerge from molecular data is an unanticipated union of pauropods and symphylans (Dong et al. 2012), a group that has been formalized as Edafopoda (Zwick et al. 2012).
Pauropoda and Symphyla are relatively small groups (835 and 195 species, respectively), with few taxonomic specialists. This contrasts with the more diverse and intensely studied Chilopoda and Diplopoda (Fig. 1). Of these, Chilopoda (ca. 3100 species) is the more extensively analyzed phylogenetically, the relationships within its 4 diverse orders having been evaluated based on morphology and targeted sequencing of a few markers (e.g., Giribet and Edgecombe 2013; Vahtera et al. 2013; Bonato et al. 2014a). The interrelationships of the 5 extant centipede orders had converged on a morphological solution (Edgecombe and Giribet 2004) that differs from the first transcriptomic analysis to sample all 5 orders (Fernández et al. 2014b) in one key respect: morphology unites Craterostigmomorpha (an order composed of 2 species of the genus Craterostigmus) with the 2 orders that have strictly epimorphic development, whereas molecules assign the order Lithobiomorpha to that position.
Figure 1.
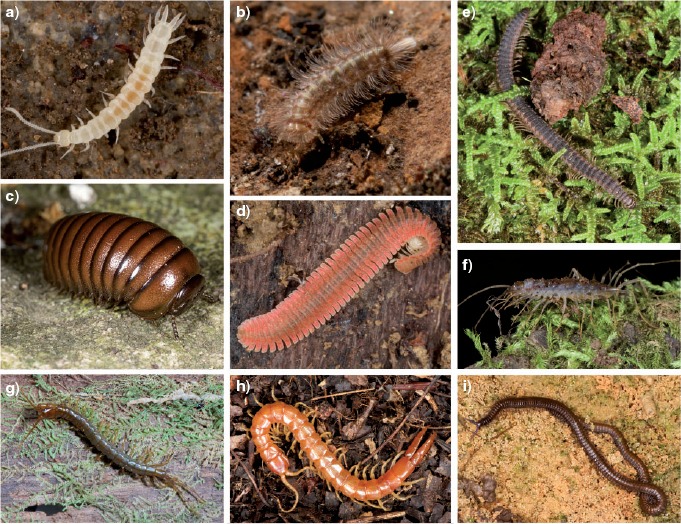
Live habitus of myriapod exemplars from this study. a) Scutigerella sp. from Great Smoky Mountains National Park, Tennessee, USA. b) Eudigraphis taiwaniensis, from Kenting National Park, Taiwan. c) Sphaerotheriid from Helderberg Nature Reserve, South Africa. d) Brachycybe sp. from Great Smoky Mountains National Park. e) Abacion sp. from Great Smoky Mountains National Park. f) Scutigerinaweberi from KwaZulu-Natal, South Africa. g) Craterostigmus crabilli from Kahurangi National Park, New Zealand. h) Theatops spinicaudus from Great Smoky Mountains National Park. i) Notiphilides grandis from Reserva Ducke, Manaus, Amazonas, Brazil.
Millipedes are the most diverse group of myriapods, with 7753 (Shear 2011) to more than 12,000 (Brewer et al. 2012) named species classified in ca. 16 orders (Brewer and Bond 2013). Millipede phylogeny has until recently been inferred based on small sets of morphological characters (Enghoff 1984; Sierwald et al. 2003; Blanke and Wesener 2014), but some analyses of a few nuclear protein-coding genes have allowed traditional ordinal-level systematics to be tested with molecular data (Regier et al. 2005; Miyazawa et al. 2014).
Myriapods include the oldest fossil remains of terrestrial animals, with millipedes and centipedes both having records as far back as the Silurian (Wilson and Anderson 2004; Shear and Edgecombe 2010), and trace fossils indicate the activity of millipedes in the Ordovician (Wilson 2006). Silurian millipedes exhibit the earliest direct evidence for air breathing in the form of spiracles (Wilson and Anderson 2004). This geological antiquity has brought Myriapoda to the forefront in considerations of the timing of terrestrialization in animals and plants (Kenrick et al. 2012). Such questions of timing naturally intersect with phylogenetics in the realm of molecular dating. Recent timetrees for myriapods in the context of arthropods as a whole estimate the origin of Myriapoda by the early Cambrian and the divergence of its 4 classes in the late Cambrian (Rota-Stabelli et al. 2013a; Rehm et al. 2014), thus predicting substantial gaps in the early fossil record of the clade.
The open phylogenetic questions about how the main groups of myriapods are related limit how we interpret the timing of the diversification of a major component of the soil arthropod biota. We thus present a large injection of Illumina transcriptome data for myriapods, including previously unsampled millipede orders and a substantially expanded taxonomic coverage for centipedes. Furthermore, we investigate missing data in relation to potential confounding factors in phylogenomic reconstruction (e.g., evolutionary rate, compositional heterogeneity, longbranch attraction (LBA), heterotachy, gene composition, and distance to root) to dissect the individual effect of each factor on the recovered phylogenies. Concurrently, we present a morphological character set for the same set of species as sampled transcriptomically and code a set of key fossil species for their preserved morphological characters in order to place them phylogenetically on the myriapod tree These data sets with a precise placement of the fossils permit divergence times to be better explored for Myriapoda.
MATERIAL AND METHODS
Sample Collection and Molecular Techniques
Twenty-five species representing 3 of the 4 major groups of myriapods (Diplopoda, Chilopoda, and Symphyla) were collected and newly sequenced for this study. Our sampling was designed to maximize representation at the ordinal level in millipedes and at the family level in centipedes. Information on sampling localities and accession numbers in the Sequence Read Archive database for each transcriptome can be found in Table 1 and in the Dryad package for this article. In addition, 8 millipedes (Brewer and Bond 2013), 7 centipedes (6 transcriptomes from Fernández et al. 2014b, and a genome from Chipman et al. 2014) were retrieved from the Sequence Read Archive (SRA). The following taxa were used as outgroups: an onychophoran (Peripatopsis overbergiensis), 2 crustaceans (Calanus finmarchicus and Daphnia pulex), an insect (Drosophila melanogaster), and 6 chelicerates (Limulus polyphemus, Liphistius malayanus, Damon variegatus, Mastigoproctus giganteus, Centruroides vittatus, and Metasiro americanus). In addition, a seventh chelicerate outgroup, Anoplodactylus insignis (Pycnogonida), was newly sequenced for this study. All sequenced cDNA libraries are accessioned in the SRA (Table 1). Tissue preservation and RNA sequencing are as described in Fernández et al. (2014b). All data sets included in this study were sequenced with the Illumina platform. In addition, we retrieved all available sequence data from the pauropod Euripauropus spinosus (Regier et al. 2010) in an attempt to place this group in the myriapod tree. However, only 4 genes (out of the 57 Sanger-sequenced genes) were recovered as orthologs with a minimum of 50% of gene occupancy, and the tree showed low support values (see Supplementary Fig. S1 available on Dryad at http://dx.doi.org/10.5061/dryad.8mp17). These 4 genes, which were annotated by the authors, were identified as elongation factor 1α, elongation factor 2, protein kinase and arginine methyltransferase.
Table 1.
List of specimens sequenced and analyzed in the present study
| Species | Source | MCZ voucher | SRA # |
| Sphendononema guildingii | Illumina HiSeq (this study) | IZ-133578 | SRR3232059 |
| Scutigerina weberi | Illumina HiSeq (this study) | IZ-32088 | SRR3232067 |
| Scutigera coleoptrata | Illumina HiSeq (this study) | IZ-204015 | SRR1158078 |
| Paralamyctes validus | Illumina HiSeq (this study) | IZ-133577 | SRR3232621 |
| Anopsobius giribeti | Illumina HiSeq (this study) | IZ-35360 | SRR3232683 |
| Lithobius forficatus | Illumina HiSeq (Fernández et al. 2014b) | IZ-131534 | SRR1159752 |
| Eupolybothrus cavernicolus | Illumina (Stoev et al. 2013) | ERX311347 | |
| Craterostigmus tasmanianus | Illumina HiSeq (Fernández et al. 2014b) | IZ-128299 | SRR1157986 |
| Craterostigmus crabilli | Illumina HiSeq (this study) | IZ-71256 | SRR3232915 |
| Cryptops hortensis | Illumina HiSeq (Fernández et al. 2014b) | IZ-130583 | SRR1153457 |
| Theatops spinicaudus | Illumina HiSeq (this study) | IZ-46873 | SRR3458602 |
| Newportia adisi | Illumina HiSeq (this study) | IZ-130770 | SRR3233034 |
| Scolopocryptops sexspinosus | Illumina HiSeq (this study) | IZ-44070 | SRR3233108 |
| Akymnopellis chilensis | Illumina HiSeq (this study) | IZ-30385 | SRR3233156 |
| Scolopendropsis bahiensis | Illumina HiSeq (this study) | IZ-32736 | SRR3458603 |
| Alipes grandidieri | Illumina HiSeq (Fernández et al. 2014b) | IZ-130616 | SRR619311 |
| Rhysida longipes | Illumina HiSeq (this study) | IZ-30386 | SRR3233167 |
| Tygarrup javanicus | Illumina HiSeq (this study) | IZ-133573 | SRR3233201 |
| Mecistocephalus guildingii | Illumina HiSeq (this study) | IZ-133576 | SRR3233206 |
| Notiphilides grandis | Illumina HiSeq (this study) | IZ-133579 | SRR3458605 |
| Himantarium gabrielis | Illumina HiSeq (Fernández et al. 2014b) | IZ-131564 | SRR1159787 |
| Hydroschendyla submarina | Illumina HiSeq (this study) | IZ-32096 | SRR3233203 |
| Stenotaenia linearis | Illumina HiSeq (this study) | IZ-133575 | SRR3233208 |
| Henia brevis | Illumina HiSeq (this study) | IZ-133574 | SRR3458639 |
| Strigamia maritima | Genome available | ||
| Eudigraphis taiwaniensis | Illumina HiSeq (this study) | IZ-128912 | SRR3458640 |
| Glomeris marginata | Illumina HiSeq (this study) | IZ-43690 | SRR3233211 |
| Cyliosoma sp. | Illumina HiSeq (this study) | IZ-44064 | SRR3458641 |
| Glomeridesmus sp. | Illumina (Brewer & Bond, 2013) | SRX326775 | |
| Prostemmiulus sp. | Illumina (Brewer & Bond, 2013) | SRX326782 | |
| Pseudopolydesmus sp. | Illumina (Brewer & Bond, 2013) | SRX326779 | |
| Petaserpes sp. | Illumina (Brewer & Bond, 2013) | SRX326777 | |
| Brachycybe lecontii | Illumina (Brewer & Bond, 2013) | SRX326776 | |
| Abacion magnum | Illumina (Brewer & Bond, 2013) | SRX326781 | |
| Cleidogona sp. | Illumina (Brewer & Bond, 2013) | SRX326780 | |
| Cambala annulata | Illumina (Brewer & Bond, 2013) | SRX326783 | |
| Cylindroiulus punctatus | Illumina HiSeq (this study) | IZ-43724 | SRR3458645 |
| Narceus americanus | Illumina HiSeq (this study) | IZ-44069 | SRR3233222 |
| Hanseniella sp. | Illumina HiSeq (this study) | IZ-133580 | SRR3458649 |
| Scutigerella sp. | Illumina HiSeq (this study) | IZ-46890 | SRR3458649 |
| Outgroups | |||
| Peripatopsis overbergiensis | Sharma et al. (2014) | ||
| Anoplodactylus insignis | Illumina HiSeq (this study) | IZ-134527 | |
| Damon variegatus | Sharma et al. (2014) | ||
| Liphistius malayanus | Sharma et al. (2014) | ||
| Mastigoproctus giganteus | Sharma et al. (2014) | ||
| Metasiro americanus | Sharma et al. (2014) | ||
| Centruroides vittatus | Sharma et al. (2014) | ||
| Limulus polyphemus | Sharma et al. (2014) | ||
| Daphnia pulex | Genome | ||
| Calanus finmarchicus | Lenz et al. (2014) | ||
| Drosophila melanogaster | Genome |
Notes: Catalogue numbers in the Museum of Comparative Zoology (MCZ) and SRA accession numbers are shown. For further details about collection site, BioProject and BioSample accession numbers and links to the MCZ database please see the Dryad package associated to this manuscript.
Data Sanitation, Sequence Assembly and Orthology Assignment
De-multiplexed Illumina HiSeq 2500 sequencing results, in FASTQ format, were retrieved from the sequencing facility via File Transfer Protocol (FTP). Sequenced results were quality filtered accordingly to a threshold average quality Phred score of 30 and adaptors trimmed using Trimgalore v 0.3.3 (Wu et al. 2011). Ribosomal RNA (rRNA) was filtered out. All known metazoan rRNA sequences were downloaded from GenBank and formatted into a bowtie index using “bowtie-build”. Each sample was sequentially aligned to the index allowing up to 2 mismatches via Bowtie 1.0.0 (Langmead et al. 2009). Strand-specific de novo assemblies were done individually for each specimen in Trinity (Haas et al. 2013) with a path reinforcement distance of 75. The path reinforcement distance is the minimum read overlap required for path extension in the De Bruijn graph in the Trinity assembly. Higher values reduce the probability of constructing chimeric contigs. In our case, the read length for all the transcriptomes newly sequenced for this study was 150 base pairs, meaning that 50% of a read should overlap with the next one to continue with the contig extension during the assembly. Redundancy reduction was done with CD-HIT (Fu et al. 2012) in the raw assemblies (95% similarity). Resulting assemblies were processed in TransDecoder (Haas et al. 2013) in order to identify candidate open reading frames (ORFs) within the transcripts. Predicted peptides were then processed with a further filter to select only one peptide per putative unigene, by choosing the longest ORF per Trinity subcomponent with a python script (“choose_longest_v3.py”, http://github//rfernandezgarcia//phylogenomics), thus removing the variation in the coding regions of our assemblies due to alternative splicing, closely related paralogs, and allelic diversity. Peptide sequences with all final candidate ORFs were retained as multifasta files.
We assigned predicted ORFs into orthologous groups across all samples using the Orthologous Matrix algorithm, OMA stand-alone v0.99z (Altenhoff et al. 2011; Altenhoff et al. 2013), which has been shown to outperform alternative approaches (such as reciprocal best hit) in identifying true orthologs and minimizing Type I error in orthology assignment (Altenhoff and Dessimoz 2009).
Phylogenomic Analyses and Congruence Assessment
In order to explore the trade-off between number of genes and matrix completeness, 3 supermatrices were constructed by varying gene occupancy thresholds: supermatrix I (with each gene having a minimum of 50% occupancy [>50% occupancy], 2131 genes, 638,722 amino acids), supermatrix II (>75% gene occupancy, 789 genes, 104,535 amino acids), and supermatrix III (>90% gene occupancy, 123 genes, 27,217 amino acids). We also constructed 2 additional matrices (supermatrix IV, 40 genes, 12,348 amino acids [totaling 87% gene occupancy], and supermatrix V, 62 genes, 16,324 amino acids [87.4% gene occupancy]) from subsets of supermatrix III, by excluding genes with the lowest phylogenetic informativeness (Townsend 2007; López-Giráldez et al. 2013). For this purpose, we analyzed the signal-to-noise distribution of the 123 genes of supermatrix III using the method described in Townsend et al. (2012) as implemented in the PhyDesign web server. This method estimates the state space and the evolutionary rates of characters to approximate the probability of phylogenetic signal versus noise due to convergence or parallelism. At every site, based on the rate of character evolution and the character state space, phylogenetic signal is characterized by the probability of observing a parsimony informative synapomorphic site pattern at the leaves of the taxa, whereas phylogenetic noise is characterized by the probability distribution function over time for homoplastic site patterns that mimic the correct pattern and mislead analyses. In this context, to construct supermatrices IV and V, we selected the orthogroups in which the signal was higher than the noise for the shortest internodes and the longest branches in our data set (t=10, T =455), given an ultrametric tree generated by node calibration as described below in this section. Supermatrix IV included the 40 genes with the highest values of phylogenetic informativeness (see Supplementary Fig. S2, available on Dryad). Likewise, to construct supermatrix V, we included only the genes in the 2 upper quartiles in their ranking of phylogenetic informativeness (62 orthologs).
To account for the effect of evolutionary rate, we ordered the orthogroups in supermatrix I based on their increasing rate and selected the 100 most conserved genes (supermatrix VI; 60.3–99.3% of conserved sites, 70% gene occupancy; 29,039 amino acids), the 100 genes with a variation close to the mean (supermatrix VII; 21–23.8% of conserved sites; 61% gene occupancy, 30,585 amino acids), and the 100 most variable genes (supermatrix VIII, 0.9–6.3% of conserved sites; 43.6% gene occupancy, 25,666 amino acids). Similar criteria have been applied to construct matrices for exploratory purposes in other phylogenomic analyses (e.g., Fernández et al. 2014a; Andrade et al. 2015).
To further assess the causes of inconsistency between conflicting phylogenies (see Results), we evaluated gene composition of supermatrices I, II, III, VI, VII, and VIII by means of a BLAST comparison with the non-redundant database of NCBI. Significant hits were considered when the e-value was lower than e−10. Only supermatrix III showed signs of non-heterogeneous gene composition (measured as gene putative function), with 40 genes corresponding to ribosomal proteins. Two multigene submatrices were then constructed with identical taxon sampling, relatively comparable lengths and missing data percentages but different gene content (analogous to the analyses of Nosenko et al. 2013): supermatrix IX, containing 40 ribosomal protein genes, and supermatrix X, including the remaining 83 non-ribosomal protein genes. Finally, to assess if incorrect estimates of ingroup relationships were due to the inclusion of highly divergent outgroups, non-pancrustacean outgroups were removed from supermatrices III, IV, VI, VII, VIII, IX, and X, and these submatrices were re-analyzed separately.
The selected orthogroups in supermatrices I, II, and III were aligned individually using MUSCLE version 3.6 (Edgar 2004). We then applied a probabilistic character masking with ZORRO (Wu et al. 2012) to account for alignment uncertainty, using default parameters. ZORRO assigns confidence scores ranging from 1 to 10 to each alignment site using a pair hidden Markov model (pHMM) framework. We discarded the positions assigned a confidence score below a threshold of 5 with a custom python script (“cut_zorro.py”). These steps were not necessary in the remaining matrices as they were derived from supermatrices I and III. The aligned, masked orthogroups were then concatenated using Phyutility 2.6 (Smith and Dunn 2008).
Maximum likelihood inference was conducted with PhyML-PCMA (Zoller and Schneider 2013) with 20 nodes, and with ExaML (Aberer and Stamatakis 2013) using the per-site rate (PSR) category model. In order to further test for the effect of heterotachy and heterogeneous substitution rates, we also analyzed some of the matrices in PhyML v.3.0.3 implementing the integrated length (IL) approach (Guindon and Gascuel 2003; Guindon 2013). In this analysis, the starting tree was set to the optimal parsimony tree and the FreeRate model (Soubrier et al. 2012) was selected. Bayesian analyses were conducted with ExaBayes (Stamatakis 2014a) and PhyloBayes MPI 1.4e (Lartillot et al. 2013), selecting in this last analysis the site-heterogeneous CAT-GTR model of amino acid substitution (Lartillot and Philippe 2004). Two independent Markov chain Monte Carlo (MCMC) chains were run for 5000– 10,000 cycles. The initial 25% of trees sampled in each MCMC run prior to convergence (judged when maximum bipartition discrepancies across chains were <0.1) were discarded as the burn-in period. Convergence of chains was assessed both at the level of the bipartition frequencies (with the command bpcomp) and the summary variables displayed in the trace files (with the command tracecomp). Convergence was considered when (i) the maximum difference of the frequency of all the bipartitions observed in the chains is <0.1, and (ii) when the maximum discrepancy observed for each column of the trace file was <0.1 and the minimum effective size of 100. A 50% majority-rule consensus tree was then computed from the remaining trees. For practical reasons and due to the similar results obtained for the different phylogenetic analysis (see Results and Discussion), not all the analyses were implemented in all the supermatrices but at least 1 ML and 1 Bayesian inference analysis per supermatrix were explored (Fig. 2).
Figure 2.
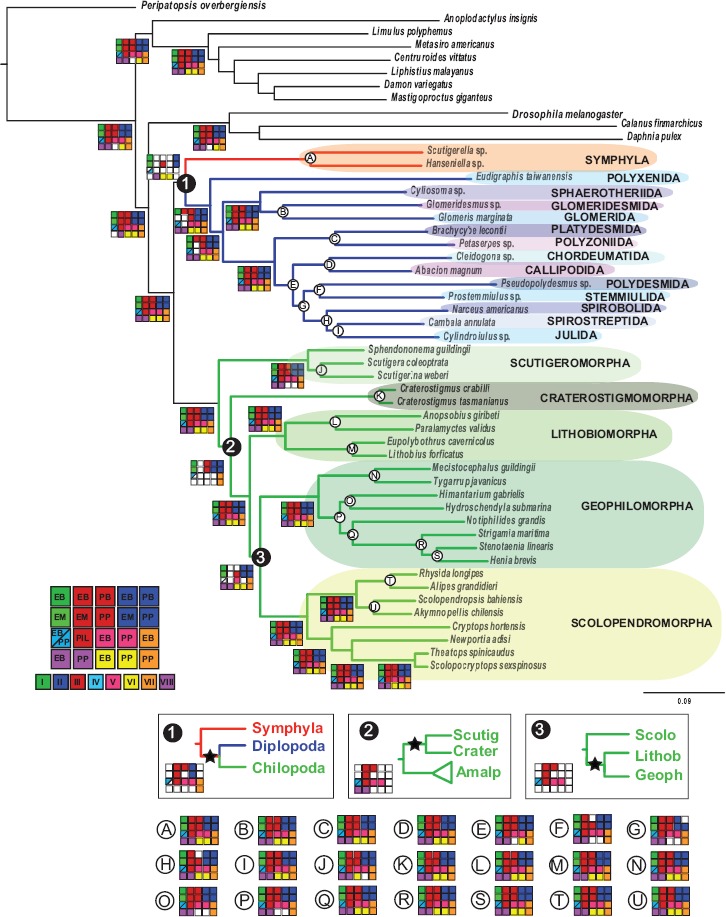
Summary of analyses of myriapod relationships. Depicted topology is the maximum likelihood hypothesis of supermatrix I (ExaML LnL=−15764355.248567). Checked matrices in each node represent high nodal support for the different analyses in supermatrices I–VIII (see Material and Methods for further information). Each matrix is represented by a different color, following the legend of the figure. The abbreviation of the analyses in each matrix is as follows: PP, PhyML-PCMA; EM, ExaML; PB, PhyloBayes; EB, ExaBayes; and PIL, ML analysis with integrated branch length as implemented in PhyML. Filled squares indicate nodal support values higher than 0.95/ 0.90/95 (posterior probability, PB and EB/Shimodaira–Hasegawa-like support, PP/bootstrap, EM, and PIL). White squares indicate lower nodal support; visually, every matrix filled with color indicates that all analyses support that node. Nodal support for the clades represented with letters A–U, and the alternative topologies to the 3 conflicting nodes (named 1, 2, and 3) are shown.
To discern whether compositional heterogeneity among taxa and/or within each individual ortholog alignment was affecting the phylogenetic results, we further analyzed matrices I and II in BaCoCa v.1.1 (Kück and Struck 2014). The relative composition frequency variability (RCFV) measures the absolute deviation from the mean for each amino acid for each taxon It is calculated as the summation of the difference between the frequency of each amino acid in a specific taxon and the mean frequency of that amino acid over all taxa, and divided by the total number of taxa (Zhong et al. 2011). The higher the RCFV value, the more the amino acid composition of an individual sequence differs from the overall trend in a data set. We considered this metric to be small when its value is >0.1. RCFV values were plotted in a heatmap using the R package gplots with an R script modified from Kück and Struck (2014).
To investigate potential incongruence among individual gene trees, we inferred gene trees for each OMA group included in supermatrices I, II, and III (Fernández et al. 2014a; Fernández et al. 2014b; Laumer et al. 2015). Best-scoring ML gene trees were inferred via 100 replicates in RAxML 8.1.3 (Stamatakis 2014b) under the best-fitting model of sequence evolution selected using a ProteinModelSelection script as implemented in RAxML. Gene trees were decomposed into quartets with SuperQ v.1.1 (Grünewald et al. 2013), and a supernetwork assigning edge lengths based on quartet frequencies was inferred selecting the “balanced” edge-weight optimization function, applying no filter; the supernetworks were visualized in SplitsTree v.4.13.1 (Huson and Bryant 2006). All Python custom scripts can be downloaded from https://github.com/rfernandezgarcia/phylogenomics.
As our data set includes several ancient lineages (in the order of several hundreds of Ma) with a low diversity of extant species, we further evaluated the potential effect of long branch attraction (LBA) in 3 lineages that show less extant diversity than their extant closest relatives: Craterostigmomorpha, Scutigeromorpha, and Polyxenida. Previous morphological and molecular analyses have recovered Scutigeromorpha as the sister group to all other centipede orders (e.g., Shear and Bonamo 1988; Borucki 1996; Giribet et al. 1999; Edgecombe and Giribet 2004; Murienne et al. 2010; Fernández et al. 2014b). The order comprises 3 families and a total of ca. 95 species. More striking is the case of Craterostigmomorpha, with only 2 extant species (see Results and Discussion). These 2 orders originated more than 400 Ma (Murienne et al. 2010; Fernández et al. 2014b), thus exhibiting very long branches prior to their respective diversification. In millipedes, the order Polyxenida includes only 89 species, and it is universally recognized as sister group to the rest of Diplopoda. As the earliest diverging lineages of both centipedes and millipedes involve long branches, we also explored the effect of LBA in a fourth lineage with long branches and poor taxon representation, Symphyla, which was recovered as sister group to Polyxenida in some of our analyses (see Results and Discussion). To determine whether or not LBA was affecting tree topology, we applied the SAW method, named for Siddall and Whiting (1999). This method is based on the removal of taxa in a pair suspected to be affected by LBA, one at a time. If after re-running the analysis either of the taxa appears at different branch points in the absence of the other, LBA is postulated. To understand the potential effect of LBA in our data set between (i) Symphyla and Polyxenida, and (ii) Scutigeromorpha and Craterostigmomorpha, we pruned 1 taxon at a time in each case from the most complete matrix, supermatrix III (123 genes), and re-ran ExaBayes and PhyML_PCMA, as described above.
As rogue taxa can frequently have a negative impact on topology or in a bootstrap analysis (see a review in Goloboff and Szumik 2015), we also explored the presence of putative wild card taxa in our data set with RogueNaRok (Aberer et al. 2013), with the aim of identifying a set of taxa that, if pruned from the underlying bootstrap trees, yielded a reduced consensus tree containing additional bipartitions or increased support values.
Supermatrices III, VI, VII, and VIII were further analyzed under a multispecies coalescent model. Individual gene trees were run in RAxML 8.1.3 (Stamatakis 2014b) for each gene in each matrix. The best-fitting model in each case was selected using a custom script modified to permit testing of LG4M and LG4X models (Le et al. 2012). Best-scoring ML trees were inferred for each gene under the selected model from 100 replicates of parsimony starting trees. One hundred bootstrap replicates for each gene were also inferred. The best-scoring ML trees and the bootstrap replicates were used as input files for ASTRAL (Mirarab et al. 2015), which estimates an unrooted species tree given a set of unrooted gene trees under a multispecies coalescent model. ASTRAL estimates the species tree that has the maximum number of shared induced quartet trees with the given set of gene trees.
Morphological Data
Morphological characters for the set of species for which transcriptomes were available or newly generated were coded, principally drawing on existing data sets. These include characters bearing on myriapod phylogeny (Rota-Stabelli et al. 2011), higherlevel chilopod phylogeny (Edgecombe and Giribet 2004; Murienne et al. 2010), diplopod phylogeny (Blanke and Wesener 2014), scutigeromorphs (Edgecombe and Giribet 2006; Koch and Edgecombe 2006), scolopendromorphs (Vahtera et al. 2013), and geophilomorphs (Koch and Edgecombe 2012; Bonato et al. 2014a). The objective of analyzing the morphological data set was to establish the systematic position of fossils used for calibration. As such, node calibration is based on hypotheses that are consistent with the precise taxonomic sampling used for molecular analyses (e.g., Sharma and Giribet 2014), rather than relying on a series of reference phylogenies that may not be compatible with each other. Sources for morphological information used for coding fossil terminals are detailed in Supplementary Material. The data set is available in nexus format as Morphobank Project P2216, “The myriapod tree of life” (www.morphobank.org/index.php/MyProjects/List/select/project_id/2216).
The morphology data set consists of 232 characters, of which characters 57, 72, 86, 101, and 109 were scored as ordered/additive. These data were analyzed using equally weighted parsimony and implied weighting (Goloboff 1993) in TNT (Goloboff et al. 2008) Heuristic searches used 10,000 random stepwise addition sequences saving 100 trees per replicate, with tree bisection and reconnection branch swapping. Fossil calibrations used only nodes that are robust to both equal and implied character weights using the same traditional search settings as for equal weights, varying the concavity constant across the range k = 2, 3, 4, 5, 6, 7, and 8.
Divergence time inference
In order to infer divergence time in the myriapod phylogeny, we included 7 Palaeozoic and Mesozoic fossils in our data set: 4 centipedes (Crussolum sp., Devonobius delta, Mazoscolopendra richardsoni, and Kachinophilus pereirai) and 3 millipedes (Cowiedesmus eroticopodus, Archidesmus macnicoli, and Gaspestria genselorum). In addition, we included 2 outgroup fossils, a crustacean (Rehbachiella kinnekullensis), and a scorpion (Proscorpius osborni). Absolute dates follow the International Chronostratigraphic Chart v 2015/01 Justifications for age assignments of the fossils (summarized in Table 2) are outlined in full in Supplementary Material.
Table 2.
Fossils used for calibration and minimum age (in millions of years) employed for dating the respective crown groups
| Dated crown group | Calibration fossil | Minimum age(Ma) |
| Arachnopulmonata | Proscorpius obsorni | 419.2 |
| Altocrustacea | Rehbachiella kinnekullensis | 497 |
| Diplopoda: Chilognatha | Cowiedesmus eroticopodus | 425.6 |
| Chilopoda | Crussolum sp. | 407.6 |
| Chilopoda: Pleurostigmophora | Devonobius delta | 382.7 |
| Chilopoda: Epimorpha | Mazoscolopendra richardsoni | 307.0 |
| Chilopoda: Adesmata | Kachinophilus pereirai | 98.79 |
Temporal data for the fossils listed above provide constraints on divergence dates. The resolution of Crussolum as stem-group Scutigeromorpha in our morphological cladogram (Fig. 3; Supplementary Fig. S3 available on Dryad) constrains the split of Scutigeromorpha and Pleurostigmophora, i.e., crown-group Chilopoda, to at least 407.6 Ma. Devonobius delta is resolved in our equal weights morphological analysis as sister group of Epimorpha—the putative clade comprising the orders Scolopendromorpha and Geophilomorpha—but an alternative affinity to Craterostigmus has been suggested (Borucki 1996) and is recovered in some analyses of our data set under implied weights (concavity constant k = 4−8). To allow for uncertainty over the phylogenetic position of Devonobius and Craterostigmus, the former was conservatively used only to constrain crown-group Pleurostigmophora (minimum of 382.7 Ma based on Devonobius). Crown-group Epimorpha is constrained to a minimum of 307.0 Ma by the oldest scolopendromorph Mazoscolopendra richardsoni. That species is resolved as total-group Scolopendromorpha based on our morphological analysis (Supplementary Fig. S3 available on Dryad). Kachinophilus pereirai, originally assigned to Geophilidae (Bonato et al. 2014b), is resolved based on morphology in a clade with extant geophilids (Supplementary Fig. S3 available on Dryad). As such, it constrains crown-group Adesmata, i.e., the split between Mecistocephalidae and remaining Geophilomorpha, to at least 98.79 Ma. Crown-group Chilognatha is constrained by the occurrence of Cowiedesmus eroticopodus, resolved in our morphological analysis as total-group Helminthomorpha (425.6 Ma). Because the younger (Early Devonian) millipedes Gaspestria and Archidesmus are in a polytomy with Cowiedesmus within Helminthomorpha (Supplementary Fig. S3 available on Dryad), they do not unambiguously contribute to calibrate additional nodes. Rehbachiella kinnekullensis has been interpreted as stem-group Anostraca, i.e., crown-group Branchiopoda (Waloszek 1993), or as stem-group Branchiopoda (Olesen 2009). Our morphological data agree with either of these in resolving it as more closely related to Daphnia than to Calanus. This provides a minimum date for crown-group Altocrustacea (sensu Regier et al. 2010) to 497 Ma. Because of uncertainty with regards to the interrelationships between major pancrustacean groups (including Branchiopoda, Copepoda and Insecta, from which the 3 exemplars used here were sampled) this date is conservatively applied only to crown-group Pancrustacea. Proscorpius osborni is resolved by our morphological data data set as closest relative of the extant scorpion exemplar Centruroides, setting a constraint on the split of Scorpiones from Tetrapulmonata. The relevant crown-group based on our taxon sampling is Arachnopulmonata, dated to at least 419.2 Ma.
Figure 3.
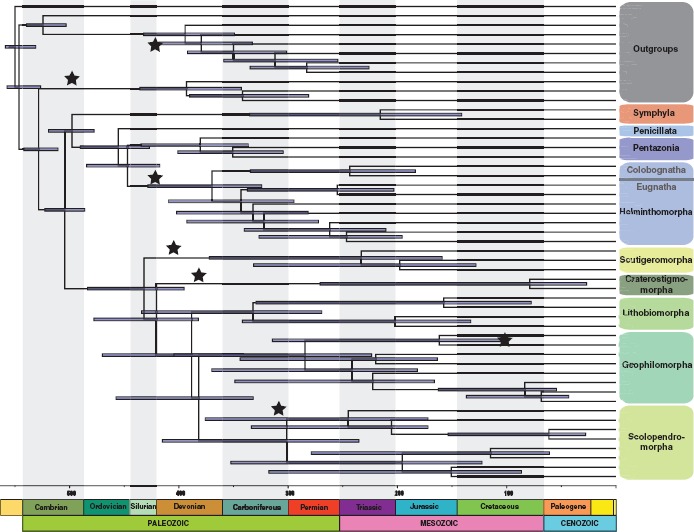
Chronogram of myriapod evolution for Supermatrix III (123-gene data set) with 95% highest posterior density (HPD) bar for the dating under the uncorrelated gamma model. Nodes that were calibrated with fossils are indicated with a star placed at the age of the fossil.
The split between Onychophora and Arthropoda was dated between 528 million years (the minimum age for Arthropoda used by Lee et al. (2013) on the basis of the earliest Rusophycus traces in the early Fortunian, dating the base of Cambrian Stage 2) and 558 million years. The latter was used as the root of Panarthropoda (Lee et al. 2013) based on dating of White Sea Vendian strata that contain the oldest plausible bilaterian fossils.
Divergence dates were estimated using the Bayesian relaxed molecular clock approach as implemented in PhyloBayes v.3.3f (Lartillot et al. 2013). An auto-correlated relaxed clock model was applied as it has been shown to provide a significantly better fit than uncorrelated models on phylogenomic data sets (Lepage et al. 2007; Rehm et al. 2011). The calibration constraints specified above were used with soft bounds (Yang and Rannala 2006) under a birth-death prior in PhyloBayes, this strategy having been found to provide the best compromise for dating estimates (Inoue et al. 2010). Two independent MCMC chains were run for 5000– 7,000 cycles, sampling posterior rates and dates every 10 cycles. The initial 25% were discarded as burn-in. Posterior estimates of divergence dates were then computed from the remaining samples of each chain. We unsuccessfully tested 2 different software tools for total evidence dating analysis with supermatrix III (123 gene-matrix): the fossilized birth–death model (Heath et al. 2014) as implemented in BEAST v2.2.0 (Drummond and Bouckaert 2014) and MrBayes v3.2.6 (Ronquist and Huelsenbeck 2003). The chains did not reach convergence, despite multiple trials with different parameters.
RESULTS AND DISCUSSION
Source of Systematic Error and Conflicting Phylogenetic Relationships of Myriapoda
All analyses conducted, regardless of methodology or data set, recover monophyly of Myriapoda, Diplopoda, Chilopoda, and Symphyla, but the interrelationships among the myriapod classes are less stable (Fig. 2). With regards to the position of Symphyla, 2 alternatives are found: Symphyla either unites with Diplopoda as predicted by the Progoneata hypothesis (morphological evidence discussed by Dohle (1980); Edgecombe 2004, 2011) or Chilopoda and Diplopoda unite as a clade to the exclusion of Symphyla. The latter result was also found in many of the analyses by Rehm et al. (2014). In the analyses designed to account for LBA, such as the SAW analysis (Supplementary Fig. S4 available on Dryad) with Polyxenida removed, as well as the PhyloBayes analysis with the CAT-GTR model, Symphyla was sister group to Diplopoda + Chilopoda, suggesting that Symphyla could have been attracted to Diplopoda due to the long branch of Polyxenida. In addition, analyses of supermatrices IX and X (including ribosomal and non-ribosomal genes from supermatrix III, respectively) suggest that the grouping of Symphyla and Diplopoda is driven by the ribosomal proteins: the ML analysis of supermatrix IX recovered Symphyla as sister group to Pancrustacea (Supplementary Fig. S5a, available on Dryad), which is obviously artifactual. On the contrary, the ML hypothesis of supermatrix X (i.e., nonribosomal genes) placed Symphyla as sister group to Diplopoda + Chilopoda (Supplementary Fig. S5b, c, d available on Dryad). A second factor influencing the positioning of Symphyla is rooting. When supermatrices IX and X were analyzed only with pancrustacean outgroups, all the analyses resulted in Symphyla being the sister group of Diplopoda + Chilopoda, suggesting that a gene composition rich in ribosomal proteins plus rooting with distant outgroups can act in concert to influence phylogenetic relationships within the ingroup. The sister group relationship of Diplopoda and Chilopoda is reinforced by (i) the low percentage of ribosomal proteins detected in supermatrices II, III, VI, VII, and VIII through a BLAST search (13.66%, 4.36%, 7%, 0% and 5%, respectively), and (ii) the elimination of the most distant (i.e., non-pancrustacean) outgroups in supermatrices III, IV, V, VII and VIII, which all recovered Symphyla as sister group to the other 2 myriapod classes (Supplementary Fig. S6 available on Dryad). The multispecies coalescence analysis of most supermatrices (III, VII and VIII) recovered Symphyla as sister group to Diplopoda + Chilopoda as well (Supplementary Fig. S7 available on Dryad). Rogue taxa did not appear to influence this result, none being detected by RogueNaRok.
A chilopod–diplopod clade has not been anticipated morphologically, though certain morphological characters fit such a grouping. For example, chilopods and diplopods share a series of imbricated comb lamellae on the mandibles that are lacking in symphylans and pauropods (Edgecombe and Giribet 2002). This character was proposed as a potential myriapod autapomorphy but the standard phylogenetic hypotheses forced reversals/losses in pauropods and symphylans. Under 1 of our 2 scenarios, although in the absence of pauropods, this character would be interpreted as a synapomorphy of Chilopoda + Diplopoda.
A second conflicting area concerns the relationships among the 5 orders of centipedes. Half of the analyses retrieved the widely accepted division of Chilopoda into Notostigmophora (Scutigeromorpha) and Pleurostigmophora (the other 4 orders). However, in the other half, Scutigeromorpha and Craterostigmomorpha were recovered as a clade. The latter result has never been advocated morphologically. Both clades are almost invariantly at the base of the tree, as recovered in all the SAW analyses (Supplementary Fig. S4 available on Dryad). However, their interrelationships remain unresolved. A possible cause of this phylogenetic conundrum could be the low diversity of Craterostigmomorpha, which comprises only 2 extant species, and the long branch to the origin of the clade. Within Pleurostigmophora, the Amalpighiata hypothesis (Craterostigmus sister group of all other pleurostigmophorans; Fernández et al. 2014b) withstood all procedures designed to target systematic error, such as increased gene sampling and the exploration of complex evolutionary models, and was favored over the Phylactometria hypothesis (Lithobiomorpha sister group to all other pleurostigmophorans; Edgecombe and Giribet 2004). The only analysis to support Phylactometria was the Phylobayes analysis of matrix VIII with only pancrustacean outgroups (Supplementary Fig. S6E available on Dryad). The relationship between Lithobiomorpha and the 2 orders of Epimorpha present 2 alternatives, with several analyses recovering Scolopendromorpha as sister group to Lithobiomorpha + Geophilomorha, defying nearly all previous morphological and molecular evidence for Epimorpha. Notably, all the matrices recovering Lithobiomorpha + Geophilomorpha are the smallest matrices (supermatrices III–V), designed to maximize gene occupancy (see below for further details).
By exploring different data matrices with different occupancy, we were able to identify potential discordance between some of our matrices, which led to some of the additional analyses removing distant outgroups and identifying the type of proteins that went into these matrices. These results are difficult to disentangle from the problem of missing data, inversely correlated to gene occupancy. Assessing the effect of missing data on phylogenetic inference has received substantial attention from phylogeneticists over many years (e.g., Maddison 1993; Norell et al. 1995; Norell and Wheeler 2003; Wiens 2003; Simmons 2012), but unambiguous conclusions remain elusive. Properties of the data sets themselves, such as different rates of evolution and compositional heterogeneity, can have a strong influence on the accuracy of phylogenetic inference, irrespective of the amount or the pattern of missing data, whereas for many phylogenomic data sets large amounts of missing data have not been a major problem. The combined effect of these factors complicates the problem, and no study has dissected out in depth the effect of each parameter independently. The different matrices constructed and the multitude of analyses conducted to address the potential effects of missing data, compositional heterogeneity, heterotachy, differential evolutionary rate, levels of phylogenetic informativeness, model misspecification, concatenation, gene-tree incongruence, gene composition and rooting issues yield largely congruent results (see Fig. 2, Supplementary Fig. S2, S3, S8, S9, available on Dryad). The main 3 conflicting nodes (marked as 1, 2, and 3 in Fig. 2) are recovered in approximately half of the analyses, indicating that these artifactual/methodological explanations for the incongruence alone are unlikely to have driven the recovered topologies. The hypotheses most strongly supported by the current data set, after considering all these analyses are summarized in Figure 4.
Figure 4.
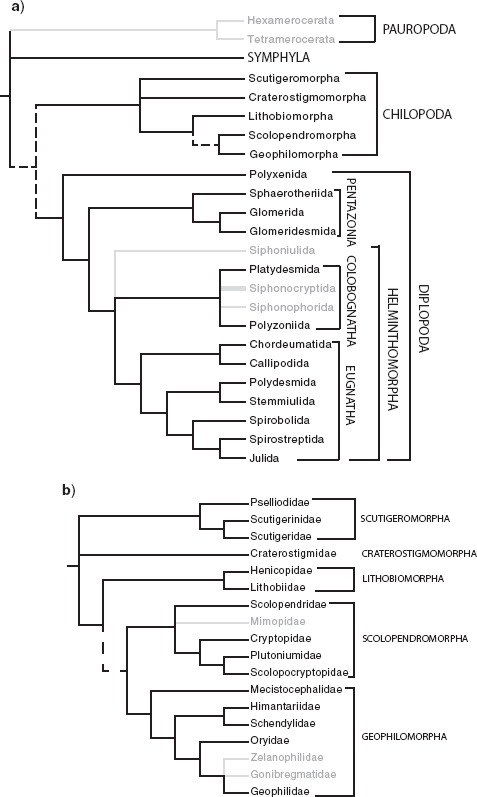
Schematic summary of the interrelationships within Myriapoda based on a diversity of phylogenomic analyses. Lineages presently lacking transcriptomes shown in light color (their placement is based on published data sets from morphology or targeted sequencing). Dashed lines indicate conflict between analyses. a) Relationships of classes and orders of Myriapoda. b) Relationships of orders and families of Chilopoda.
The potential impact of missing data on phylogenomic inference has been poorly investigated, particularly for higher-level (=deep and old) relationships, but gene completeness has often been advocated as a major justification for selecting genes. This has sometimes been used to favor target-enrichment approaches to phylogeny versus “phylotranscriptomics” (e.g., Lemmon and Lemmon 2013). Recent studies on the effects of missing data in phylogenetic reconstruction have focused on data sets with hundreds or thousands of orthologous genes (e.g., Rokas et al. 2003; Philippe et al. 2004; Roure et al. 2013). Missing data may reduce detection of multiple substitutions, exacerbating systematic errors such as LBA, as incomplete species are less efficient in breaking long branches (Roure et al. 2013). Perhaps for this reason other studies have shown that adding incomplete taxa is not deleterious per se as long as enough informative character states are present for each species, but analyzing too few complete characters could reduce accuracy because of a lack of phylogenetic signal (Wiens 2003, 2006; Philippe et al. 2004; Lemmon et al. 2009). In this study, we show that high matrix occupancy, in some specific cases, can lead to anomalous inferences: all the different analyses conducted with the most complete matrix (supermatrix III) or supermatrices derived from it (IV and V) resulted in a topology of centipedes at odds with well-established phylogenetic hypotheses and with nearly all other analyses using more genes or selecting genes based on other criteria (informativeness, compositional homogeneity, non-ribosomal proteins, etc.), and curiously it was the matrix that showed the highest level of conflict between individual gene trees (Supplementary Fig. S7 and S9 available on Dryad), probably due to its high percentage of ribosomal proteins (32%). Reasons for this may lay in the high expression level of these genes, which therefore are differentially selected when using transcriptomes for phylogenomic analyses even though they are not necessarily the genes with the highest phylogenetic informativeness. Also, evidence indicates that most or all ribosomal proteins are encoded by two or more highly similar gene family members at least in plants: in Arabidopsis thaliana, 249 genes encode 80 ribosomal proteins, thus a number of paralogous genes encode the same protein (Barakat et al. 2001; Chang et al. 2005). This high number of paralogs per protein may complicate the retrieval of “true orthologs” using current orthology inference software. Our finding that matrices with low levels of missing data show high levels of intragene conflict and yield unusual tree topologies that conflict with trees based on other data sets may have profound implications for the experimental design of phylogenomic data sets.
The conflicting nodes between centipede orders are unlikely to result from incomplete taxon sampling, as our data set includes all extant families of centipedes with the exception of 2 geophilomorph families (Zelanophilidae and Gonibregmatidae) and 1 monotypic family of Scolopendromorpha (Mimopidae). In this context, biological explanations for the incongruence, such as incomplete lineage sorting consistent with a scenario of rapid radiation, or lineage-specific high extinction, may need to be considered. In fact, Craterostigmomorpha, the taxon responsible for some of the major instability, comprises only 2 species in Tasmania and New Zealand, constituting an old lineage with depauperate extant diversity and conservative morphology, some of the conditions often used to refer to living fossils (Werth and Shear 2014).
Systematic Implications of Other Phylogenetic Relationships
The 4-gene analysis including the sequences available for a pauropod recovered Pauropoda as sister group to Symphyla with a posterior probability of 0.99. However, the relationships with the other myriapod groups remained unsupported, and the pauropod-symphylan group (= Edafopoda) is observed to be associated with anomalous relationships between orders of both Chilopoda and Diplopoda (Supplementary Fig. S1 available on Dryad). Within Diplopoda, most analyses (but see Supplementary Fig. S5 and S6 available on Dryad) support a sister group relationship between Penicillata (sampled by Eudigraphis) and all other millipedes, the latter forming the traditional clade Chilognatha, although a few analyses placed Penicillata/Polyxenida as sister group to Pentazonia (e.g., Supplementary Fig. S5 and S6 available on Dryad). Chilognatha is united by a calcified cuticle and the male actively transferring sperm to the female genital opening, among other apomorphic characters (Enghoff 1984; Blanke and Wesener 2014). The fundamental division within Chilognatha likewise corresponds to traditional morphology-based systematics, including a sister group relationship between Pentazonia (generally pill millipedes) and Helminthomorpha (long-bodied millipedes).
Relationships within Pentazonia depart from the standard morphological hypothesis. The latter unites Glomerida and Sphaerotheriida in a clade named Oniscomorpha. In contrast to this, however, nearly all of our analyses resolve Sphaerotheriida (Cyliosoma) as sister group to Glomerida (Glomeris) + Glomeridesmida (Glomeridesmus; but see Supplementary Fig. S5a, b available on Dryad). The only previous molecular studies to include all 3 orders of Pentazonia are the 3-gene analysis of Regier et al. (2005) and the same data set combined with morphological data by Sierwald and Bond (2007). As in our analyses, these yielded an “unexpected” (Regier et al. 2005, p. 155) grouping of Glomeridesmida and Glomerida to the exclusion of Sphaerotheriida. Monophyly of Oniscomorpha has been defended based on the presence of a collum much smaller than the following tergites, the second tergite being much larger than following tergites, and on the lack of coxal pouches on legs (Blanke and Wesener 2014). The status of these characters as synapomorphies is disputed by our trees.
In Helminthomorpha, the traditional clades Colobognatha and Eugnatha are each monophyletic, as found in prior analyses of largely the same set of millipede species (Brewer and Bond 2013), as well as by sampling different exemplars for 3 nuclear coding genes (Miyazawa et al. 2014). Colobognatha and Eugnatha were originally proposed in the classical era of myriapod systematics (Attems 1926; Verhoeff 1928), but were discarded in the influential millipede classification by Hoffman (1980), who considered that the characteristic reduced mouthparts of Colobognatha were prone to convergence. They have, however, consistently been endorsed in morphological cladistic analyses (Enghoff 1984; Sierwald et al. 2003; Blanke and Wesener 2014). As likewise found by Brewer and Bond (2013), Eugnatha includes 2 groups that have a long history of usage in morphology-based systematics. One of these unites Chordeumatida (Cleidogona) and Callipodida (Abacion), which are classified together as Coelochaeta. Another clade consists of the ring-forming millipedes, Juliformia. Our analyses variably resolve the 3-taxon problem of the juliform orders with either Julida (most analyses) or Spirobolida as sister group of Spirostreptida. Both of these conflict with the weak morphological support for Spirobolida + Julida (Blanke and Wesener 2014), but have been found in other molecular studies. A Julida + Spirostreptida clade was supported by 3 nuclear protein-coding genes (Miyazawa et al. 2014), whereas nuclear ribosomal genes (Cong et al. 2009) and mitochondrial gene rearrangements and amino acid sequences (Woo et al. 2007) supported a Spirobolida + Spirostreptida clade.
Two contentious issues in millipede systematics involve the relationships of Polydesmida and of Stemmiulida. From the perspective of morphology, Polydesmida has been considered the sister group of Juliformia as a “ring-forming” clade (Enghoff et al. 1993) or as sister group to a putative clade named Nematophora (Sierwald et al. 2003; Blanke and Wesener 2014). The latter group, named for the shared presence of preanal spinnerets, traditionally includes Stemmiulida, Callipodida, and Chordeumatida (Enghoff 1984; Sierwald et al. 2003). Spinnerets are, however, more widely shared by Polydesmida (Shear 2008), and this character has been cited as synapomorphic for a clade containing Polydesmida + Nematophora (Blanke and Wesener 2014). Our results, like those of Brewer and Bond (2013), do not retrieve monophyly of Nematophora in its traditional guise: Chordeumatida + Callipodida do not unite with Stemmiulida, the latter being resolved either with Polydesmida or with Juliformia. Optimization on the topology of Brewer and Bond (2013) as well as those obtained here suggests that spinnerets are an autapomorphy of Eugnatha as a whole and were lost in Juliformia.
All chilopod orders are well supported and relationships within each of the large orders correspond to previous phylogenetic hypotheses, and for most to traditional taxonomy. The 3 families of Scutigeromorpha resolve with Pselliodidae (Sphendononema) as sister group to Scutigerinidae (Scutigerina) and Scutigeridae (Scutigera). The same topology has consistently been inferred using targeted sequencing of a few loci (Edgecombe and Giribet 2006, 2009; Butler et al. 2010; Giribet and Edgecombe 2013), but contrasts with the morphological placement of Scutigerinidae as sister group to Pselliodidae and Scutigeridae (Koch and Edgecombe 2006). Lithobiomorpha comprises 2 clades that correspond to its 2 families, Henicopidae and Lithobiidae. Scolopendromorpha consists of a blind clade and an ocellate clade. The number of events of eye loss in Scolopendromorpha had been a subject of some debate (Vahtera et al. 2012), but the transcriptomic data strongly corroborate weaker signal from targeted gene sequencing (Vahtera et al. 2013) and morphology (Koch et al. 2009; Koch et al. 2010) for blindness in the common ancestor of Cryptopidae and Scolopocryptopidae + Plutoniumidae. All analyses herein resolve Scolopocryptopidae as paraphyletic, Scolopocryptops being more closely related to Theatops (Plutoniumidae) than to Newportia. This result implies that the shared presence of 23 leg-bearing trunk segments in Scolopocryptopinae (Scolopocryptops) and Newportiinae (Newportia) is either acquired convergently from a 21-segmented ancestor or is homologous but was reversed (to 21 segments) in Plutoniumidae. Monophyletic Scolopendridae consists of Otostigminae (Alipes and Rhysida) and Scolopendrinae (Akymnopellis and Scolopendropsis), precisely mirroring classical and current taxonomy. Geophilomorpha also resolves along traditional lines into Placodesmata (Mecistocephalidae: Mecistocephalus and Tygarrup) and Adesmata, a clade composed of all other geophilomorphs. Resolution within Adesmata conflicts with the most recent analysis of geophilomorph relationships (Bonato et al. 2014a); they found a clade containing Oryidae, Himantariidae and Schendylidae (Himantarioidea), whereas our analyses likewise recover a Himantariidae + Schendylidae clade but consistently place Notiphilides (Oryidae) as sister group to Geophilidae. Our 3 Geophilidae (representatives of Geophilidae and 2 recently synonymized families Dignathodontidae and Linotaeniidae) constitute a well-supported and stable clade.
Divergence Times of Myriapods
The dated phylogeny for Supermatrix III reflects a diversification of Myriapoda in the early and middle Cambrian, supporting a Cambrian diversification event, as suggested recently for this lineage (Rota-Stabelli et al. 2013b; Lozano-Fernández et al. 2016). This dating continues to substantially predate body fossil or even trace fossil evidence for Myriapoda, the oldest trackways that can be ascribed to myriapods with reasonable confidence being Late Ordovician in age (Johnson et al. 1994; Wilson 2006). Diversification of Diplopoda is inferred to occur in the late Cambrian to mid Silurian, and the diversification of Chilopoda in the Early Ordovician to Middle Devonian (Fig. 3). The diversification times of the millipede and centipede orders included in our analyses are thus generally congruent with the timing inferred in previous studies (Meusemann et al. 2010; Rehm et al. 2011; Brewer and Bond 2013; Rota-Stabelli et al. 2013a; Fernández et al. 2014b), and do not greatly predate first occurrences of major chilopod and diplopod lineages in the fossil record. On the other hand, an estimated Cambrian diversification of myriapods implies a large gap in the fossil record. Fossil candidates for stem-group Myriapoda in marine, freshwater or terrestrial sediments of Cambrian age remain unknown or unidentified (Edgecombe 2004; Shear and Edgecombe 2010). Nonetheless, the occurrence of crown-group Pancrustacea as early as Cambrian Stage 3 (Edgecombe and Legg 2014) predicts a ghost lineage for Myriapoda to at least that time, ca. 517 Ma.
In centipedes, the addition of transcriptomes with respect to previous studies (Fernández et al. 2014b) resulted in slightly older dates, but it did not affect their origin. In this study, the inferred diversification dates ranged from the Early Ordovician to the Middle Devonian for Pleurostigmophora, from the Middle Ordovician to the Early Carboniferous for Amalpighiata, and from the Late Devonian to the mid Carboniferous for Epimorpha.
The controversy over the systematic position of Craterostigmus (i.e., whether Phylactometria or Amalpighiata is monophyletic) relates to lineages that have ancient, rapidly diverging stem groups but relatively shallow crown groups, conditions expected to contribute to a difficult phylogenetic problem. Despite a divergence from other living chilopod orders by the Late Silurian, the 2 extant species of Craterostigmus have a mean date for their divergence from each other in the Cretaceous, and these species are almost indistinguishable morphologically (Edgecombe and Giribet 2008). Likewise, Scutigeromorpha, with which Craterostigmus groups in various analyses, has a stem dating to the Silurian, but the deepest split between its 3 extant families has a mean date in the Triassic. Although the group is also conservative morphologically, we have maximized phylogenetic diversity here for a clade that has been well resolved phylogenetically and which increased its diversification rate around 100 million years ago (Giribet and Edgecombe 2013). This is effectively like Craterostigmomorpha, where all the extant diversity is comparatively recent and old branches are unrepresented in our analyses because of extinction.
Using Morphology to Test Phylogenomic Hypothesis
Results herein demonstrate that most systematic hypotheses for Myriapoda are strongly supported across the explored sets of genes, optimality criteria, and programs. For example, the deep interrelationships within the 4 large centipede orders are stable across all analyses (Fig. 2). These relationships also show a high degree of congruence with morphological trees and morphology-based classifications. In the case of, for example, Scolopendromorpha, in which every node is strongly supported in every analysis, we can conclude that a high degree of confidence can be placed in the results.
Where hypotheses vary according to different methods or data partitions, in some cases morphology provides a strong arbiter for evaluating the rival hypotheses. For example, the analyses of supermatrix III typically recover Lithobiomorpha as sister group of Geophilomorpha, whereas the larger gene samples generally group Geophilomorpha with Scolopendromorpha. The former hypothesis has, to our knowledge, only been recovered in a single, non-numerical phylogenetic analysis, based on a single character of sperm structure (Jamieson 1986). In contrast, a geophilomorph-scolopendromorph clade— the classical Epimorpha—receives morphological support from the perspectives of development, behavior, external morphology and internal anatomy (8 autapomorphies listed by Edgecombe 2011). This ability of morphology to select between rival hypotheses that are each based on vast pools of data affirms the continued relevance of morphological characters in phylogenetics (e.g., Giribet 2015; Lee Michael and Palci 2015; Wanninger 2015) and permits delving into the possible reasons for the discordance between the different analyses.
Furthermore, access to a morphological data set allowed us to establish the position of fossil terminals for node calibration using the exact same set of extant terminals used in phylogenomic analyses (as in Sharma and Giribet 2014). Most recent justification for the necessity of morphological data in molecular dating has focused on its indispensability for so-called tip dating or total evidence dating (e.g., Giribet 2015; Lee and Palci 2015; Pyron 2015). However, even in the standard node calibration approach as employed here, the position of fossils can be determined in the context of the precise taxonomic sample used in other parts of the study, rather than cobbling together justifications for node calibrations from external (or possibly mixed) sources.
CONCLUDING REMARKS
In this study, we explored the phylogeny of Myriapoda and the internal relationships of its largest clades, Diplopoda and Chilopoda, using published genomes and transcriptomes as well as novel transcriptomic data for 25 species. For this, we constructed an array of data sets to independently optimize gene number, gene occupancy, matrix composition phylogenetic informativeness, distance to outgroups or gene conservation and analyzed them using different phylogenetic methods and evolutionary models at an unprecedented level of depth. Our study detected a complex interaction of a multitude of phylogenetic factors, and highlights the necessity of exploring and dissecting the potential sources of systematic error in each individual data set.
In addition we generated a morphological data matrix of 232 characters that was used to precisely place a set of fossils subsequently used for node calibration analyses. Our results largely corroborate those of previous analyses, especially with respect to the millipede ordinal relationships and added resolution to the centipede tree, sampled at the family level. However, we identified a few conflicting nodes across analyses to discover that for the most part the matrices optimizing gene occupancy produced topologies at odds with morphology, development, prior molecular data sets, or most notably, our own analyses using matrices with larger numbers of genes (with lower average gene occupancy) or matrices optimizing phylogenetic informativeness and gene conservation. This calls for caution when selecting data sets based strictly on matrix completeness and adds further support to previous notions that a large diversity of genes, even to the detriment of matrix occupancy (contra Roure et al. 2013), may be a feasible solution to analyzing phylogenetic relationships among deep animal clades (e.g., Hejnol et al. 2009). Finally, our dating analysis continues to support results from prior studies in placing the diversification of Myriapoda in the Cambrian, prior to any recognizable myriapod fossil record, whereas the estimated diversification of both millipedes and centipedes is closer to the existing fossil record. Further refinement of the myriapod tree of life will require addition of pauropods, more symphylans, and a few missing lineages of centipedes and millipedes.
SUPPLEMENTARY MATERIAL
Data available from the Dryad Digital Repository: http://dx.doi.org/10.5061/dryad.8mp17.
ACKNOWLEDGMENTS
We are grateful to many colleagues who provided tissues, among them Jesús Ballesteros-Chávez, Tony Barber, Beka Buckman, Amazonas Chagas, Jr., Savel Daniels, Ronald Jenner, Bob Kallal, Bob Mesibov, Ana Tourinho, and Varpu Vahtera. Editors Andy Anderson and Brian Wiegmann and an anonymous reviewer provided helpful feedback and criticism that greatly helped to refine this manuscript.
FUNDING
Fieldwork was supported by the Putnam Expedition Grants program of the MCZ and by NSF grant DEB no. 1144417 (Collaborative Research: ARTS: Taxonomy and systematics of selected Neotropical clades of arachnids) to G. Hormiga and G.G. Sequencing costs were mostly covered by internal MCZ and FAS funds. R.F. was supported by NSF grant DEB no. 1457539 (Collaborative Proposal: Phylogeny and diversification of the orb weaving spiders) to G. Hormiga and G.G. The computations in this article were run on the Odyssey cluster supported by the FAS Division of Science, Research Computing Group at Harvard University.
References
- Aberer A.J., Krompass D., Stamatakis A. 2013. Pruning rogue taxa improves phylogenetic accuracy: an efficient algorithm and webservice. Syst. Biol. 62: 162–166. [DOI] [PMC free article] [PubMed] [Google Scholar]
- Aberer A.J., Stamatakis A. 2013. ExaML: Exascale Maximum Likelihood. Program and documentation available from: http://sco.h-its.org/exelixis/web/software/examl/index.html. [Google Scholar]
- Altenhoff A.M., Dessimoz C. 2009. Phylogenetic and functional assessment of orthologs inference projects and methods. PLoS Comp. Biol. 5: e1000262. [DOI] [PMC free article] [PubMed] [Google Scholar]
- Altenhoff A.M., Gil M., Gonnet G.H., Dessimoz C. 2013. Inferring hierarchical orthologous groups from orthologous gene pairs. PLoS ONE 8: e53786. [DOI] [PMC free article] [PubMed] [Google Scholar]
- Altenhoff A.M., Schneider A., Gonnet G.H., Dessimoz C. 2011. OMA 2011: orthology inference among 1000 complete genomes. Nucl. Ac. Res. 39: D289–D294. [DOI] [PMC free article] [PubMed] [Google Scholar]
- Andrade S.C.S., Novo M., Kawauchi G.Y., Worsaae K., Pleijel F., Giribet G., Rouse G.W. 2015. Articulating “archiannelids”: Phylogenomics and annelid relationships, with emphasis on meiofaunal taxa. Mol. Biol. Evol. 32: 2860–2875. [DOI] [PubMed] [Google Scholar]
- Andrew D.R. 2011. A new view of insect-crustacean relationships II. Inferences from expressed sequence tags and comparisons with neural cladistics. Arth. Struc. Devel. 40: 289–302. [DOI] [PubMed] [Google Scholar]
- Attems C.G.Kükenthal W., Krumbach T. 1926. Myriapoda. Handbuch der Zoologie, Berlin: de Gruyter; p. 202. [Google Scholar]
- Barakat A., Szick-Miranda K., Chang I.F., Guyot R., Blanc G., Cooke R., Delseny M., Bailey-Serres J. 2001. The organization of cytoplasmic ribosomal protein genes in the Arabidopsis genome. Pla. Physiol. 127: 398–415. [PMC free article] [PubMed] [Google Scholar]
- Blanke A., Wesener T. 2014. Revival of forgotten characters and modern imaging techniques help to produce a robust phylogeny of the Diplopoda (Arthropoda, Myriapoda). Arth. Struc. Devel. 43: 63–75. [DOI] [PubMed] [Google Scholar]
- Bonato L., Drago L., Murienne J. 2014a. Phylogeny of Geophilomorpha (Chilopoda) inferred from new morphological and molecular evidence. Cladistics 30: 485–507. [DOI] [PubMed] [Google Scholar]
- Bonato L., Edgecombe G.D., Minelli A. 2014b. Geophilomorph centipedes from the Cretaceous amber of Burma. Palaeontology 57: 97–110. [Google Scholar]
- Borner J., Rehm P., Schill R.O., Ebersberger I., Burmester T. 2014. A transcriptome approach to ecdysozoan phylogeny. Mol. Phylogen. Evol. 80: 79–87. [DOI] [PubMed] [Google Scholar]
- Borucki H. 1996. Evolution und Phylogenetisches System der Chilopoda (Mandibulata, Tracheata). Verhandlungen des naturwissenschaftlichen Vereins in Hamburg 35: 95–226. [Google Scholar]
- Brewer M.S., Bond J.E. 2013. Ordinal-level phylogenomics of the arthropod class Diplopoda (millipedes) based on an analysis of 221 nuclear protein-coding loci generated using next-generation sequence analyses. PLoS ONE 8: e79935. [DOI] [PMC free article] [PubMed] [Google Scholar]
- Brewer M.S., Sierwald P., Bond J.E. 2012. Millipede taxonomy after 250 years: classification and taxonomic practices in a mega-diverse yet understudied arthropod group. PLoS ONE 7: e37240. [DOI] [PMC free article] [PubMed] [Google Scholar]
- Butler A.D., Edgecombe G.D., Ball A.D., Giribet G. 2010. Resolving the phylogenetic position of enigmatic New Guinea and Seychelles Scutigeromorpha (Chilopoda): a molecular and morphological assessment of Ballonemini. Inver. Syst. 24: 539–559. [Google Scholar]
- Chang E.S., Neuhof M., Rubinstein N.D., Diamant A., Philippe H., Huchon D., Cartwright P. 2015. Genomic insights into the evolutionary origin of Myxozoa within Cnidaria. Proc. Natl Acad. Sci. USA 112: 14912–14917. [DOI] [PMC free article] [PubMed] [Google Scholar]
- Chang I.F., Szick-Miranda K., Pan S.Q., Bailey-Serres J. 2005. Proteomic characterization of evolutionarily conserved and variable proteins of Arabidopsis cytosolic ribosomes. Pla. Physiol. 137: 848–862. [DOI] [PMC free article] [PubMed] [Google Scholar]
- Chipman A.D., Ferrier D.E., Brena C., Qu J., Hughes D.S., Schroder R., Torres-Oliva M., Znassi N., Jiang H., Almeida F.C., Alonso C.R., Apostolou Z., Aqrawi P., Arthur W., Barna J.C., Blankenburg K.P., Brites D., Capella-Gutierrez S., Coyle M., Dearden P.K., Du Pasquier L., Duncan E.J., Ebert D., Eibner C., Erikson G., Evans P.D., Extavour C.G., Francisco L., Gabaldon T., Gillis W.J., Goodwin-Horn E.A., Green J.E., Griffiths-Jones S., Grimmelikhuijzen C.J., Gubbala S., Guigo R., Han Y., Hauser F., Havlak P., Hayden L., Helbing S., Holder M., Hui J.H., Hunn J.P., Hunnekuhl V.S., Jackson L., Javaid M., Jhangiani S.N., Jiggins F.M., Jones T.E., Kaiser T.S., Kalra D., Kenny N.J., Korchina V., Kovar C.L., Kraus F.B., Lapraz F., Lee S.L., Lv J., Mandapat C., Manning G., Mariotti M., Mata R., Mathew T., Neumann T., Newsham I., Ngo D.N., Ninova M., Okwuonu G., Ongeri F., Palmer W.J., Patil S., Patraquim P., Pham C., Pu L.L., Putman N.H., Rabouille C., Ramos O.M., Rhodes A.C., Robertson H.E., Robertson H.M., Ronshaugen M., Rozas J., Saada N., Sanchez-Gracia A., Scherer S.E., Schurko A.M., Siggens K.W., Simmons D., Stief A., Stolle E., Telford M.J., Tessmar-Raible K., Thornton R., van der Zee M., von Haeseler A., Williams J.M., Willis J.H., Wu Y., Zou X., et al. 2014. The first myriapod genome sequence reveals conservative arthropod gene content and genome organisation in the centipede Strigamia maritima. PLoS Biol. 12: e1002005. [DOI] [PMC free article] [PubMed] [Google Scholar]
- Cong P.Y., Xia X.H., Yang Q. 2009. Monophyly of the ring-forming group in Diplopoda (Myriapoda, Arthropoda) based on SSU and LSU ribosomal RNA sequences. Prog. Nat. Sci. 19: 1297–1303. [Google Scholar]
- Dell’Ampio E., Meusemann K., Szucsich N.U., Peters R.S., Meyer B., Borner J., Petersen M., Aberer A.J., Stamatakis A., Walzl M.G., Minh B.Q., von Haeseler A., Ebersberger I., Pass G., Misof B. 2014. Decisive data sets in phylogenomics: lessons from studies on the phylogenetic relationships of primarily wingless insects. Mol. Biol. Evol. 31: 239–249. [DOI] [PMC free article] [PubMed] [Google Scholar]
- Dohle W. 1980. Sind die Myriapoden eine monophyletische Gruppe? Eine Diskussion der Verwandtschaftsbeziehungen der Antennaten. Abhandlungen und Verhandlungen des Naturwissenschaftlichen Vereins in Hamburg (Neue Folge) 23: 45–104. [Google Scholar]
- Dohle W. 1997. Are the insects more closely related to the crustaceans than to the myriapods? Entomologica Scandinavica Suppl. 51: 7–16. [Google Scholar]
- Dong Y., Sun H., Guo H., Pan D., Qian C., Hao S., Zhou K. 2012. The complete mitochondrial genome of Pauropus longiramus (Myriapoda: Pauropoda): Implications on early diversification of the myriapods revealed from comparative analysis. Gene 505: 57–65. [DOI] [PubMed] [Google Scholar]
- Drummond A.J., Bouckaert R.R. 2014. Bayesian evolutionary analysis with BEAST 2 Cambridge: Cambridge University Press. [Google Scholar]
- Edgar R.C. 2004. MUSCLE: multiple sequence alignment with high accuracy and high throughput. Nucl. Aci. Res. 32: 1792–1797. [DOI] [PMC free article] [PubMed] [Google Scholar]
- Edgecombe G.D. 2004. Morphological data, extant Myriapoda, and the myriapod stem-group. Cont. Zool. 73: 207–252. [Google Scholar]
- Edgecombe G.D.Minelli A. 2011. Phylogenetic relationships of Myriapoda. Treatise on Zoology - Anatomy, Taxonomy, Biology. The Myriapoda, Vol. 1, Brill, Linden p. 1–20. [Google Scholar]
- Edgecombe G.D., Giribet G.Llorente Bousquets J.E., Morrone J.J. 2002. Myriapod phylogeny and the relationships of Chilopoda. Biodiversidad, taxonoma y biogeografa de artrópodos de México: Hacia una sntesis de su conocimiento. Prensas de Ciencias, Mexico D.F.: Universidad Nacional Autónoma de México, p. 143–168. [Google Scholar]
- Edgecombe G.D., Giribet G. 2004. Adding mitochondrial sequence data (16S rRNA and cytochrome c oxidase subunit I) to the phylogeny of centipedes (Myriapoda, Chilopoda): an analysis of morphology and four molecular loci. J. Zool. Syst. Evol. Res. 42: 89–134. [Google Scholar]
- Edgecombe G.D., Giribet G. 2006. A century later — a total evidence re-evaluation of the phylogeny of scutigeromorph centipedes (Myriapoda : Chilopoda). Inver. Syst. 20: 503–525. [Google Scholar]
- Edgecombe G.D., Giribet G. 2008. A New Zealand species of the trans-Tasman centipede order Craterostigmomorpha (Arthropoda: Chilopoda) corroborated by molecular evidence. Inver. Syst. 22: 1–15. [Google Scholar]
- Edgecombe G.D., Giribet G. 2009. Phylogenetics of scutigeromorph centipedes (Myriapoda: Chilopoda) with implications for species delimitation and historical biogeography of the Australian and New Caledonian faunas. Cladistics 25: 406–427. [DOI] [PubMed] [Google Scholar]
- Edgecombe G.D., Legg D.A. 2014. Origins and early evolution of arthropods. Palaeontology 57: 457–468. [Google Scholar]
- Enghoff H. 1984. Phylogeny of millipedes - a cladistic analysis. Zeitschrift Fur Zoologische Systematik Und Evolutionsforschung 22: 8–26. [Google Scholar]
- Enghoff H., Dohle W., Blower J.G. 1993. Anamorphosis in millipedes (Diplopoda)—the present state of knowledge with some developmental and phylogenetic considerations. Zool. J. Linnean Society 109: 103–234. [Google Scholar]
- Fernández R., Hormiga G., Giribet G. 2014a. Phylogenomic analysis of spiders reveals nonmonophyly of orb weavers. Curr. Biol. 24: 1772–1777. [DOI] [PubMed] [Google Scholar]
- Fernández R., Laumer C.E., Vahtera V., Libro S., Kaluziak S., Sharma P.P., Pérez-Porro A.R., Edgecombe G.D., Giribet G. 2014b. Evaluating topological conflict in centipede phylogeny using transcriptomic data sets. Mol. Biol. Evol. 31: 1500–1513. [DOI] [PubMed] [Google Scholar]
- Fu L.M., Niu B.F., Zhu Z.W., Wu S.T., Li W.Z. 2012. CD-HIT: accelerated for clustering the next-generation sequencing data. Bioinformatics 28: 3150–3152. [DOI] [PMC free article] [PubMed] [Google Scholar]
- Gai Y., Song D., Sun H., Yang Q., Zhou K. 2008. The complete mitochondrial genome of Symphylella sp. (Myriapoda: Symphyla): Extensive gene order rearrangement and evidence in favor of Progoneata. Mol. Phyl. Evol. 49: 574–585. [DOI] [PubMed] [Google Scholar]
- Giribet G. 2015. Morphology should not be forgotten in the era of genomics—a phylogenetic perspective. Zool. Anzeiger 256: 96–103. [Google Scholar]
- Giribet G., Carranza S., Riutort M., Baguñà J., Ribera C. 1999. Internal phylogeny of the Chilopoda (Myriapoda, Arthropoda) using complete 18S rDNA and partial 28S rDNA sequences. Phil. Trans. R. Soc. Lond. B Biol. Sci. 354: 215–222. [DOI] [PMC free article] [PubMed] [Google Scholar]
- Giribet G., Edgecombe G.D. 2013. Stable phylogenetic patterns in scutigeromorph centipedes (Myriapoda : Chilopoda : Scutigeromorpha): dating the diversification of an ancient lineage of terrestrial arthropods. Inver. Syst. 27: 485–501. [Google Scholar]
- Giribet G., Edgecombe G.D., Wheeler W.C. 2001. Arthropod phylogeny based on eight molecular loci and morphology. Nature 413: 157–161. [DOI] [PubMed] [Google Scholar]
- Goloboff P.A. 1993. Estimating character weights during tree search. Cladistics 9: 83–91. [DOI] [PubMed] [Google Scholar]
- Goloboff P.A., Farris J.S., Nixon K.C. 2008. TNT, a free program for phylogenetic analysis. Cladistics 24: 774–786. [Google Scholar]
- Goloboff P.A., Szumik C.A. 2015. Identifying unstable taxa: Efficient implementation of triplet-based measures of stability, and comparison with Phyutility and RogueNaRok. Mol. Phylogen. Evol. 88: 93–104. [DOI] [PubMed] [Google Scholar]
- Graham S.W., Olmstead R.G., Barnett S.C. 2002. Rooting phylogenetic trees with distant outgroups: a case study from the commelinoid monocots. Mol. Biol. Evol. 19: 1769–1781. [DOI] [PubMed] [Google Scholar]
- Grünewald S., Spillner A., Bastkowski S., Bogershausen A., Moulton V. 2013. SuperQ: computing supernetworks from quartets. IEEE/ACM Trans. Comput. Biol. Bioinform. / IEEE, ACM 10: 151–160. [DOI] [PubMed] [Google Scholar]
- Guindon S. 2013. From trajectories to averages: an improved description of the heterogeneity of substitution rates along lineages. Syst. Biol. 62: 22–34. [DOI] [PubMed] [Google Scholar]
- Guindon S., Gascuel O. 2003. A simple, fast, and accurate algorithm to estimate large phylogenies by maximum likelihood. Syst. Biol. 52: 696–704. [DOI] [PubMed] [Google Scholar]
- Haas B.J., Papanicolaou A., Yassour M., Grabherr M., Blood P.D., Bowden J., Couger M.B., Eccles D., Li B., Lieber M., Macmanes M.D., Ott M., Orvis J., Pochet N., Strozzi F., Weeks N., Westerman R., William T., Dewey C.N., Henschel R., LeDuc R.D., Friedman N., Regev A. 2013. De novo transcript sequence reconstruction from RNA-seq using the Trinity platform for reference generation and analysis. Nat. Proto. 8: 1494–1512. [DOI] [PMC free article] [PubMed] [Google Scholar]
- Heath T.A., Huelsenbeck J.P., Stadler T. 2014. The fossilized birth-death process for coherent calibration of divergence-time estimates. Proc. Natl Acad. Sci. USA 111: E2957–E2966. [DOI] [PMC free article] [PubMed] [Google Scholar]
- Hejnol A., Obst M., Stamatakis A.M.O., Rouse G.W., Edgecombe G.D., Martinez P., Baguñà J., Bailly X., Jondelius U., Wiens M., Müller W.E.G., Seaver E., Wheeler W.C., Martindale M.Q., Giribet G., Dunn C.W. 2009. Assessing the root of bilaterian animals with scalable phylogenomic methods. Proc. Roy. Soci. B: Biol. Sci. 276: 4261–4270. [DOI] [PMC free article] [PubMed] [Google Scholar]
- Hoffman R.L. 1980. Classification of the Diplopoda. Genève: Muséum d’Histoire Naturelle. [Google Scholar]
- Huelsenbeck J.P., Bollback J.P., Levine A.M. 2002. Inferring the root of a phylogenetic tree. Syst. Biol. 51: 32–43. [DOI] [PubMed] [Google Scholar]
- Huson D.H., Bryant D. 2006. Application of phylogenetic networks in evolutionary studies. Mol. Biol. Evol. 23: 254–267. [DOI] [PubMed] [Google Scholar]
- Inoue J., Donoghue P.C.J., Yang Z.H. 2010. The impact of the representation of fossil calibrations on Bayesian estimation of species divergence times. Syst. Biol. 59: 74–89. [DOI] [PubMed] [Google Scholar]
- Jamieson B.G.M. 1986. The spermatozoa of the Chilopoda (Uniramia): an ultrastructural review with data on dimorphism in Ethmostigmus rubripes and phylogenetic discussion. J. Submic. Cytol. 18: 543–558. [Google Scholar]
- Johnson E.W., Briggs D.E.G., Suthren R.J., Wright J.L., Tunnicliff S.P. 1994. Non-marine arthropod traces from the subaerial Ordovician Borrowdale Volcanic Group, English Lake District. Geol. Mag. 131: 395–406. [Google Scholar]
- Kenrick P., Wellman C.H., Schneider H., Edgecombe G.D. 2012. A timeline for terrestrialization: consequences for the carbon cycle in the Palaeozoic. Phil. Trans. R. Soci. B: Biol. Sci. 367: 519–536. [DOI] [PMC free article] [PubMed] [Google Scholar]
- Koch M., Edgecombe G.D. 2006. Peristomatic structures in Scutige-romorpha (Chilopoda): a comparative study, with new characters for higher-level systematics. Zoomorphology 125: 187–207. [Google Scholar]
- Koch M., Edgecombe G.D. 2012. The preoral chamber in geophilomorph centipedes: comparative morphology, phylogeny, and the evolution of centipede feeding structures. Zool. J. Linnean Soci. 165: 1–621. [Google Scholar]
- Koch M., Edgecombe G.D., Shelley R.M. 2010. Anatomy of Ectonocryptoides (Scolopocryptopidae: Ectonocryptopinae) and the phylogeny of blind Scolopendromorpha (Chilopoda). Intern. J. Myriapod. 3: 51–81. [Google Scholar]
- Koch M., Pärschke S., Edgecombe G.D. 2009. Phylogenetic implications of gizzard morphology in scolopendromorph centipedes (Chilopoda). Zool. Scripta 38: 269–288. [Google Scholar]
- Kück P., Struck T.H. 2014. BaCoCa - A heuristic software tool for the parallel assessment of sequence biases in hundreds of gene and taxon partitions. Mol. Phylogen. Evol. 70: 94–98. [DOI] [PubMed] [Google Scholar]
- Langmead B., Trapnell C., Pop M., Salzberg S.L. 2009. Ultrafast and memory-efficient alignment of short DNA sequences to the human genome. Gen. Biol. 10: R25. [DOI] [PMC free article] [PubMed] [Google Scholar]
- Lartillot N., Philippe H. 2004. A Bayesian mixture model for across-site heterogeneities in the amino-acid replacement process. Mol. Biol. Evol. 21: 1095–1109. [DOI] [PubMed] [Google Scholar]
- Lartillot N., Philippe H. 2008. Improvement of molecular phylogenetic inference and the phylogeny of Bilateria. Phil. Trans. Roy. Soci. Lond. B: Biol. Sci. 363: 1463–1472. [DOI] [PMC free article] [PubMed] [Google Scholar]
- Lartillot N., Rodrigue N., Stubbs D., Richer J. 2013. PhyloBayes MPI: Phylogenetic reconstruction with infinite mixtures of profiles in a parallel environment. Syst. Biol. 62: 611–615. [DOI] [PubMed] [Google Scholar]
- Laumer C.E., Hejnol A., Giribet G. 2015. Nuclear genomic signals of the “microturbellarian” roots of platyhelminth evolutionary innovation. eLife 4: e05503. [DOI] [PMC free article] [PubMed] [Google Scholar]
- Le S.Q., Dang C.C., Gascuel O. 2012. Modeling protein evolution with several amino acid replacement matrices depending on site rates. Mol. Biol. Evol. 29: 2921–2936. [DOI] [PubMed] [Google Scholar]
- Lee M.S.Y., Palci A. 2015. Morphological phylogenetics in the genomic age. Curr. Biol. 25: R922–R929. [DOI] [PubMed] [Google Scholar]
- Lee M.S.Y., Soubrier J., Edgecombe G.D. 2013. Rates of phenotypic and genomic evolution during the Cambrian Explosion. Curr. Biol. 23: 1–7. [DOI] [PubMed] [Google Scholar]
- Lenz P.H., Roncalli V., Hassett R.P., Wu L.S., Cieslak M.C., et al. 2014. De Novo Assembly of a Transcriptome for Calanus finmarchicus (Crustacea, Copepoda) - The Dominant Zooplankter of the North Atlantic Ocean. PLoS ONE 9(2): e88589 doi: 10.1371/journal.pone.0088589. [DOI] [PMC free article] [PubMed] [Google Scholar]
- Lemmon A.R., Brown J.M., Stanger-Hall K., Lemmon E.M. 2009. The effect of ambiguous data on phylogenetic estimates obtained by maximum likelihood and Bayesian inference. Syst. Biol. 58: 130–145. [DOI] [PMC free article] [PubMed] [Google Scholar]
- Lemmon E.M., Lemmon A.R. 2013. High-throughput genomic data in systematics and phylogenetics. Ann. Rev. Ecol., Evol., Syst. 44: 99–121. [Google Scholar]
- Lepage T., Bryant D., Philippe H., Lartillot N. 2007. A general comparison of relaxed molecular clock models. Mol. Biol. Evol. 24: 2669–2680. [DOI] [PubMed] [Google Scholar]
- López-Giráldez F., Moeller A.H., Townsend J.P. 2013. Evaluating phylogenetic informativeness as a predictor of phylogenetic signal for metazoan, fungal, and mammalian phylogenomic data sets. Biom. Res. Intern. 2013: 621604. [DOI] [PMC free article] [PubMed] [Google Scholar]
- Lozano-Fernandez J., Carton R., Tanner A.R., Puttick M.N., Blaxter M., Vinther J., Olesen J., Giribet G., Edgecombe G.D., Pisani D. 2016. A molecular palaeobiological exploration of arthropod terrestrialisation. Phil. Trans. R. Soc. B 20150133 http://dx.doi.org/10.1098/rstb.2015.0133. [DOI] [PMC free article] [PubMed] [Google Scholar]
- Maddison W.P. 1993. Missing data versus missing characters in phylogenetic analysis. Syst. Biol. 42: 576–581. [Google Scholar]
- Meusemann K., von Reumont B.M., Simon S., Roeding F., Strauss S., Kück P., Ebersberger I., Walzl M., Pass G., Breuers S., Achter V., von Haeseler A., Burmester T., Hadrys H., Wägele J.W., Misof B. 2010. A phylogenomic approach to resolve the arthropod tree of life. Mol. Biol. and Evol. 27: 2451–2464. [DOI] [PubMed] [Google Scholar]
- Mirarab S., Reaz R., Bayzid M.S., Zimmermann T., Swenson M.S., Warnow T. 2014. ASTRAL: genome-scale coalescent-based species tree estimation. Bioinformatics 30: i541–i548. [DOI] [PMC free article] [PubMed] [Google Scholar]
- Miyazawa H., Ueda C., Yahata K., Su Z.H. 2014. Molecular phylogeny of Myriapoda provides insights into evolutionary patterns of the mode in post-embryonic development. Scientific Reports 4: 4127. [DOI] [PMC free article] [PubMed] [Google Scholar]
- Murienne J., Edgecombe G.D., Giribet G. 2010. Including secondary structure, fossils and molecular dating in the centipede tree of life. Mol. Phylogen. Evol. 57: 301–313. [DOI] [PubMed] [Google Scholar]
- Norell M.A., Gladstein D., Wheeler W.C. 1995. On missing data in phylogenetic analysis. J. Ver. Paleontol. 15: 46A. [Google Scholar]
- Norell M.A., Wheeler W. 2003. Missing entry replacement data analysis: A replacement approach to dealing with missing data in paleontological and total evidence data sets. J. Ver. Paleontol. 23: 275–283. [Google Scholar]
- Nosenko T., Schreiber F., Adamska M., Adamski M., Eitel M., Hammel J., Maldonado M., Müller W.E., Nickel M., Schierwater B., Vacelet J., Wiens M., Wörheide G. 2013. Deep metazoan phylogeny: When different genes tell different stories. Mol. Phylogen. Evol. 67: 223–233. [DOI] [PubMed] [Google Scholar]
- Olesen J. 2009. Phylogeny of Branchiopoda (Crustacea) - character evolution and contribution of uniquely preserved fossils. Arth. Syst. Phylo. 67: 3–39. [Google Scholar]
- Philippe H., Brinkmann H., Lavrov D.V., Littlewood D.T.J., Manuel M., Wörheide G., Baurain D. 2011. Resolving difficult phylogenetic questions: Why more sequences are not enough. PLoS Biol. 9: e1000602. [DOI] [PMC free article] [PubMed] [Google Scholar]
- Philippe H., Snell E.A., Bapteste E., Lopez P., Holland P.W.H., Casane D. 2004. Phylogenomics of eukaryotes: Impact of missing data on large alignments. Mol. Biol. Evol. 21: 1740–1752. [DOI] [PubMed] [Google Scholar]
- Philippe H., Zhou Y., Brinkmann H., Rodrigue N., Delsuc F. 2005. Heterotachy and long-branch attraction in phylogenetics. BMC Evol. Biol. 5: 50. [DOI] [PMC free article] [PubMed] [Google Scholar]
- Phillips M.J., Penny D. 2003. The root of the mammalian tree inferred from whole mitochondrial genomes. Mol. Phylogen. Evol. 28: 171–185. [DOI] [PubMed] [Google Scholar]
- Pick K.S., Philippe H., Schreiber F., Erpenbeck D., Jackson D.J., Wrede P., Wiens M., Alié A., Morgenstern B., Manuel M., Wörheide G. 2010. Improved phylogenomic taxon sampling noticeably affects nonbilaterian relationships. Mol. Biol. Evol. 27: 1983–1987. [DOI] [PMC free article] [PubMed] [Google Scholar]
- Pyron R.A. 2015. Post-molecular systematics and the future of phylogenetics. Tren. Ecol. Evol. 30: 384–389. [DOI] [PubMed] [Google Scholar]
- Regier J.C., Shultz J.W., Ganley A.R., Hussey A., Shi D., Ball B., Zwick A., Stajich J.E., Cummings M.P., Martin J.W., Cunningham C.W. 2008. Resolving arthropod phylogeny: Exploring phylogenetic signal within 41 kb of protein-coding nuclear gene sequence. Syst. Biol. 57: 920–938. [DOI] [PubMed] [Google Scholar]
- Regier J.C., Shultz J.W., Zwick A., Hussey A., Ball B., Wetzer R., Martin J.W., Cunningham C.W. 2010. Arthropod relationships revealed by phylogenomic analysis of nuclear protein-coding sequences. Nature 463: 1079–1083. [DOI] [PubMed] [Google Scholar]
- Regier J.C., Wilson H.M., Shultz J.W. 2005. Phylogenetic analysis of Myriapoda using three nuclear protein-coding genes. Mol. Phylogen. Evol. 34: 147–158. [DOI] [PubMed] [Google Scholar]
- Rehm P., Borner J., Meusemann K., von Reumont B.M., Simon S., Hadrys H., Misof B., Burmester T. 2011. Dating the arthropod tree based on large-scale transcriptome data. Mol. Phylogen. Evol. 61: 880–887. [DOI] [PubMed] [Google Scholar]
- Rehm P., Meusemann K., Borner J., Misof B., Burmester T. 2014. Phylogenetic position of Myriapoda revealed by 454 transcriptome sequencing. Mol. Phylogen. Evol. 77C: 25–33. [DOI] [PubMed] [Google Scholar]
- Rokas A., Williams B.L., King N., Carroll S.B. 2003. Genome-scale approaches to resolving incongruence in molecular phylogenies. Nature 425: 798–804. [DOI] [PubMed] [Google Scholar]
- Ronquist F., Huelsenbeck J.P. 2003. MrBayes 3: Bayesian phylogenetic inference under mixed models. Bioinformatics 19: 1572–1574. [DOI] [PubMed] [Google Scholar]
- Rota-Stabelli O., Campbell L., Brinkmann H., Edgecombe G.D., Longhorn S.J., Peterson K.J., Pisani D., Philippe H., Telford M.J. 2011. A congruent solution to arthropod phylogeny: phylogenomics, microRNAs and morphology support monophyletic Mandibulata. Proc. Roy. Soci. B: Biol. Sci. 278: 298–306. [DOI] [PMC free article] [PubMed] [Google Scholar]
- Rota-Stabelli O., Daley A.C., Pisani D. 2013a. Molecular timetrees reveal a Cambrian colonization of land and a new scenario for ecdysozoan evolution. Curr. Biol. 23: 392–398. [DOI] [PubMed] [Google Scholar]
- Rota-Stabelli O., Lartillot N., Philippe H., Pisani D. 2013b. Serine codon-usage bias in deep phylogenomics: pancrustacean relationships as a case study. Syst. Biol. 62: 121–133. [DOI] [PubMed] [Google Scholar]
- Roure B., Baurain D., Philippe H. 2013. Impact of missing data on phylogenies inferred from empirical phylogenomic data sets. Mol. Biol. Evol. 30: 197–214. [DOI] [PubMed] [Google Scholar]
- Salichos L., Rokas A. 2011. Evaluating ortholog prediction algorithms in a yeast model clade. PLoS ONE 6: e18755. [DOI] [PMC free article] [PubMed] [Google Scholar]
- Salichos L., Rokas A. 2013. Inferring ancient divergences requires genes with strong phylogenetic signals. Nature 497: 327–331. [DOI] [PubMed] [Google Scholar]
- Sharma P.P., Giribet G. 2014. A revised dated phylogeny of the arachnid order Opiliones. Fron. Gen. 5: 255. [DOI] [PMC free article] [PubMed] [Google Scholar]
- Shear W.Zhang Z.-Q. 2011. Class Diplopoda de Blainville in Gervais,: 1844. Animal biodiversity: An outline of higher-level classification and survey of taxonomic richness. Auckland: Magnolia Press, p. 159–164. [Google Scholar]
- Shear W.A. 2008. Spinnerets in the milliped order Polydesmida, and the phylogenetic signifi cance of spinnerets in millipeds (Diplopoda). Inter. J. Myriapod. 2: 123–146. [Google Scholar]
- Shear W.A., Bonamo P.M. 1988. Devonobiomorpha, a new order of centipeds (Chilopoda) from the middle Devonian of Gilboa, New York State, USA, and the phylogeny of centiped orders. Am. Mus. Nov. 2927: 1–30. [Google Scholar]
- Shear W.A., Edgecombe G.D. 2010. The geological record and phylogeny of Myriapoda. Arth. Struc. Devel. 39: 174–190. [DOI] [PubMed] [Google Scholar]
- Siddall M.E., Whiting M.F. 1999. Long-branch abstractions. Cladistics 15: 9–24. [Google Scholar]
- Sierwald P., Bond J.E. 2007. Current status of the myriapod class Diplopoda (millipedes): taxonomic diversity and phylogeny. Ann. Rev. Entomol. 52: 401–420. [DOI] [PubMed] [Google Scholar]
- Sierwald P., Shear W.A., Shelley R.M., Bond J.E. 2003. Millipede phylogeny revisited in the light of the enigmatic order Siphoniulida. J. Zool. Syst. Evol. Res. 41: 87–99. [Google Scholar]
- Simmons M.P. 2012. Misleading results of likelihood-based phylogenetic analyses in the presence of missing data. Cladistics 28: 208–222. [DOI] [PubMed] [Google Scholar]
- Smith S.A., Dunn C.W. 2008. Phyutility: a phyloinformatics tool for trees, alignments and molecular data. Bioinformatics 24: 715–716. [DOI] [PubMed] [Google Scholar]
- Soubrier J., Steel M., Lee M.S.Y., Sarkissian C.D., Guindon S., Ho S.Y.W., Cooper A. 2012. The influence of rate heterogeneity among sites on the time dependence of molecular rates. Mol. Biol. Evol. 29: 3345–3358. [DOI] [PubMed] [Google Scholar]
- Stamatakis A. 2014a. ExaBayes User’s Manual. http://sco.h-its.org/exelixis/web/software/exabayes/manual/index.html. [Google Scholar]
- Stamatakis A. 2014b. RAxML version 8: A tool for phylogenetic analysis and post-analysis of large phylogenies. Bioinformatics 30: 1312–1313. [DOI] [PMC free article] [PubMed] [Google Scholar]
- Stoev P., Komerički A., Akkari N., Liu S., Zhou X., Weigand A.M., Hostens J., Hunter C.I., Edmunds S.C., Porco D., Zapparoli M., Georgiev T., Mietchen D., Roberts D., Faulwetter S., Smith V., Penev L. 2013. Eupolybothrus cavernicolus Komerički & Stoev sp. n. (Chilopoda: Lithobiomorpha: Lithobiidae): the first eukaryotic species description combining transcriptomic, DNA barcoding and micro-CT imaging data. Biodiv. Data J. 1: e1013. [DOI] [PMC free article] [PubMed] [Google Scholar]
- Townsend J.P. 2007. Profiling phylogenetic informativeness. Syst. Biol. 56: 222–231. [DOI] [PubMed] [Google Scholar]
- Townsend J.P., Su Z., Tekle Y.I. 2012. Phylogenetic signal and noise: Predicting the power of a data set to resolve phylogeny. Syst. Biol. 61: 835–849. [DOI] [PubMed] [Google Scholar]
- Vahtera V., Edgecombe G.D., Giribet G. 2012. Evolution of blindness in scolopendromorph centipedes (Chilopoda: Scolopendromorpha): insight from an expanded sampling of molecular data. Cladistics 28: 4–20. [DOI] [PubMed] [Google Scholar]
- Vahtera V., Edgecombe G.D., Giribet G. 2013. Phylogenetics of scolopendromorph centipedes: Can denser taxon sampling improve an artificial classification? Inver. Syst. 27: 578–602. [Google Scholar]
- Verhoeff K.W.Bronn H.G. 1928. Klasse Diplopoda I. Bronn’s Klassen und Ordnungen des Tier-Reichs. Vol. 5 Gliederfüssler: Arthropoda. Leipzig: Myriapoda Akademische Verlagsgesellschaft, p. 1071. [Google Scholar]
- Waloszek D. 1993. The Upper Cambrian Rehbachiella and the phylogeny of Branchiopoda and Crustacea. Foss. Stra. 32: 1–202. [Google Scholar]
- Wanninger A. 2015. Morphology is dead - long live morphology! Integrating MorphoEvoDevo into molecular EvoDevo and phylogenomics. Fron. Ecol. Evol. 3: 54. [Google Scholar]
- Werth A.J., Shear W.A. 2014. The evolutionary truth about living fossils. Am. Sci. 102: 434–443. [Google Scholar]
- Wheeler W.C. 1990. Nucleic acid sequence phylogeny and random outgroups. Cladistics 6: 363–368. [DOI] [PubMed] [Google Scholar]
- Wiens J.J. 2003. Missing data, incomplete taxa, and phylogenetic accuracy. Syst. Biol. 52: 528–538. [DOI] [PubMed] [Google Scholar]
- Wiens J.J. 2006. Missing data and the design of phylogenetic analyses. J. Biom. Infor. 39: 34–42. [DOI] [PubMed] [Google Scholar]
- Wilson H.M. 2006. Juliformian millipedes from the Lower Devonian of Euramerica: implications for the timing of millipede cladogenesis in the Paleozoic. J. Paleontol. 80: 638–649. [Google Scholar]
- Wilson H.M., Anderson L.I. 2004. Morphology and taxonomy of Paleozoic millipedes (Diplopoda : Chilognatha : Archipolypoda) from Scotland. J. Paleontol. 78: 169–184. [Google Scholar]
- Woo H.J., Lee Y.S., Park S.J., Lim J.T., Jang K.H., Choi E.H., Choi Y.G., Hwang U.W. 2007. Complete mitochondrial genome of a troglobite millipede Antrokoreana gracilipes (Diplopoda, Juliformia, Julida), and juliformian phylogeny. Mol. Cel. 23: 182–191. [PubMed] [Google Scholar]
- Wu M., Chatterji S., Eisen J.A. 2012. Accounting for alignment uncertainty in phylogenomics. PLoS ONE 7: e30288. [DOI] [PMC free article] [PubMed] [Google Scholar]
- Wu Z.P., Wang X., Zhang X.G. 2011. Using non-uniform read distribution models to improve isoform expression inference in RNA-Seq. Bioinformatics 27: 502–508. [DOI] [PubMed] [Google Scholar]
- Yang Z., Rannala B. 2006. Bayesian estimation of species divergence times under a molecular clock using multiple fossil calibrations with soft bounds. Mol. Biol. Evol. 23: 212–226. [DOI] [PubMed] [Google Scholar]
- Zhong M., Hansen B., Nesnidal M., Golombek A., Halanych K.M., Struck T.H. 2011. Detecting the symplesiomorphy trap: a multigene phylogenetic analysis of terebelliform annelids. BMC Evol. Biol. 11: 369. [DOI] [PMC free article] [PubMed] [Google Scholar]
- Zoller S., Schneider A. 2013. Improving phylogenetic inference with a semiempirical amino acid substitution model. Mol. Biol. Evol. 30: 469–479. [DOI] [PubMed] [Google Scholar]
- Zwick A., Regier J.C., Zwickl D.J. 2012. Resolving discrepancy between nucleotides and amino acids in deep-level arthropod phylogenomics: Differentiating serine codons in 21-amino-acid models. PLoS ONE 7: e47450. [DOI] [PMC free article] [PubMed] [Google Scholar]