Abstract
Purpose
To determine the influence of volume averaging on retinal layer thickness measures acquired with spectral-domain optical coherence tomography (SD-OCT) in children.
Methods
Macular SD-OCT images were acquired using three different volume settings (i.e., 1, 3, and 9 volumes) in children enrolled in a prospective OCT study. Total retinal thickness and five inner layers were measured around an Early Treatment Diabetic Retinopathy Scale (ETDRS) grid using beta version automated segmentation software for the Spectralis. The magnitude of manual segmentation required to correct the automated segmentation was classified as either minor (<12 lines adjusted), moderate (>12 and <25 lines adjusted), severe (>26 and <48 lines adjusted), or fail (>48 lines adjusted or could not adjust due to poor image quality). The frequency of each edit classification was assessed for each volume setting. Thickness, paired difference, and 95% limits of agreement of each anatomic quadrant were compared across volume density.
Results
Seventy-five subjects (median age 11.8 years, range 4.3–18.5 years) contributed 75 eyes. Less than 5% of the 9- and 3-volume scans required more than minor manual segmentation corrections, compared with 71% of 1-volume scans. The inner (3 mm) region demonstrated similar measures across all layers, regardless of volume number. The 1-volume scans demonstrated greater variability of the retinal nerve fiber layer (RNLF) thickness, compared with the other volumes in the outer (6 mm) region.
Conclusions
In children, volume averaging of SD-OCT acquisitions reduce retinal layer segmentation errors.
Translational Relevance
This study highlights the importance of volume averaging when acquiring macula volumes intended for multilayer segmentation.
Keywords: OCT, segmentation, volume
Introduction
Spectral-domain optical coherence tomography (SD-OCT) now provides excellent visualization of all retinal layers compared with previous generations of OCT devices (i.e., time-domain). Beyond the improved resolution, many SD-OCT devices use eye tracking technology to reduce image artifacts due to eye movements and inconsistent fixation.1 These improvements now permit segmentation and quantitative measurement of discrete retinal layers using manufacturer supplied and/or custom designed segmentation software.2–5 Research on glaucomatous and nonglaucomatous optic neuropathies has demonstrated that multilayer retinal segmentation of the macula can be informative.6–12
Despite the advances in SD-OCT hardware and software, imaging pediatric patients remains challenging as their inconsistent cooperation and inability to hold fixation may reduce the operator's ability to acquire images of sufficient quality necessary for macular segmentation. Although a number of investigators have acquired total retinal thickness (TRT) measures in children,13–15 multilayer retinal segmentation across an entire volume has not been reported. Given the difficulties with children's cooperation and fixation, the time it takes to acquire a high quality SD-OCT macula volume void of artifacts must be considered. There is debate whether volume averaging decreases the variability of circumpapillary RNFL measures in adults.16,17 Multilayer segmentation of the macula is more challenging due to the varying signal intensities of each layer and less clearly defined borders between layers.
In this study, we investigated how volume averaging influenced the frequency and magnitude of macula segmentations errors from SD-OCT performed in children.
Methods
Subjects
Children undergoing SD-OCT as part of their clinical evaluation in the Neuro-Ophthalmology clinic at Children's National Medical Center, Washington, DC; between January 2013 and June 2015 were eligible for study inclusion. All subjects underwent comprehensive neuro-ophthalmic eye examinations as part of their clinical care. Subjects were included if they met all of the following criteria: (1) able to perform quantitative visual acuity testing, (2) absence of anterior segment abnormalities that would produce SD-OCT artifacts, (3) acquisition of SD-OCT macular volume scans with automatic real-time (ART) settings of 1, 3, and 9, (4) scan signal strength greater than 20 dB for all images, and (5) acquisition of the entire image volume without appreciable movement or acquisition artifact. Clinical and demographic characteristics were abstracted from the subject's clinical record. Subjects were classified as having abnormal vision if their visual acuity was greater than or equal to 0.2 logMAR above normal for age or had visual field loss.
The study adhered to the tenets of the Declaration of Helsinki and was approved by the institutional review board at Children's National Medical Center. Informed consent was obtained from the parent/legal guardian. All data collected was Health Insurance Portability and Accountability Act compliant.
Image Acquisition and Segmentation
SD-OCT volume scans were obtained for all subjects using the Spectralis Nsite Analytics (V. 5.6.3.0) software with the TruTrack eye tracking technology (Heidelberg Engineering GmbH, Heidelberg, Germany). Each subject contributed only one study eye. All scans, regardless of the number of volumes (i.e., ART settings of 1, 3, and 9), were acquired in high-speed mode utilizing 768 a-scans per b-scan, over a 9.2 × 7.6 mm (30° × 25°) region, centered on the fovea. Sixty-one horizontal b-scans were acquired in each volume producing a 120 μm gap between b-scans. Once all scans were captured from both eyes, they were immediately reviewed by a single operator (CTH) to ensure they were void of any imaging artifacts. Scans with significant mirror or edge artifacts were discarded and the subject was rescanned. Any scan with a quality score less than 20 dB was excluded from analysis.
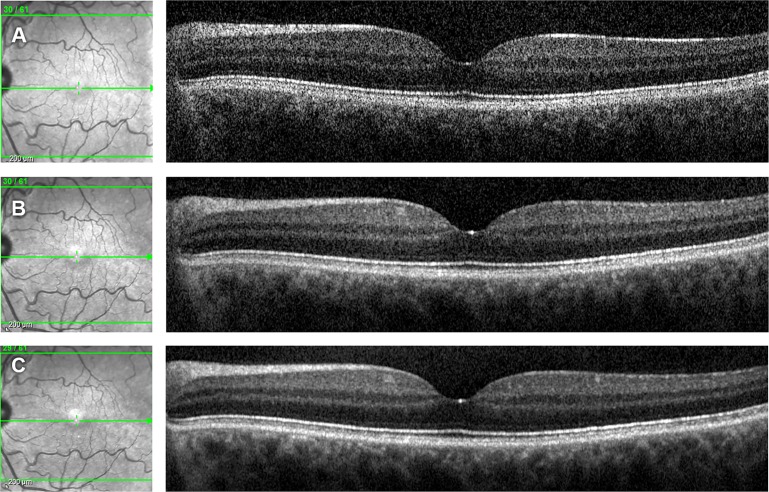
All subjects underwent three different volume scans, each with an ART mean setting of 1, 3, and 9. The ART mean creates a single image by averaging multiple b-scans across the frame. Scans with an ART of 1 acquire a single b-scan at 61 sections across the volume. Scans with ART settings of 3 or 9 would acquire each horizontal b-scan multiple times (i.e., 3 or 9) over the frame and average them together. As the ART increases, the image noise is reduced resulting in higher quality images (Fig. 1).
Figure 1.
Representative scans with and without volume averaging. (A) Single volume scan (ART of 1). (B) Scan with three volumes averaged (ART of 3). (C) Scan with 9 volumes averaged (ART of 9).
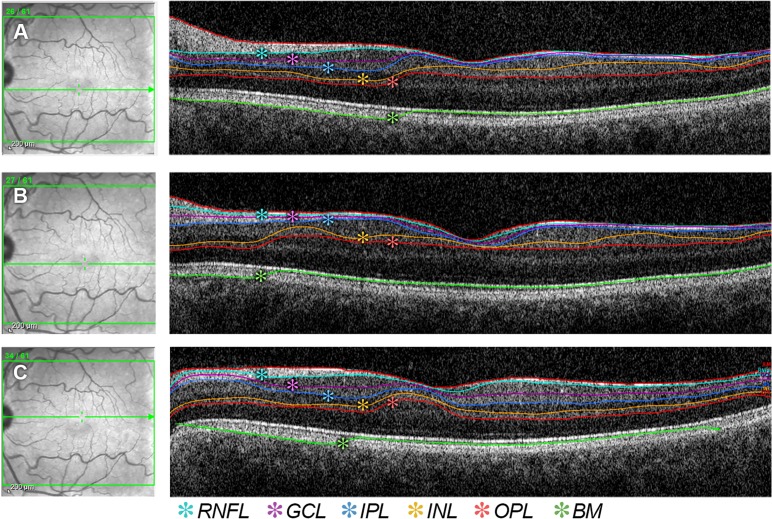
Scans that qualified for analysis were processed using beta version segmentation software supplied by the manufacturer. This software uses a proprietary algorithm to automatically segment the different layers of the retina including the retinal nerve fiber layer (RNFL), ganglion cell layer (GCL), inner and outer plexiform layers (IPL/OPL), inner and outer nuclear layers (INL/ONL), and outer retinal layers including the RPE and Bruch's complex (Fig. 2). Each of the 61 b-scan frames of the volume were reviewed for segmentation errors by one reviewer (KV) who was blinded to all clinical information. If the layer was segmented incorrectly (Fig. 3), the reviewer manually adjusted the segmentation. After all segmentation errors were corrected, the individual layer thickness measures were calculated for the anatomic quadrants (superior, inferior, nasal, and temporal) of the inner (3 mm) and outer (6 mm) regions of the Early Treatment Diabetic Retinopathy Study (ETDRS) grid. Quadrants with clipping artifact involving more than one b-scan were eliminated from the analysis.
Figure 2.
Multilayer retinal segmentation. The RNFL is defined between the borders of the inner limiting membrane (ILM) and GCL; GCL between the RNFL and IPL; IPL between the GCL and INL; INL between the IPL and OPL; and OPL between the INL and ONL. BM, Bruch's membrane.
Figure 3.
Examples of moderate automated segmentation errors, requiring manual correction, occurring in a single volume (ART of 1) scan.
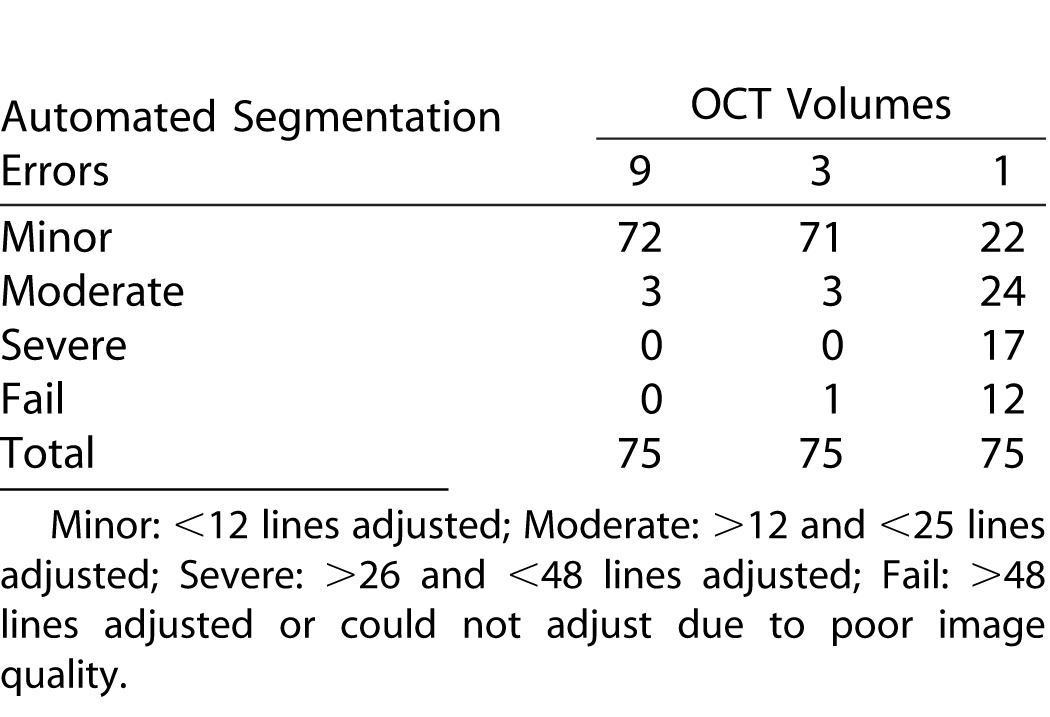
The magnitude of manual segmentation required to correct the automated segmentation was classified as either minor (<12 segmentation lines adjusted, see Fig. 4), moderate (>12 and <25 lines adjusted), severe (>26 and <48 lines adjusted), or fail (>48 lines adjusted or could not discriminate the layers due to low quality sections). The frequency of each edit classification was assessed for each volume density.
Figure 4.
Example of an automated segmentation error, requiring a minor amount of manual correction, occurring in a 3-volume (ART of 3) scan.
Statistics
Standard descriptive statistics were used to summarize clinical and demographic characteristics. Thickness, paired difference, and 95% limits of agreement of each anatomic quadrant were compared across volumes. Shapiro-Wilk testing assessed normality and Wilcoxon rank-sum test was used to compare the paired differences among volume scans, adjusting for multiple comparisons (significance adjusted to P < 0.001). Linear regression models assess the impact of vision loss on differences between volume types.
Results
Seventy-five subjects with a median age of 11.8 years (range 4.3–18.5 years) contributed 75 subject eyes. A little more than half were female (42/75, 56%) and most were Caucasian (59/75, 79%) or Black (13/75, 17%) of non-Hispanic ethnicity (68/75, 91%). Of subjects, 85% (64/75) had normal visual acuity, whereas 15% (11/75) had vision loss.
The scan quality score was not significantly different between the 1- (33.0 ± 3.5), 3- (33.1 ± 3.4), and 9-volume (32.7 ± 3.3) scans (Z = 0.028, P = 0.97; Z = −0.574, P = 0.56, respectively). Single volume scans (ART of 1) demonstrated far more failures classified as moderate and severe using the automated segmentation (Table 1). Only one (1.3%) of three volume scans (ART of 3) and none of the 9-volume scans (ART of 9) had a total failure in segmentation. Less than 5% of the 9- and 3-volume scans required more than minor manual segmentation corrections, compared with 71% of 1-volume scans. Of 13 scans that failed despite demonstrating good image quality, only three came from patients with visual acuity loss, while the other 10 subjects had normal visual function and structural examinations. Post-hoc analysis demonstrated that RNFL thickness at any anatomic quadrant did not influence the magnitude or rate of algorithm failure (P > 0.05, all comparisons). Regression analysis failed to demonstrate a significant influence of vision loss on the paired differences across all retinal layers (P > 0.05, all comparisons).
Table 1.
Magnitude and Frequency of Automated Segmentation Errors Requiring Manual Correction in Children Undergoing SD-OCT of Different Volumes
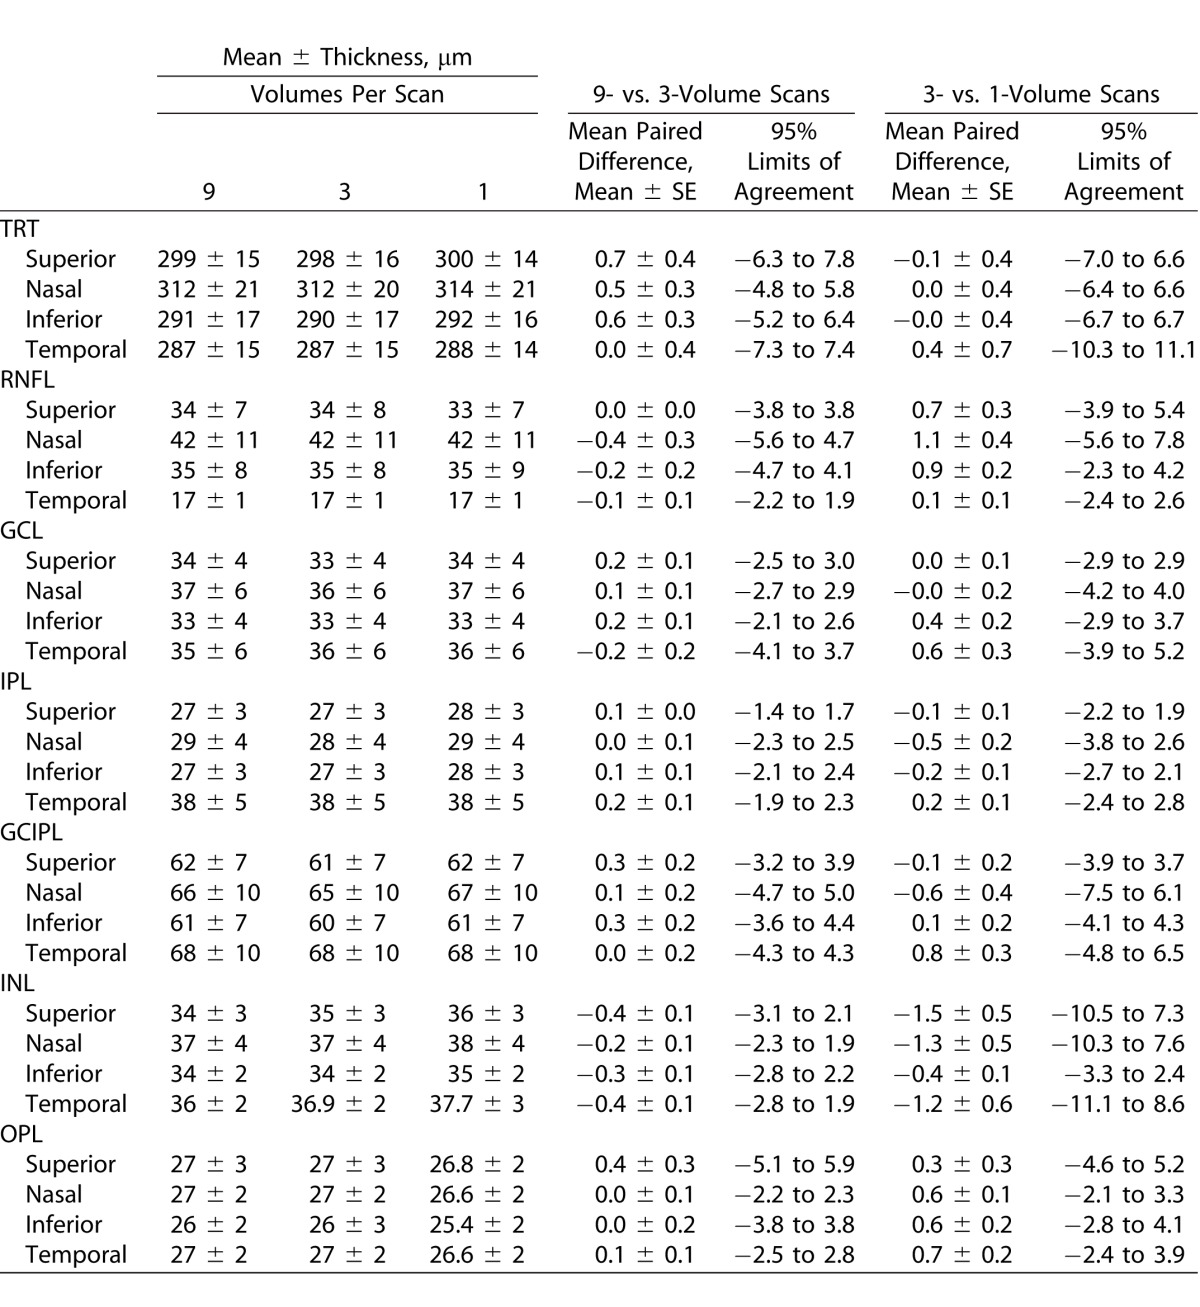
The mean thickness and mean paired differences, calculated after the manual corrections were performed, were similar across all layers for both the inner 3-mm circle (Table 2) and outer 6-mm circle of the ETDRS grid (Table 3). When comparing volumes (i.e., 1 vs. 3 volume, and 3 vs. 9 volume), none of the retinal layers thickness measures or mean paired differences were statistically different (P > 0.001, all comparisons). On average, the mean paired difference was less than 1 micron between volume types. The 95% limits of agreements demonstrated the greatest amount of variability in the INL and OPL.
Table 2.
Comparison of Inner Region (3 mm) Retinal Layer Thickness Measures by Volume Density Using Eye-Tracking with SD-OCT in Children
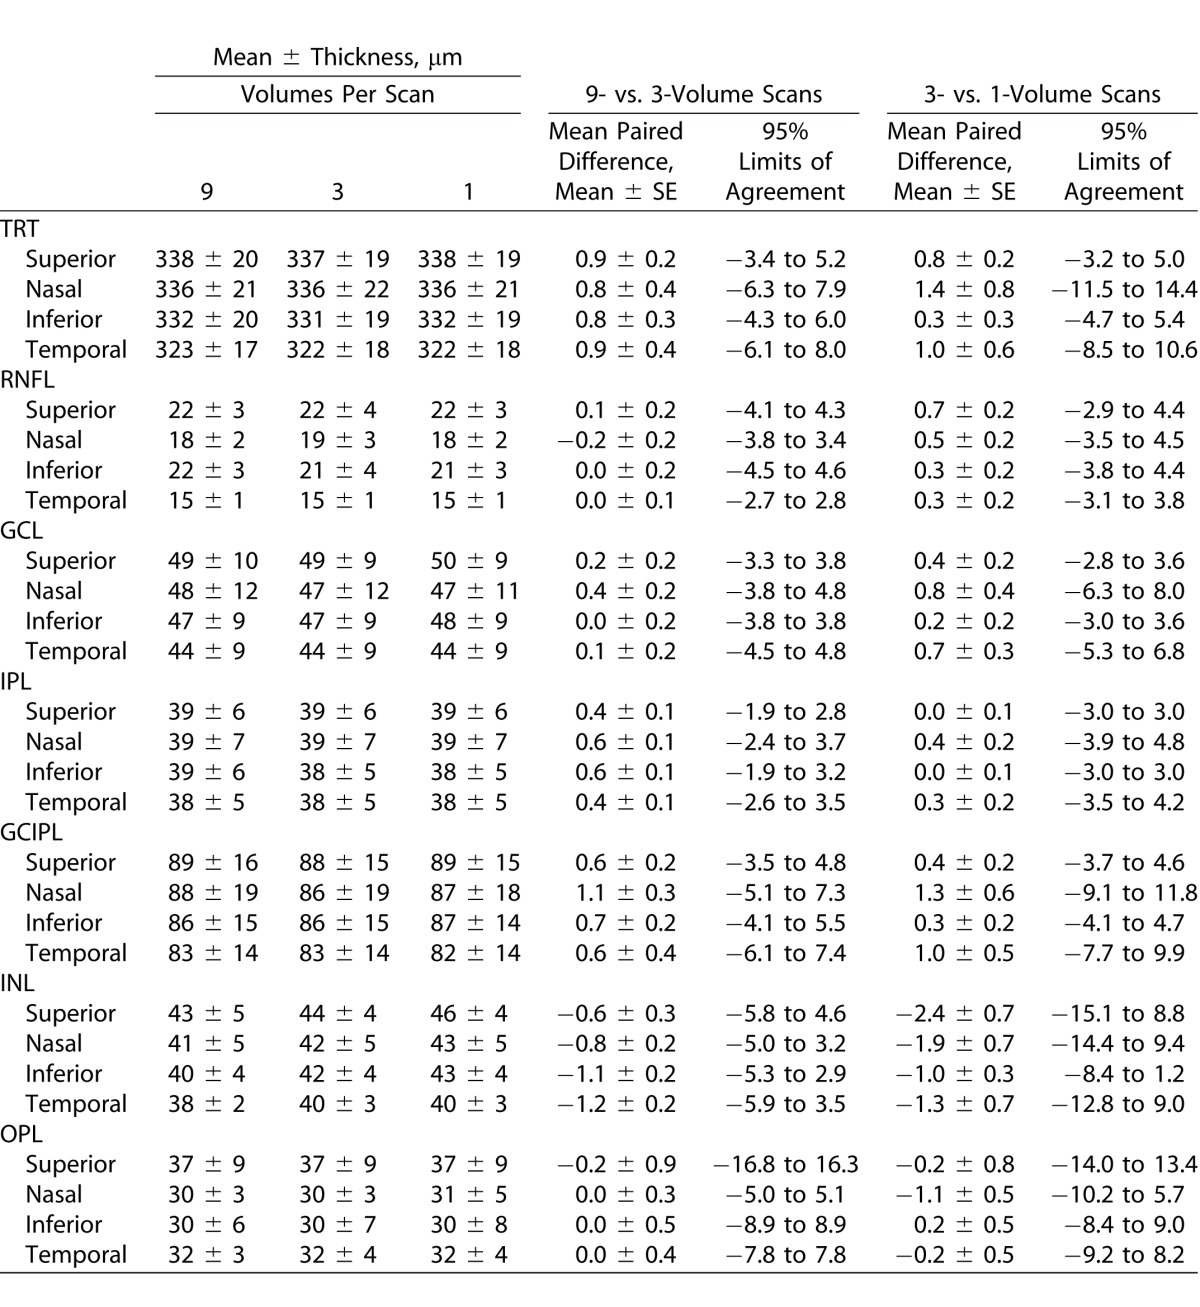
Table 3.
Comparison of Outer Region (6 mm) Retinal Layer Thickness Measures by Volume Density Using Eye-Tracking with SD-OCT in Children
Discussion
The resolution and speed of SD-OCT imaging now permits segmentation and quantitative measurement of multiple retinal layers. In the current study, we compared the frequency of automated segmentation errors between macula SD-OCT scans with and without volume averaging. Macular volumes without averaging (i.e., single volume designated by ART setting of 1) demonstrated the highest frequency of segmentation errors requiring manual correction. Once these single volume scans were manually corrected, some of the results were similar to 3- and 9-volume scans (ART setting of 3 and 9, respectively). Of our 1-volume scans, 15% failed automated segmentation completely despite having the appearance of a good acquisition and having an acceptable image quality score. Volumes with averaging (i.e., 3 and 9) required much less manual correction of the segmentation results. While the 3- and 9-volume scans did require some manual adjustments, they tended to be quite minor.
A majority of previously published studies have performed either total retinal thickness or isolated GCL-IPL measures using either automated or manual segmentation methods.3,6,7,13,14,18–21 Even though manual segmentation may provide reliable results, it is time consuming and not practical to perform during a busy clinic.9,19 When automated segmentation produces a small number of segmentation errors that need manual correction, some authors believe doing so is feasible in the clinical setting.20
Using the same SD-OCT device as in our study, Waldstein and colleagues20 imaged a 1-mm region centered over the fovea using raster lines and discovered that segmentation errors occurred in 48% of cases. This rate of correction is much lower than our 1-volume scans, and much higher than our 3- and 9-volume scans. We suspect that differences in scan acquisition parameters such as b-scan orientation (i.e., raster versus volume), b-scan number (i.e., 49 vs. 61), and number of a-scans per b-scan (512 vs. 768) could have contributed to differences in segmentation errors between studies. On the other hand, the mean difference and limits of agreements for our TRT measures were similar to investigators who reported virtually no segmentation errors when using scans with lots of averaging (i.e., 10 volumes) in volumes with fewer (i.e., 25) and greater number of b-scans (i.e., 49 and 97).22
Multilayer retinal segmentation rather than total retinal thickness measures is needed to provide the most comprehensive imaging evaluation—especially in the clinical setting. Investigators are now using automated software algorithms to segment multiple retinal layers, although most are custom made rather than provided by the manufacturer.4,23–25 Chiu and colleagues4 have demonstrated reliable and accurate 8-layer automated retinal segmentation that outperforms the variability of manual segmentation.
A small number of studies have used SD-OCT to perform quantitative retinal segmentation in children.9,13–15,26 Using the same OCT-device as in our study, investigators did not perform volume averaging, but instead acquired single volume scans using a wide range of b-scans (i.e., 13–61) to only measure total retinal thickness.13–15 To our knowledge, no prior pediatric studies have evaluated the impact of volume averaging on segmentation of inner retinal layers.
Our results highlight a number of important factors when choosing a SD-OCT imaging protocol for both clinical and research applications in children. First, we demonstrated that 3-volume scans, which are acquired in one-third the time of a 9-volume scan, required the same amount of manual adjustment to the segmentation. This reduction in SD-OCT acquisition time may improve success as even adult subjects are known to experience fatigue when undergoing SD-OCT imaging.20 Secondly, despite the excellent resolution of SD-OCT, automated segmentation of inner retinal layers using 1-volume scans performed poorly. Although the 1-volume scans had the shortest acquisition time, the time needed to perform manual adjustment is just not practical in the clinical setting. Acquisition time also depends on the number of b-scans per volume. Others have acquired fewer b-scans than used in our study, thereby decreasing acquisition time, although this subsequently increases the space and interpolation between scans, which may miss subtle changes.22 All of the above factors need to be considered when designing clinical and research imaging protocols that are feasible for both younger and older children as many pediatric ophthalmologic conditions present across a wide age spectrum. But, most importantly, all SD-OCT automated segmentation results should be for reviewed for errors.
Our study had a number of limitations that should be considered when interpreting our results.
The magnitude of segmentation errors were categorized rather than calculated as a continuous variable, possibly obscuring some subtle differences among those classified as needing minor adjustments. Also, we did not determine the frequency of manual segmentation required for specific retinal layers. Qualitatively, the borders of the GCL, IPL, and INLs required the most manual adjustments. SD-OCT acquisitions were immediately repeated in those children whose images appeared to be of poor technical quality as this is typical in clinical practice. It is important to note that this study was not designed to determine the success rate in acquiring SD-OCT in children, but instead assessed the impact of volume averaging on automated segmentation. Lastly, our protocol acquired a large number of b-scans, thereby increasing the opportunity for the automated segmentation to fail and require manual adjustment.
In conclusion, our study demonstrated that single volume SD-OCT scans resulted in many more automated segmentation errors than volumes that used frame averaging. There was no appreciable difference in thickness measures between those with 3 or 9 volumes, thereby arguing that greater volume averaging is unnecessary.
Acknowledgments
Supported by grants from the National Eye Institute, Bethesda, Maryland (K23-EY022673, RAA), the Gilbert Family Neurofibromatosis Institute, Washington, DC (RAA), and by the Gill Fellowship Program at The George Washington University School of Medicine (KV).
Disclosure: C. Trimboli-Heidler, None; K. Vogt, None; R.A. Avery, None
References
- 1. Costa AM,, Costa RA,, Melo LA, Jr,, Calucci D,, Orefice JL,, Cronemberger S. Influence of the eye-tracking-based follow-up function in retinal nerve fiber layer thickness using Fourier-domain optical coherence tomography. Invest Ophthalmol Vis Sci. 2013; 54: 1958–1963. [DOI] [PubMed] [Google Scholar]
- 2. Ishikawa H,, Stein DM,, Wollstein G,, Beaton S,, Fujimoto JG,, Schuman JS. Macular segmentation with optical coherence tomography. Invest Ophthalmol Vis Sci. 2005; 46: 2012–2017. [DOI] [PMC free article] [PubMed] [Google Scholar]
- 3. Lee K,, Kwon YH,, Garvin MK,, Niemeijer M,, Sonka M,, Abramoff MD. Distribution of damage to the entire retinal ganglion cell pathway: quantified using spectral-domain optical coherence tomography analysis in patients with glaucoma. Arch Ophthalmol. 2012; 130: 1118–1126. [DOI] [PMC free article] [PubMed] [Google Scholar]
- 4. Chiu SJ,, Li XT,, Nicholas P,, Toth CA,, Izatt JA,, Farsiu S. Automatic segmentation of seven retinal layers in SDOCT images congruent with expert manual segmentation. Opt Express. 2010; 18: 19413–19428. [DOI] [PMC free article] [PubMed] [Google Scholar]
- 5. Lee JY,, Chiu SJ,, Srinivasan PP,, et al. Fully automatic software for retinal thickness in eyes with diabetic macular edema from images acquired by cirrus and spectralis systems. Invest Ophthalmol Vis Sci. 2013; 54: 7595–7602. [DOI] [PMC free article] [PubMed] [Google Scholar]
- 6. Le PV,, Tan O,, Chopra V,, et al. Regional correlation among ganglion cell complex, nerve fiber layer, and visual field loss in glaucoma. Invest Ophthalmol Vis Sci. 2013; 54: 4287–4295. [DOI] [PMC free article] [PubMed] [Google Scholar]
- 7. Jiramongkolchai K,, Freedman SF,, El-Dairi MA. Retinal changes in pediatric glaucoma and nonglaucomatous optic atrophy. Am J Ophthalmol. 2015; 161: 188–195. [DOI] [PubMed] [Google Scholar]
- 8. Walter SD,, Ishikawa H,, Galetta KM,, et al. Ganglion cell loss in relation to visual disability in multiple sclerosis. Ophthalmology. 2012; 119: 1250–1257. [DOI] [PMC free article] [PubMed] [Google Scholar]
- 9. Gu S,, Glaug N,, Cnaan A,, Packer RJ,, Avery RA. Ganglion cell layer-inner plexiform layer thickness and vision loss in young children with optic pathway gliomas. Invest Ophthalmol Vis Sci. 2014; 55: 1402–1408. [DOI] [PMC free article] [PubMed] [Google Scholar]
- 10. Auinger P,, Durbin M,, Feldon S,, et al. Baseline OCT measurements in the idiopathic intracranial hypertension treatment trial, part I: quality control, comparisons, and variability. Invest Ophthalmol Vis Sci. 2014; 55: 8180–8188. [DOI] [PMC free article] [PubMed] [Google Scholar]
- 11. Aggarwal D,, Tan O,, Huang D,, Sadun AA. Patterns of ganglion cell complex and nerve fiber layer loss in nonarteritic ischemic optic neuropathy by Fourier-domain optical coherence tomography. Invest Ophthalmol Vis Sci. 2012; 53: 4539–4545. [DOI] [PMC free article] [PubMed] [Google Scholar]
- 12. Barboni P,, Savini G,, Cascavilla ML,, et al. Early macular retinal ganglion cell loss in dominant optic atrophy: genotype-phenotype correlation. Am J Ophthalmol. 2014; 158: 628–636. 636, e623. [DOI] [PubMed] [Google Scholar]
- 13. Yanni SE,, Wang J,, Cheng CS,, et al. Normative reference ranges for the retinal nerve fiber layer, macula, and retinal layer thicknesses in children. Am J Ophthalmol. 2013; 155: 354–360. [DOI] [PMC free article] [PubMed] [Google Scholar]
- 14. Turk A,, Ceylan OM,, Arici C,, et al. Evaluation of the nerve fiber layer and macula in the eyes of healthy children using spectral-domain optical coherence tomography. Am J Ophthalmol. 2012; 153: 552–559. [DOI] [PubMed] [Google Scholar]
- 15. Ghasia FF,, El-Dairi M,, Freedman SF,, Rajani A,, Asrani S. Reproducibility of spectral-domain optical coherence tomography measurements in adult and pediatric glaucoma. J Glaucoma. 2015; 24: 55–63. [DOI] [PubMed] [Google Scholar]
- 16. Pemp B,, Kardon RH,, Kircher K,, Pernicka E,, Schmidt-Erfurth U,, Reitner A. Effectiveness of averaging strategies to reduce variance in retinal nerve fibre layer thickness measurements using spectral-domain optical coherence tomography. Graefes Arch Clin Exp Ophthalmol. 2013; 251: 1841–1848. [DOI] [PubMed] [Google Scholar]
- 17. Ye C,, Lam DS,, Leung CK. Retinal nerve fiber layer imaging with spectral-domain optical coherence tomography: effect of multiple B-scan averaging on RNFL measurement. J Glaucoma. 2012; 21: 164–168. [DOI] [PubMed] [Google Scholar]
- 18. Garvin MK,, Lee K,, Burns TL,, Abramoff MD,, Sonka M,, Kwon YH. Reproducibility of SD-OCT-based ganglion cell-layer thickness in glaucoma using two different segmentation algorithms. Invest Ophthalmol Vis Sci. 2013; 54: 6998–7004. [DOI] [PMC free article] [PubMed] [Google Scholar]
- 19. Davies EC,, Galetta KM,, Sackel DJ,, et al. Retinal ganglion cell layer volumetric assessment by spectral-domain optical coherence tomography in multiple sclerosis: application of a high-precision manual estimation technique. J Neuroophthalmol. 2011; 31: 260–264. [DOI] [PMC free article] [PubMed] [Google Scholar]
- 20. Waldstein SM,, Gerendas BS,, Montuoro A,, Simader C,, Schmidt-Erfurth U. Quantitative comparison of macular segmentation performance using identical retinal regions across multiple spectral-domain optical coherence tomography instruments. Br J Ophthalmol. 2015; 99: 794–800. [DOI] [PubMed] [Google Scholar]
- 21. Oberwahrenbrock T,, Weinhold M,, Mikolajczak J,, et al. Reliability of intra-retinal layer thickness estimates. PLoS One. 2015; 10: e0137316. [DOI] [PMC free article] [PubMed] [Google Scholar]
- 22. Wenner Y,, Wismann S,, Jager M,, Pons-Kuhnemann J,, Lorenz B. Interchangeability of macular thickness measurements between different volumetric protocols of Spectralis optical coherence tomography in normal eyes. Graefes Arch Clin Exp Ophthalmol. 2011; 249: 1137–1145. [DOI] [PubMed] [Google Scholar]
- 23. Saidha S,, Syc SB,, Ibrahim MA,, et al. Primary retinal pathology in multiple sclerosis as detected by optical coherence tomography. Brain. 2011; 134: 518–533. [DOI] [PubMed] [Google Scholar]
- 24. Sotirchos ES,, Seigo MA,, Calabresi PA,, Saidha S. Comparison of point estimates and average thicknesses of retinal layers measured using manual optical coherence tomography segmentation for quantification of retinal neurodegeneration in multiple sclerosis. Curr Eye Res. 2013; 38: 224–228. [DOI] [PMC free article] [PubMed] [Google Scholar]
- 25. Seigo MA,, Sotirchos ES,, Newsome S,, et al. In vivo assessment of retinal neuronal layers in multiple sclerosis with manual and automated optical coherence tomography segmentation techniques. J Neurol. 2012; 259: 2119–2130. [DOI] [PubMed] [Google Scholar]
- 26. Avery RA,, Cnaan A,, Schuman JS,, et al. Intra- and inter-visit reproducibility of ganglion cell-inner plexiform layer measurements using handheld optical coherence tomography in children with optic pathway gliomas. Am J Ophthalmol. 2014; 158: 916–923. [DOI] [PMC free article] [PubMed] [Google Scholar]


