

Supplemental Digital Content is available in the text
Abstract
There is no study that investigates the potential correlation between the heterogeneity obtained from texture analysis of medical images and the heterogeneity observed from histopathological findings. We investigated whether texture analysis of magnetic resonance images correlates with histopathological findings.
Seventy-five patients with estrogen receptor positive invasive ductal carcinoma who underwent preoperative breast magnetic resonance imaging (MRI) were included. Tumor entropy and uniformity were determined on T2- and contrast-enhanced T1-weighted subtraction images under different filter levels. Two pathologists evaluated the detailed histopathological findings of the tumors including tumor cellularity, dominant stroma type, central scar, histologic grade, extensive intraductal component (EIC), and lymphovascular invasion. Entropy and uniformity values on both T2- and contrast-enhanced T1-weighted subtraction images were compared with detailed pathological findings.
In a multivariate analysis, entropy significantly increased only on unfiltered T2-weighted images (P = 0.013). Tumor cellularity and predominant stroma did not affect the uniformity or entropy on both T2- and contrast-enhanced T1-weighted subtraction images. High histologic grades showed increased uniformity and decreased entropy on contrast-enhanced T1-weighted subtraction images, whereas the opposite tendency was observed on T2-weighted images. Invasive ductal carcinoma with an EIC or lymphovascular invasion only affected the contrast-enhanced T1-weighted subtraction images, through increased uniformity and decreased entropy. The best uniformity results were recorded on T2- and contrast-enhanced T1-weighted subtraction images at a filter level of 0.5. Entropy showed the best results at a filter level of 0.5 on contrast-enhanced T1-weighted subtraction images. However, on T2-weighted images, an ideal model was achieved on unfiltered images.
MRI texture analysis correlated with pathological tumor heterogeneity.
INTRODUCTION
Texture analysis refers to the characterization of regions in an image by their texture content. Tissue characterization is based on the spatial distribution and signal intensity of each pixel in the area, interpreted through the calculation of mathematical texture features.1
To date, numerous studies have conducted texture analyses across a variety of clinical settings using different imaging modalities and on a wide range of organs.2–4 Many of these have typically been performed for the characterization of lesions in different organs. For example, Son et al observed significantly reduced uniformity and increased entropy in an incremental manner from adenocarcinomas in situ to minimally invasive adenocarcinomas, and entropy was found to be an independent predictor for invasive adenocarcinoma from both univariate and multivariate analyses.5 In general, increased heterogeneity (higher entropy and lower uniformity) is associated with malignancy in nonsmall cell lung cancer,6 colorectal cancer,7 and renal cell cancer.8 In breast imaging, texture analysis using magnetic resonance imaging (MRI) has been used to detect microcalcifications,9 to differentiate between benign and malignant lesions10–12 or between invasive ductal and invasive lobular carcinomas,13 and to predict response to neoadjuvant chemotherapy.14,15
Breast cancer is a highly heterogeneous disease that exhibits various morphologies, responses to therapy, and patient outcomes. Pathologically, heterogeneity is a well-recognized feature of malignancy that reflects areas of high cell density, necrosis, hemorrhage, and myxoid changes.16 Based on the findings from previous studies, we questioned whether tumor heterogeneity obtained from MRI texture analysis correlates with tumor heterogeneity observed from histopathological findings including the tumor grade, tumor cellularity, and dominant stroma types. However, to the best of our knowledge, no previous studies have investigated the potential correlation between the heterogeneity obtained from texture analysis of medical images and the heterogeneity observed from histopathological findings. If texture analysis is validated as a feasible tool for evaluating tumor heterogeneity by reflecting pathological tumor heterogeneity, we could use this information to predict patient outcomes, monitor treatment responses, and to assist in the progression of individualized therapy without the need of additional imaging or invasive procedures.
Therefore, the aim of this study was to investigate whether whole-tumor texture analysis of MRI on T2- and contrast-enhanced T1-weighted subtraction images correlates with histopathological heterogeneity.
MATERIALS AND METHODS
Patients
Institutional Review Board approval with waiver of informed consent was obtained for this study.
Between October 2013 and February 2014, we obtained the histopathological results of 261 invasive breast carcinomas. We intended to evaluate the effect of texture parameters in a homogeneous condition to exclude the effects of other factors that could potentially influence texture values such as molecular subtype, MRI findings, and pathological type. Therefore, the lesions included in the study were restricted to those that met the following criteria: (1) estrogen receptor (ER)-positive breast cancer (ie, estrogen or progesterone receptor-positive and human epidermal growth factor receptor 2 [HER2]-negative); (2) the final pathological diagnosis was an invasive ductal carcinoma not otherwise specified (IDC NOS); and (3) presented as a mass on MRI. We identified 210 invasive breast cancers that met these criteria. We excluded cases in which MRI was performed after diagnosis by vacuum-assisted biopsy or excisional biopsy (n = 18). Patients treated with neoadjuvant chemotherapy (n = 7) and those who underwent breast MRI using a 3-T scanner (n = 110) were also excluded. Finally, 75 cancers from 75 women aged 26 to 78 years (mean, 51 years) were included in this study.
MRI Protocol
The MRIs for the subjects considered for inclusion in this retrospective study were performed using a 1.5-T Achieva scanner (Philips Medical Systems, Best, The Netherlands) with a dedicated bilateral phased array breast coil. Images of both breasts were acquired with the patient in the prone position. MRI examination consisted of turbo spin-echo T1- and T2-weighted sequences, and a 3-dimensional dynamic contrast-enhanced (DCE) sequence. The imaging parameters for the T2-weighted images were as follows: TR/TE, 3800/120; slice thickness, 1.5 mm; matrix size, 376 × 358 pixels; and field of view, 30 cm. The DCE-MRI scans utilized the following parameters: TR/TE, 6.5/2.5; slice thickness, 1.5 mm; flip angle, 10°; matrix size, 376 × 374; and field of view, 32 cm × 32 cm. DCE-MRI was performed using axial imaging, with 1 precontrast and 6 postcontrast dynamic series. Contrast-enhanced images were acquired at 30, 90, 150, 210, 270, and 330 s after contrast injection. Image subtraction was performed after the dynamic series. A 0.1 mmol/kg bolus of gadobutrol (Gadovist; Bayer Healthcare Pharmaceutical, Berlin, Germany) was injected followed by a 20 mL saline flush.
Assessment of MR Imaging Heterogeneity
The T2- and contrast-enhanced T1-weighted subtraction MRIs were retrieved from the Picture Archiving Communication System and loaded to a workstation for further texture analysis. Subtraction images from contrast-enhanced images at 90 s to pre-enhanced images were selected for this study. The MR images were reviewed by 1 study radiologist with 9 years of experience in breast MRI who was blinded to the clinical and pathological findings but was aware of the IDC diagnosis. A region of interest (ROI) was drawn around the entire visible tumor on T2- and contrast-enhanced T1-weighted subtraction images. The ROI was drawn as large as possible to avoid a partial volume effect. Tumor size (the largest diameter of the tumor) was measured in the first phase of the contrast-enhanced MRI acquisition. In the case of multifocal or multicentric disease, the largest tumor was selected as the index cancer.
After the ROIs were defined, a researcher with 7 years of experience in image analysis who was also blinded to the clinical and pathological results performed the texture analysis. We applied Gaussian spatial filters onto the images to focus on different pixel sizes. Filters 0.5 to 1.0 highlighted fine-texture features (2 and 4 pixels), filters 1.5 to 2.0 highlighted medium-texture features (6 and 10 pixels), and a filter of 2.5 highlighted coarse-texture features (12 pixels). The effect of filtration, by highlighting larger pixels, has been hypothesized to accentuate the contribution of the vasculature to texture features (Figure 1).15
FIGURE 1.
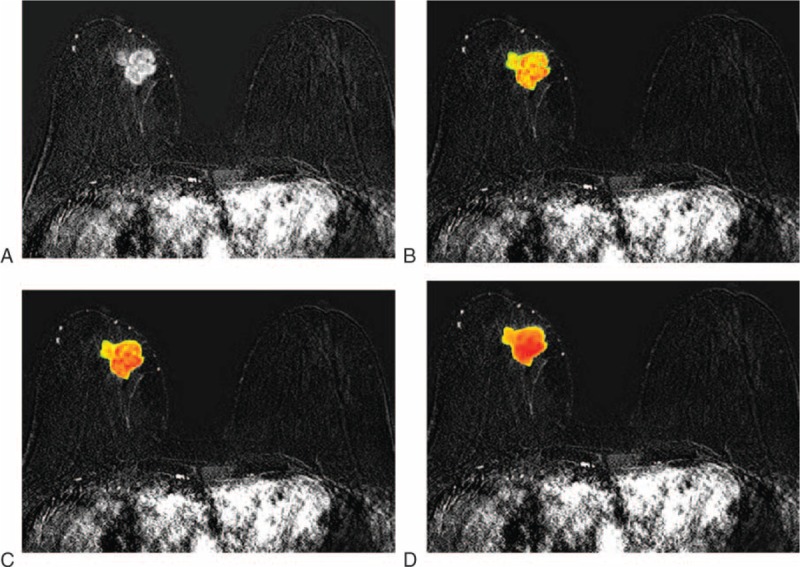
Axial contrast-enhanced T1-weighted subtraction images show an example of texture analysis using different filter levels in a 67-year-old woman with a 36-mm invasive ductal carcinoma of the right breast: (A) conventional image without filter; (B) at a filter level of 0.5; (C) at a filter level of 1.5; (D) at a filter level of 2.
Voxel intensities within manually defined ROI were resampled to yield a finite range of values using the following equation:
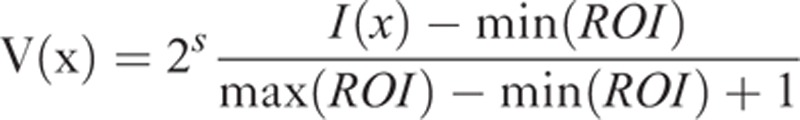 |
where 2s represents the number of discrete values (in this study, s = 8), I is the intensity of the original T1- or T2-weighted MR images, min (ROI) is the minimum intensity value within ROI, and max (ROI) is the maximum intensity value within ROI. Heterogeneity within the ROI was quantified with and without image filtration, calculating entropy (irregularity) and uniformity (distribution of gray level).8 Entropy is a measure of texture irregularity, whereas uniformity reflects how close the image is to a uniform distribution of the gray levels: higher entropy and lower uniformity represent greater heterogeneity (Figures 2 and 3).8 Entropy and uniformity were defined using the following equations:
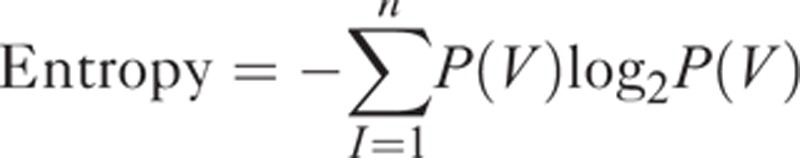 |
FIGURE 2.
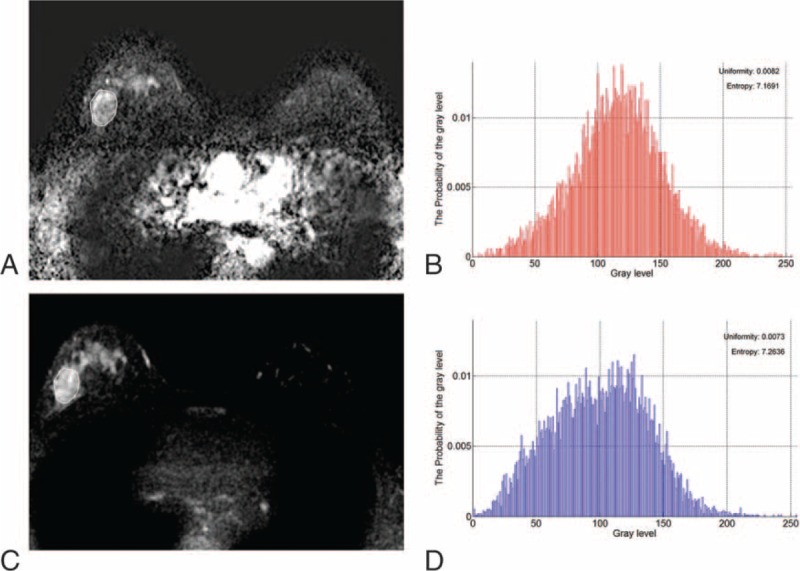
Axial magnetic resonance images show an example of texture analysis in a 50-year-old woman with an invasive ductal carcinoma of the right breast. Pathology revealed histologic grade 3 tumor exhibiting 90% cellularity, EIC, and lymphovascular invasion. (A) Axial contrast-enhanced T1-weighted subtraction image shows an 18-mm irregular mass. (B) Histogram obtained from entire tumor on contrast-enhanced T1-weighted subtraction image presents uniformity and entropy. (C) T2-weighted image at the same level as (A). (D) Histogram obtained from entire tumor on the T2-weighted image exhibits uniformity and entropy. EIC = extensive intraductal component.
FIGURE 3.
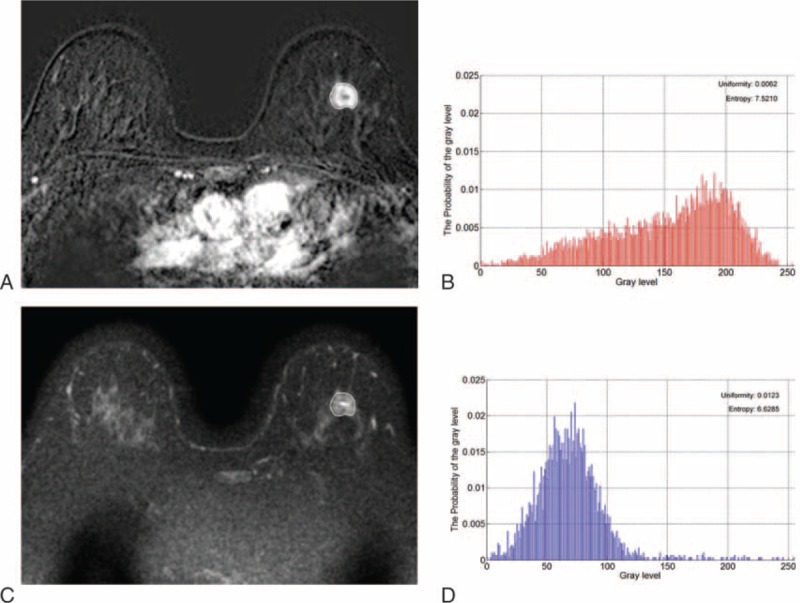
Axial magnetic resonance images show another example of texture analysis in a 53-year-old woman with an invasive ductal carcinoma of the left breast. Pathology revealed histologic grade 1 tumor exhibiting 20% cellularity. EIC or lymphovascular invasion was not recognized. (A) Axial contrast-enhanced T1-weighted subtraction image shows an 18-mm irregular mass. (B) Histogram obtained from entire tumor on the contrast-enhanced T1-weighted subtraction image exhibits uniformity and entropy. (C) T2-weighted image at the same level as (A). (D) Histogram obtained from entire tumor on the T2-weighted image presents uniformity and entropy. EIC = extensive intraductal component.
and
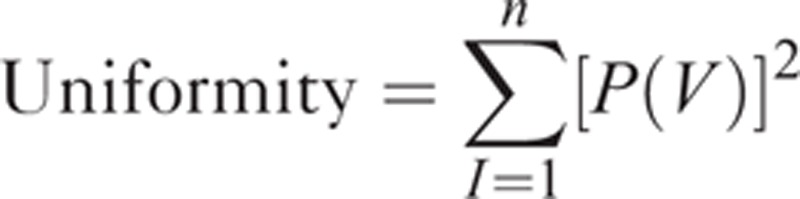 |
where V is the resampled gray level with factor of 8, ranging from 0 to 255, and P(V) is the gray level occurrence probability. To analyze texture features on magnetic resonance images in a tumor region, custom software was implemented using MATLAB R2009a (The Mathworks, Natick, MA).
Pathological Analysis
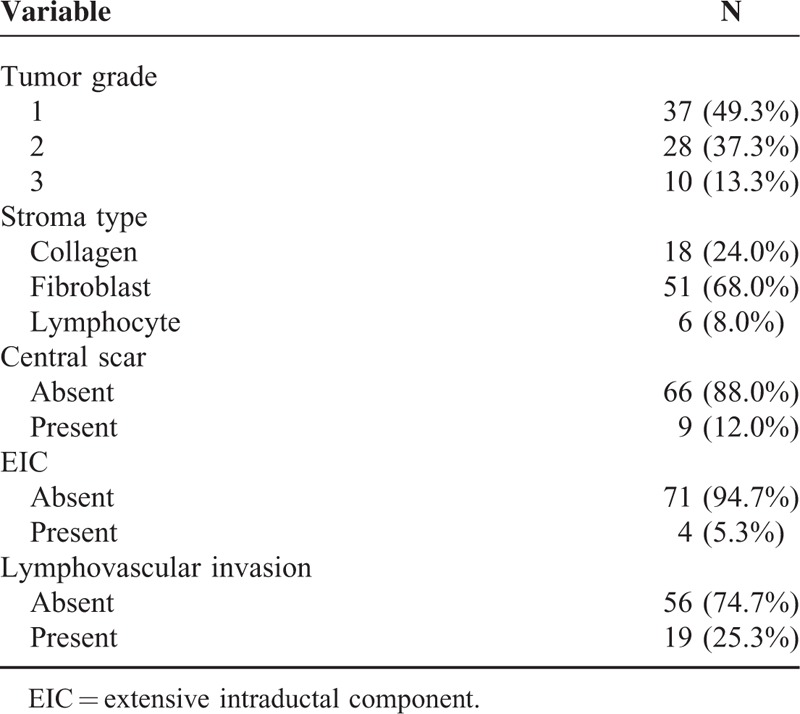
For this study, 2 experienced pathologists, who were blinded to the texture values, retrospectively evaluated the following features in consensus: (1) tumor cellularity (%), (2) predominant stroma component, and (3) presence of central scar. The tumor size, the histologic grade, the presence of extensive intraductal component (EIC), and lymphovascular invasion were also evaluated. The method to quantify tumor cellularity has been described previously.17,18 Collagen-dominant stroma was defined as the stroma comprised of broad bands of eosinophilic, hyalinized collagen. Fibroblast-dominant stroma was defined as stroma containing randomly oriented immature collagen in a myxoid background. The carcinomas with desmoplasia were classified into the fibroblastic stroma group. Lymphocyte-dominant stroma was predominantly composed of lymphocytes. A central scar was defined as a characteristic tumor stroma with scar-like features or a radiating fibrosclerotic core surrounded by invasive ductal carcinoma cells.19
Statistical Analysis
Factors significantly correlating with uniformity and entropy were identified using univariate linear regression analysis for all 6 different filter levels. A P < 0.05 indicated statistical significance. Multivariate linear regression using stepwise selection was also performed. A factor entered the model if P < 0.2 and stayed in the model if P < 0.15. The Akaike information criterion (AIC) was used to validate and compare the models in order to select the best-fit filter level that was associated with increased heterogeneity.20 The filter level with the minimum AIC value was regarded as the preferred model.
All statistical analyses were performed using SAS software version 9.4 (SAS Institute, Cary, NC).
RESULTS
Patients
The pathological findings of 75 cancers are shown in Table 1. The mean age of the patients was 51 years (range, 26–78 years) and the mean lesion size measured by MRI was 17.7 mm (median, 15 mm; range, 11–120 mm). Median tumor cellularity was 70% (range, 20–90%). All masses included were IDC NOS, and ER or PR (+)/HER2 (–).
TABLE 1.
Pathological Characteristics of 75 Cases of Cancer
Correlation Between Texture Parameters and Pathology
Table 2 presents summarized P values of the correlation between texture parameters and detailed pathological findings. See Appendix S1 and S2 for further details of the univariate analysis. As tumor size increased, uniformity significantly reduced whereas entropy increased on T2-weighted unfiltered images (P = 0.015 and 0.008, respectively). High cellularity showed increased entropy only on T2-weighted unfiltered images (P = 0.049). In general, tumor grade showed significant differences in uniformity and entropy on T2- and contrast-enhanced T1-weighted subtraction images at almost all filter levels. On T1-weighted subtraction images, high-grade tumors exhibited greater uniformity and lower entropy values. On T2-weighted images, high grades correlated with decreased uniformity and increased entropy. A predominant stroma type was significantly correlated with entropy on T2-weighted images at filter levels of 0.5, 1.0, 1.5, 2.0, and 2.5. Compared with the collagen-dominant type, fibroblast- and lymphocyte-dominant types exhibited increased entropy.
TABLE 2.
P Values of the Univariate Analysis for Uniformity and Entropy According to Pathological Findings
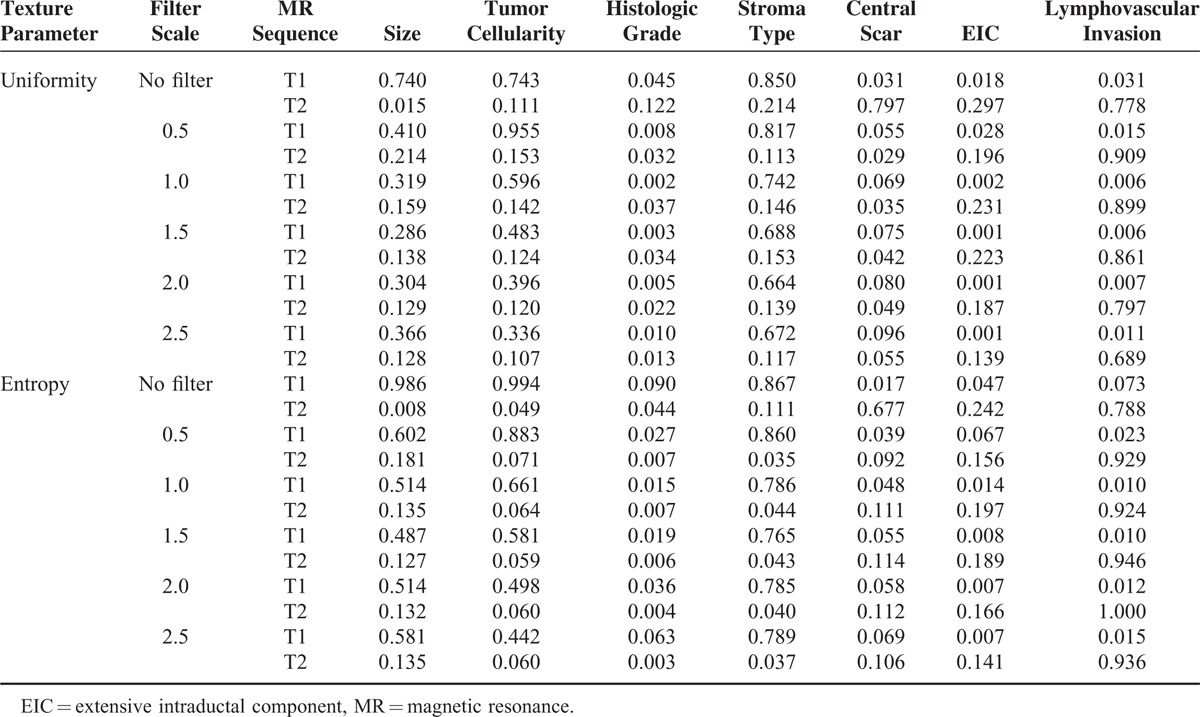
The presence of a central scar presented reduced uniformity and increased entropy on T1-weighted subtraction images at a filter level of 0.5 (P = 0.055 and 0.039, respectively). In contrast, on T2-weighted images, tumors with a central scar exhibited increased uniformity and reduced entropy (P = 0.029 and 0.092, respectively). EIC showed statistically significant correlation only on T1-weighted subtraction images at almost filter levels. IDC with an EIC presented increased uniformity and decreased entropy compared with those without an EIC. Similar to EIC, lymphovascular invasion significantly increased uniformity and decreased entropy on T1-weighted subtraction images at almost filter levels.
Multivariate Analysis
We performed a multivariate linear regression using stepwise selection to select a subset of variables that best explained the uniformity and entropy. In addition, to determine the best statistical model to reflect tumor heterogeneity, we compared the AIC values for each regression model. Tables 3 and 4 show the summarized results of the multivariate analysis. See Appendix S3 and S4 for further details of the multivariate analysis. Tumor cellularity and dominant stroma type did not affect uniformity or entropy on both T2- and contrast-enhanced T1-weighted subtraction images at all filter levels. As tumor size increased, only entropy on T2-weighted images significantly increased under no filter (P = 0.013). On contrast-enhanced T1-weighted subtraction images, high histologic grades were only associated with increased uniformity at 0.5, 1.0, 1.5, and 2.0 filter levels. On T2-weighted images, high histologic grades were associated with decreased uniformity and increased entropy at 0.5, 1.0, 1.5, 2.0, and 2.5 filter levels (Figures 2 and 3).
TABLE 3.
Regression Coefficients of Multivariate Analysis for Uniformity
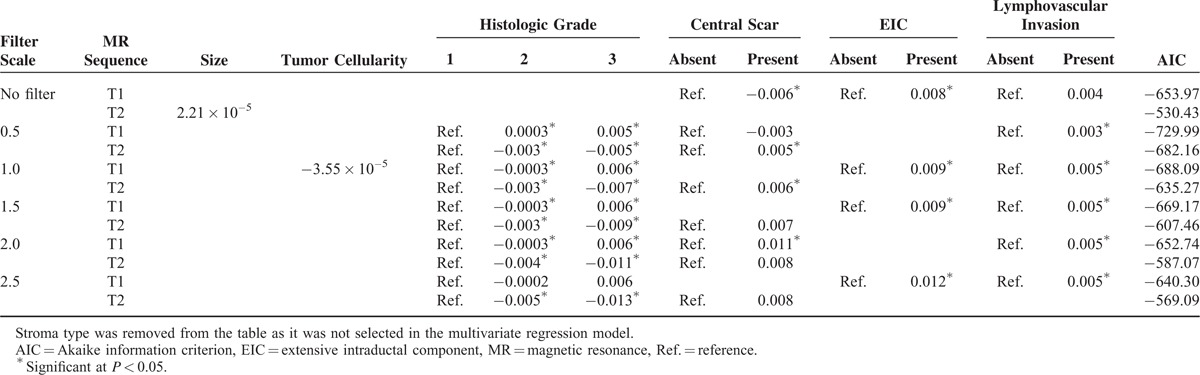
TABLE 4.
Regression Coefficients of Multivariate Analysis for Entropy
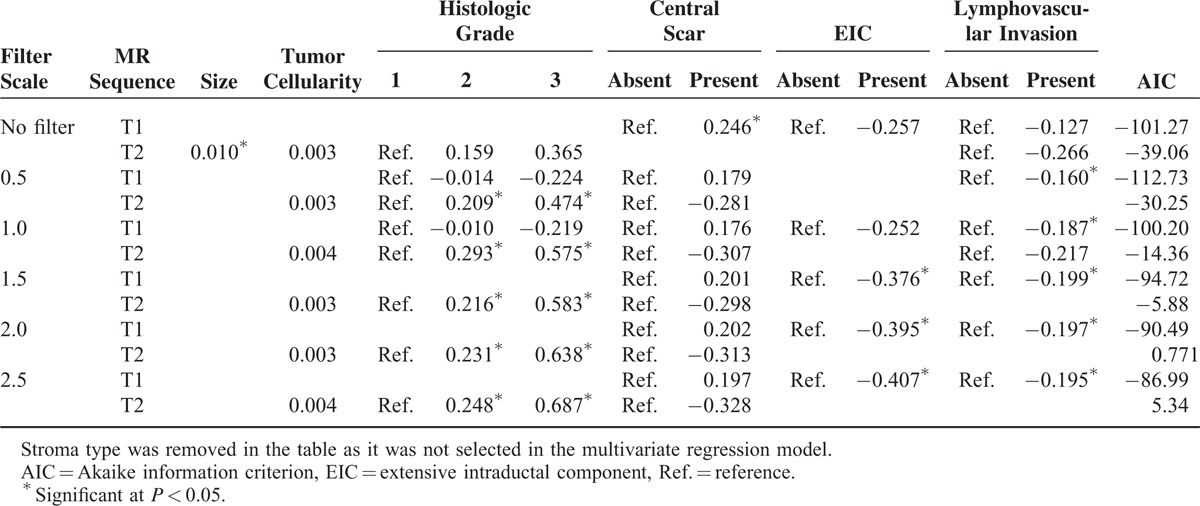
Tumors with a central scar were significantly associated with decreased uniformity and increased entropy on the contrast-enhanced T1-weighted subtraction unfiltered images. On T2-weighted images, only uniformity statistically increased, at the filter levels of 0.5 and 1.0. IDC with an EIC presented increased uniformity on contrast-enhanced T1-weigthed subtraction images compared with those without an EIC with no filter and at 1.0, 1.5, and 2.5 filter levels. IDC with an EIC showed decreased entropy on contrast-enhanced T1-weigthed subtraction images compared with those without an EIC at the filter levels of 2.0 and 2.5. IDCs with lymphovascular invasion were significantly associated with increased uniformity and decreased entropy only on contrast-enhanced T1-weighted subtraction images at the filter levels of 0.5, 1.0, 1.5, 2.0, and 2.5.
The best uniformity results were found on T2- and contrast-enhanced T1-weighted subtraction images at a filter level of 0.5, based on the AIC values. In terms of entropy, a filter level of 0.5 showed the strongest correlation on contrast-enhanced T1-weighted subtraction images. However, on T2-weighted images, the ideal model was achieved in the absence of a filter.
DISCUSSION
The findings of our multivariate analysis revealed that as tumor size increased, entropy significantly increased but only on T2-weighted unfiltered images. Tumor cellularity and predominant stroma did not affect uniformity or entropy on both T2- and contrast-enhanced T1-weighted subtraction images. Higher histologic grades showed increased uniformity and decreased entropy on contrast-enhanced T1-weighted subtraction images, whereas the opposite tendency was observed on T2-weighted images. The presence of a central scar showed the opposite results compared with histologic grade or EIC. IDCs with an EIC or lymphovascular invasion only presented with increased uniformity and decreased entropy on contrast-enhanced T1-weighted subtraction images. The best uniformity was observed on T2- and contrast-enhanced T1-weighted subtraction images at a filter level of 0.5, whereas the best entropy results were found at a filter level of 0.5 on contrast-enhanced T1-weighted subtraction images. However, on T2-weighted images, an ideal model was achieved in the absence of a filter.
Our study shows that texture analysis reflects the real tissue heterogeneity observed pathologically; however, results were not always statistically consistent according to different filter levels. Some of the results were contradictory. For example, a higher tumor grade presented larger uniformity and lower entropy on contrast-enhanced T1-weighted subtraction images, indicating reduced heterogeneity. In contrast, on T2-weighted images, higher tumor grades were associated with decreased uniformity and increased entropy, indicated greater heterogeneity. Similar trends were also observed for EIC and lymphovascular invasion, although statistical significance was only noted on contrast-enhanced T1-weighted subtraction images. We suspect that the reduced heterogenetic texture features (increased uniformity and decreased entropy) observed for the lesions presumed as more heterogenetic (higher grade, having an EIC, or lymphovascular invasion) were possibly because of the contrast enhancement. This suggests that more aggressive cancers could be more homogeneously enhanced because of a variety of reasons, such as increased vascularization, and therefore the results are the opposite on contrast-enhanced T1-weighted subtraction images. For the central scar, the results differed from those for tumor grade or EIC. We suspect that this is because the fibrotic nature of the central scar may inhibit homogenous enhancement.
Recently, Parikh et al reported that tumors become more homogenous during neoadjuvant chemotherapy and an increase in T2-weighted MR image uniformity and a reduction in T2-weighted MR image entropy following neoadjuvant chemotherapy may provide an earlier prediction of pathologic complete response than tumor size changes.15 Their hypothesis for improved performance of T2-weighted compared with contrast-enhanced T1-weighted images is based on the predominant underlying mechanism for signal intensity. Contrast-enhanced T1-weighted subtraction images reflect the vascular leakage and distribution of contrast agent after injection, whereas on T2-weighted MR images the signal intensity is predominantly derived from the tumor intracellular and extravascular extracellular space.15 In our study, uniformity and entropy were influenced by various pathological findings on both T2- and contrast-enhanced T1-weighted subtraction images, although results were not always consistent according to various filter levels. Therefore, we conclude that heterogeneity measured by MRI texture analysis correlates with pathological heterogeneity and that these findings can be used as evidence for predicting patient prognosis using texture analysis. In addition, we evaluated filters to determine which is the most appropriate for performing texture analysis. In our study, for uniformity, a filter level of 0.5 showed the best results on T2- and contrast-enhanced T1-weighted subtraction images. For entropy, a filter level of 0.5 was the best on T1-weighted images whereas an absence of filter was the best on T2-weighted images.
Our study has several limitations. First, as we examined only 75 ER-positive invasive breast cancers, our results cannot be generalized to all types of breast cancers. In addition, the small sample size limits statistical power; a larger study including a more representative clinical spectrum of morphological and histopathological subtypes is necessary to validate our findings. Second, we did not consider conventional imaging findings; for example, calcification was not included in our analysis, but could have affected texture values. Third, we did not assess the incremental value of texture analysis beyond conventional DCE-MRI. In addition, we could not provide any information on patient outcome. However, our results showed that more aggressive cancers exhibited more heterogeneous texture parameters on T2-weighted images and more homogeneous texture parameters on contrast-enhanced T1-weighted subtraction images. We can hypothesize that the outcomes of patients with more heterogeneous cancers based on texture analyses from T2-weighted MR images (also more homogenous on contrast-enhanced T1-weighted subtraction images) may be poor. We are currently performing another study to evaluate the effect of texture parameters on patient outcomes. Fourth, we assumed that tumor heterogeneity was pathologically expressed by characteristics analyzed in this paper, including tumor grade, tumor cellularity, and dominant stroma type, and correlated texture parameters with these pathological features. However, the definition of tumor heterogeneity has not been standardized and may vary across studies. Our results do show that uniformity and entropy correlate with pathological findings. Therefore, texture analysis could be a promising tool to help predict patient outcomes.
Assessment of tumor heterogeneity using texture analysis is relevant to clinical practice. T2- and contrast-enhanced T1-weighted images that are routinely obtained can easily be subjected to texture analysis during standard image processing. Our results indicate that texture analysis could be a useful clinical tool for quantifying tumor heterogeneity. In conclusion, we performed whole-tumor volumetric texture analyses and found that the texture parameters of T2- and contrast-enhanced T1-weighted subtraction images (at fine filter levels) correlated well with pathological tissue heterogeneity.
Supplementary Material
Footnotes
The authors have no funding and conflicts of interest to disclose.
REFERENCES
- 1.Castellano G, Bonilha L, Li LM, et al. Texture analysis of medical images. Clin Radiol 2004; 59:1061–1069. [DOI] [PubMed] [Google Scholar]
- 2.Kyriazi S, Collins DJ, Messiou C, et al. Metastatic ovarian and primary peritoneal cancer: assessing chemotherapy response with diffusion-weighted MR imaging-value of histogram analysis of apparent diffusion coefficients. Radiology 2011; 261:182–192. [DOI] [PubMed] [Google Scholar]
- 3.Lista F, Andres G, Caceres F, et al. Evaluation of risk of muscle invasion, perivesical and/or lymph node affectation by diffusion-weighted magnetic nuclear resonance in the patient who is a candidate for radical cystectomy. Actas Urol Esp 2013; 37:419–424. [DOI] [PubMed] [Google Scholar]
- 4.Donati OF, Mazaheri Y, Afaq A, et al. Prostate cancer aggressiveness: assessment with whole-lesion histogram analysis of the apparent diffusion coefficient. Radiology 2014; 271:143–152. [DOI] [PubMed] [Google Scholar]
- 5.Son JY, Lee HY, Lee KS, et al. Quantitative CT analysis of pulmonary ground-glass opacity nodules for the distinction of invasive adenocarcinoma from pre-invasive or minimally invasive adenocarcinoma. Plos One 2014; 9:e104066. [DOI] [PMC free article] [PubMed] [Google Scholar]
- 6.Ganeshan B, Abaleke S, Young RC, et al. Texture analysis of non-small cell lung cancer on unenhanced computed tomography: initial evidence for a relationship with tumor glucose metabolism and stage. Cancer Imaging 2010; 10:137–143. [DOI] [PMC free article] [PubMed] [Google Scholar]
- 7.Mikes KA, Ganeshan B, Griffiths MR, et al. Colorectal cancer: texture analysis of portal phase hepatic CT images as a potential marker of survival. Radiology 2009; 250:444–452. [DOI] [PubMed] [Google Scholar]
- 8.Goh V, Ganeshan B, Nathan P, et al. Assessment of response to tyrosine kinase inhibitors in metastatic renal cell cancers: CT texture as a predictive biomarker. Radiology 2011; 261:165–171. [DOI] [PubMed] [Google Scholar]
- 9.James D, Clymer BD, Schmalbrock P. Texture detection of simulated microcalcification susceptibility effects in magnetic resonance imaging of breasts. J Magn Reson Imaging 2001; 13:876–881. [DOI] [PubMed] [Google Scholar]
- 10.Gibbs P, Turnbull LW. Textural analysis of contrast-enhanced MR images of the breast. Magn Reson Med 2003; 50:92–98. [DOI] [PubMed] [Google Scholar]
- 11.Chen W, Giger ML, Li H, et al. Volumetric texture analysis of breast lesions on contrast-enhanced magnetic resonance images. Magn Reson Med 2007; 58:562–571. [DOI] [PubMed] [Google Scholar]
- 12.Woods BJ, Clymer BD, Kure T, et al. Malignant-lesion segmentation using 4D co-occurrence texture analysis applied to dynamic contrast-enhanced magnetic resonance breast image data. J Magn Reson Imaging 2007; 25:495–501. [DOI] [PubMed] [Google Scholar]
- 13.Holli k, Laaperi AL, Harrison L, et al. Characterization of breast cancer types by texture analysis of magnetic resonance images. Acad Radiol 2010; 17:135–141. [DOI] [PubMed] [Google Scholar]
- 14.Symmans WF, Peintinger F, Hatzis C, et al. Measurement of residual breast cancer burden to predict survival after neoadjuvant chemotherapy. J Clin Oncol 2007; 25:4414–4422. [DOI] [PubMed] [Google Scholar]
- 15.Parikh J, Selmi M, Charles-Edwards G, et al. Changes in primary breast cancer heterogeneity may augment midtreatment MR imaging assessment of response to neoadjuvant chemotherapy. Radiology 2014; 272:100–112. [DOI] [PubMed] [Google Scholar]
- 16.Nelson DA, Tan TT, Rabson AB, et al. Hypoxia and defective apoptosis drive genomic instability and tumorigenesis. Genes Dev 2004; 18:2095–2107. [DOI] [PMC free article] [PubMed] [Google Scholar]
- 17.Mesker WE, Junggeburt JM, Szuhai K, et al. The carcinoma-stromal ratio of colon carcinoma is an independent factor for survival compared to lymph node status and tumor stage. Cell Oncol 2007; 29:387–398. [DOI] [PMC free article] [PubMed] [Google Scholar]
- 18.Ko ES, Han BK, Kim RB, et al. Apparent diffusion coefficient in estrogen receptor-positive invasive ductal breast carcinoma: correlations with tumor-stroma ratio. Radiology 2014; 271:30–37. [DOI] [PubMed] [Google Scholar]
- 19.Hasebe T, Sasaki S, Imoto S, et al. Highly proliferative fibroblasts forming fibrotic focus govern metastasis of invasive ductal carcinoma of the breast. Mod Pathol 2001; 14:325–337. [DOI] [PubMed] [Google Scholar]
- 20.Springer, Akaike H. Atkinson AC, Feinberg SE. Prediction and entropy. A Celebration of Statistics 1985; 1–24. [Google Scholar]
Associated Data
This section collects any data citations, data availability statements, or supplementary materials included in this article.